Magellan Financial Group Limited is an Australian investment management firm specializing in global equities and global listed infrastructure, managing funds for retail, high net worth, and institutional investors.
Ticker code: MFG
Sector: Financial Services | Industry: Asset Management | Website: https://www.magellangroup.com.au
Market Information
| Market Capitalisation | Enterprise Value | Shares Outstanding | Free Float [%] | Free Float Value |
|---|---|---|---|---|
| $1,658,236,320 | $1,494,817,328 | 170075520 | 94.1 | $1,560,420,206 |
Balance Sheet & Quality
| Equity | Cash | Debt | Return On Equity (ROE) | EBITDA 25 Margin [%] | Net Debt / Equity [%] | Rule of 40 |
|---|---|---|---|---|---|---|
| $992,560,698 | $168,528,992 | $5,110,000 | 14.9 | 68.9 | -16.5 | 59.9 |
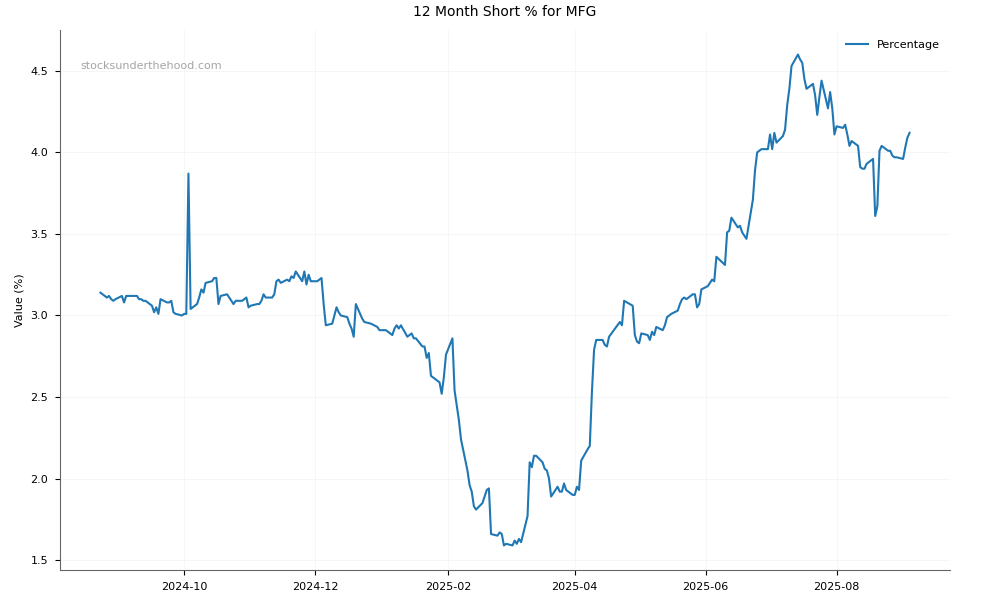
Technicals & Short Data
| 3EMA Status | Volatility [%] | Value Traded Today | Average Daily Liquidity | Short [%] | Days To Cover |
|---|---|---|---|---|---|
| Partial | 3.3 | $2,601,505 | $4,984,132 | 4.3 | 14.3 |
Dividends
| Previous Dividend | Last Dividend | Franking [%] | Ex-Div Date | Gross Yield [%] |
|---|---|---|---|---|
| $0.264 | $0.469 | 82.5 | 2025-08-25 | 6.4 |
Price Performance Snapshot
| Last Traded Price | Change [%] | 1 Week [%] | 1 Month [%] | 3 Months [%] | 6 Months [%] | 12 Months [%] |
|---|---|---|---|---|---|---|
| $9.750 | 0.4 | 2.6 | 0.8 | -5.6 | 22.8 | -5.9 |
MFG Price Chart with Volume and 3EMA

MFG Short Positions
Click HERE to understand why the above moving averages have been chosen.