McMillan Shakespeare Limited provides salary packaging, novated leasing, and fleet management services, as well as asset management and related financial products in Australia and the UK.
Ticker code: MMS
Sector: Industrials | Industry: Staffing & Employment Services | Website: https://mmsg.com.au
Market Information
| Market Capitalisation | Enterprise Value | Shares Outstanding | Free Float [%] | Free Float Value |
|---|---|---|---|---|
| $1,206,913,601 | $1,846,947,577 | 69643024 | 82.56 | $996,415,796 |
Balance Sheet & Quality
| Equity | Cash | Debt | Return On Equity (ROE) | EBITDA 25 Margin [%] | Net Debt / Equity [%] | Rule of 40 |
|---|---|---|---|---|---|---|
| $112,821,697 | $126,285,000 | $766,318,976 | 88.8 | None | 567.3 | None |
Technicals & Short Data
| 3EMA Status | Volatility [%] | Value Traded Today | Average Daily Liquidity | Short [%] | Days To Cover |
|---|---|---|---|---|---|
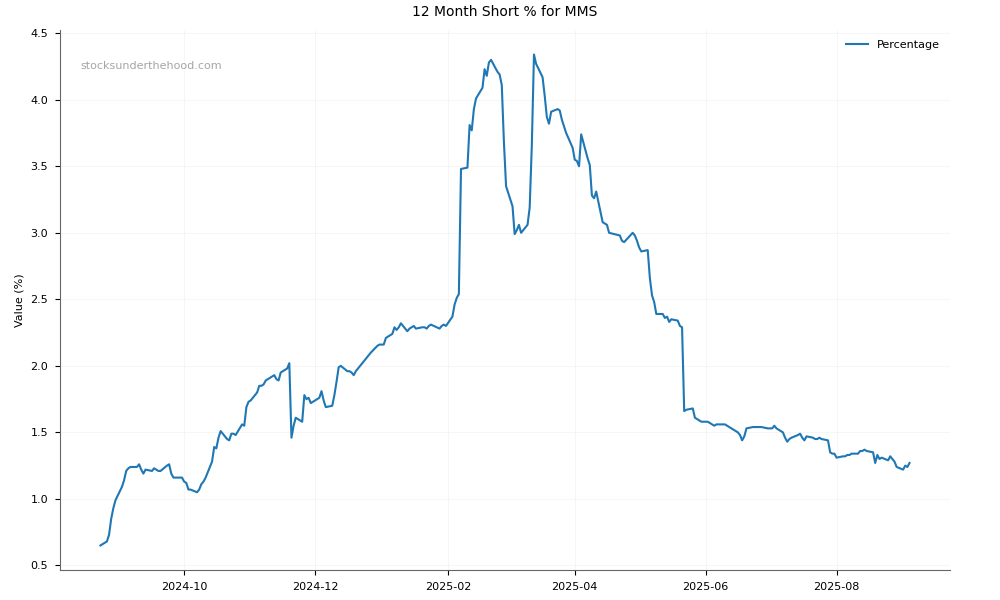
| Positive | 2.3 | $3,495,634 | $4,207,412 | 1.74 | 5.0 |
Dividends
| Previous Dividend | Last Dividend | Franking [%] | Ex-Div Date | Gross Yield [%] |
|---|---|---|---|---|
| $0.710 | $0.770 | 100.0 | 2025-09-11 | 6.3 |
Price Performance Snapshot
| Last Traded Price | Change [%] | 1 Week [%] | 1 Month [%] | 3 Months [%] | 6 Months [%] | 12 Months [%] |
|---|---|---|---|---|---|---|
| $17.330 | -1.5 | -0.1 | 1.1 | 3.1 | 20.0 | 28.5 |
MMS Price Chart with Volume and 3EMA

MMS Short Positions
Click HERE to understand why the above moving averages have been chosen.