Megaport Limited provides network-as-a-service (NaaS) solutions, enabling businesses to connect their networks to cloud services and data centers using a scalable, software-driven platform.
Ticker code: MP1
Sector: Technology | Industry: Software – Infrastructure | Website: https://www.megaport.com
Market Information
| Market Capitalisation | Enterprise Value | Shares Outstanding | Free Float [%] | Free Float Value |
|---|---|---|---|---|
| $2,413,010,964 | $2,339,503,964 | 181565912 | 85.59 | $2,065,188,832 |
Balance Sheet & Quality
| Equity | Cash | Debt | Return On Equity (ROE) | EBITDA 25 Margin [%] | Net Debt / Equity [%] | Rule of 40 |
|---|---|---|---|---|---|---|
| $201,719,731 | $102,338,000 | $28,831,000 | 0.0 | 27.3 | -36.4 | 45.0 |
Technicals & Short Data
| 3EMA Status | Volatility [%] | Value Traded Today | Average Daily Liquidity | Short [%] | Days To Cover |
|---|---|---|---|---|---|
| Negative | 12.5 | $5,228,698 | $10,372,765 | 2.31 | 5.4 |
Dividends
| Previous Dividend | Last Dividend | Franking [%] | Ex-Div Date | Gross Yield [%] |
|---|---|---|---|---|
| None | None | None | None | 0.0 |
Price Performance Snapshot
| Last Traded Price | Change [%] | 1 Week [%] | 1 Month [%] | 3 Months [%] | 6 Months [%] | 12 Months [%] |
|---|---|---|---|---|---|---|
| $13.290 | -1.0 | -4.0 | -13.1 | -5.7 | -3.3 | 78.9 |
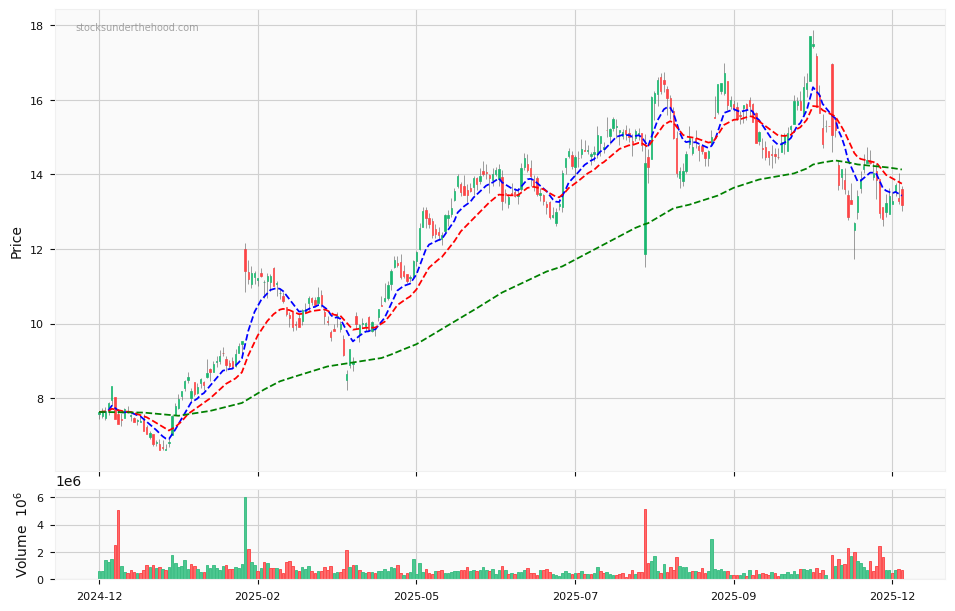
MP1 Price Chart with Volume and 3EMA
MP1 Short Positions

Click HERE to understand why the above moving averages have been chosen.