Meteoric Resources NL is a mineral exploration company focused on the exploration and development of gold and rare earth element projects in Australia and Brazil.
Ticker code: MEI
Sector: Basic Materials | Industry: Other Industrial Metals & Mining | Website: https://www.meteoric.com.au
Market Information
| Market Capitalisation | Enterprise Value | Shares Outstanding | Free Float [%] | Free Float Value |
|---|---|---|---|---|
| $396,140,128 | $385,497,536 | 2640934211.0 | 79.81 | $316,143,590 |
Balance Sheet & Quality
| Equity | Cash | Debt | Return On Equity (ROE) | EBITDA 25 Margin [%] | Net Debt / Equity [%] | Rule of 40 |
|---|---|---|---|---|---|---|
| $10,563,737 | $10,965,524 | $322,931 | None | None | -100.7 | None |
Technicals & Short Data
| 3EMA Status | Volatility [%] | Value Traded Today | Average Daily Liquidity | Short [%] | Days To Cover |
|---|---|---|---|---|---|
| Negative | 14.3 | $749,061 | $1,664,337 | None | 0.0 |
Dividends
| Previous Dividend | Last Dividend | Franking [%] | Ex-Div Date | Gross Yield [%] |
|---|---|---|---|---|
| None | None | None | None | None |
Price Performance Snapshot
| Last Traded Price | Change [%] | 1 Week [%] | 1 Month [%] | 3 Months [%] | 6 Months [%] | 12 Months [%] |
|---|---|---|---|---|---|---|
| $0.150 | 3.4 | 3.4 | -18.9 | 7.1 | 20.0 | 66.7 |
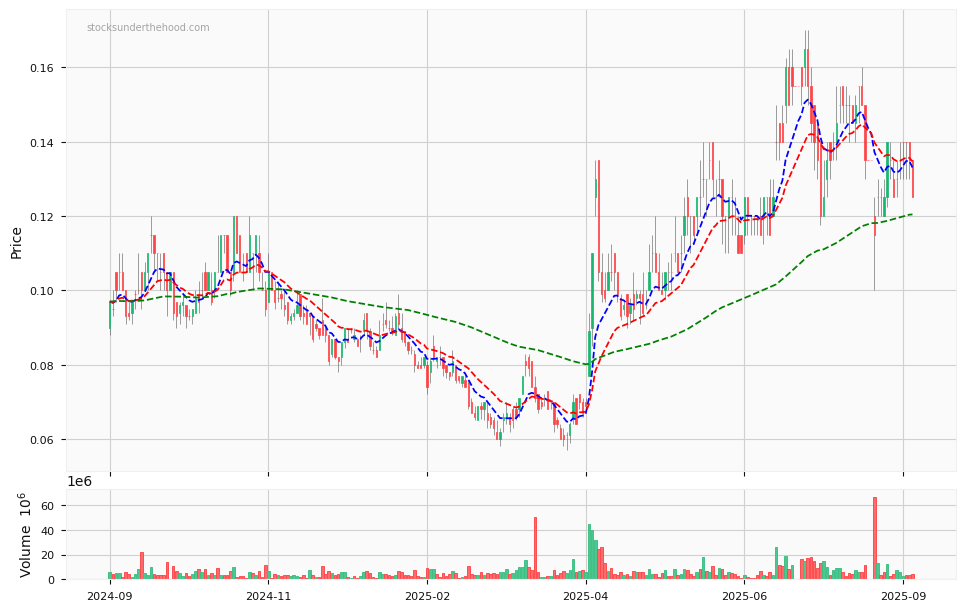
MEI Price Chart with Volume and 3EMA
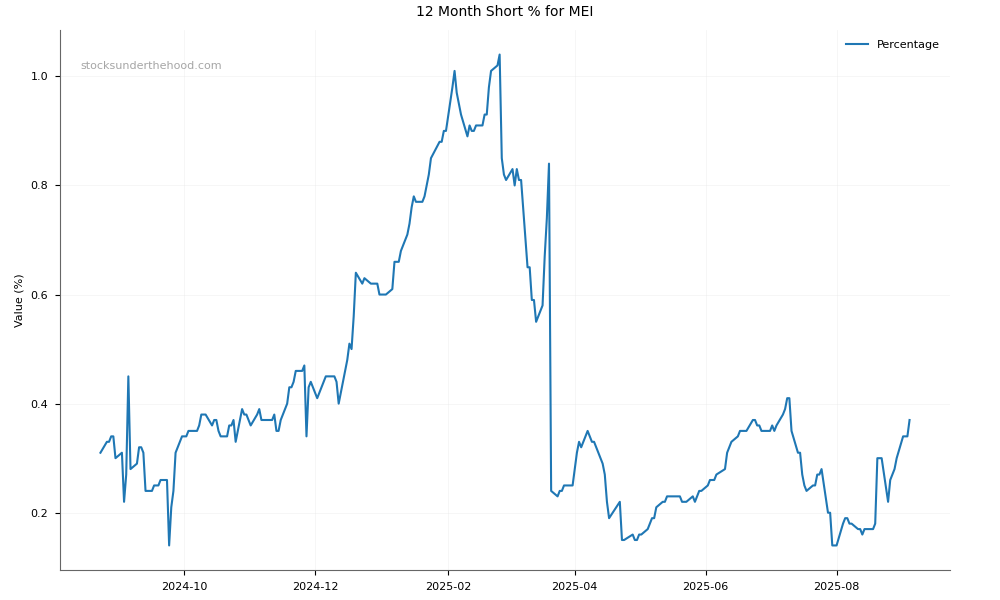
MEI Short Positions
Click HERE to understand why the above moving averages have been chosen.