ASX:MRE, managed by Metrics Credit Partners, is a stapled security offering exposure to diversified commercial real estate debt and equity investments in Australia and New Zealand. It generates income from debt instruments and potential equity upside.
Ticker code: MRE
Sector: Real Estate | Industry: ETF | Website: https://metrics.com.au/listed-funds/metrics-real-estate-multi-strategy-fund/
Market Information
| Market Capitalisation | Enterprise Value | Shares Outstanding | Free Float [%] | Free Float Value |
|---|---|---|---|---|
| $0 | $0 | None | 0.0 | $0 |
Balance Sheet & Quality
| Equity | Cash | Debt | Return On Equity (ROE) | EBITDA 25 Margin [%] | Net Debt / Equity [%] | Rule of 40 |
|---|---|---|---|---|---|---|
| None | $0 | None | 0.0 | None | 0.0 | None |
Technicals & Short Data
| 3EMA Status | Volatility [%] | Value Traded Today | Average Daily Liquidity | Short [%] | Days To Cover |
|---|---|---|---|---|---|
| Negative | 9.7 | $511,696 | $444,750 | None | 0.0 |
Dividends
| Previous Dividend | Last Dividend | Franking [%] | Ex-Div Date | Gross Yield [%] |
|---|---|---|---|---|
| $0.009 | $0.009 | 40.0 | 2025-09-30 | 0.0 |
Price Performance Snapshot
| Last Traded Price | Change [%] | 1 Week [%] | 1 Month [%] | 3 Months [%] | 6 Months [%] | 12 Months [%] |
|---|---|---|---|---|---|---|
| $1.870 | -0.5 | 0.3 | -4.2 | -5.2 | 6.8 | None |
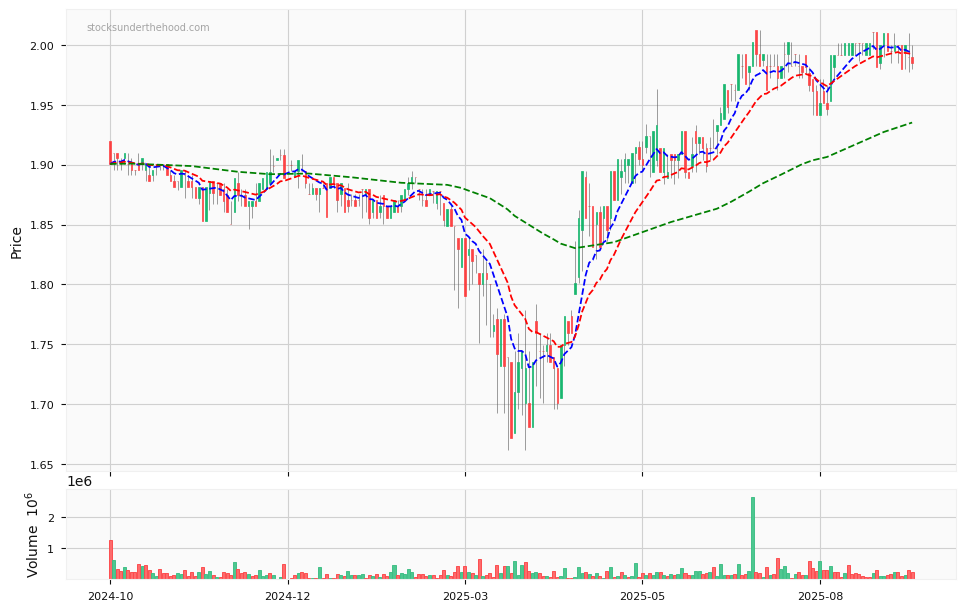
MRE Price Chart with Volume and 3EMA
MRE Short Positions
No chart available for this company.
Click HERE to understand why the above moving averages have been chosen.