Micron specializes in semiconductor memory and storage solutions, including DRAM and NAND flash used in computers, mobile devices, and data centers. It is a key supplier in the growing AI and cloud computing markets.
Ticker code: MU
Sector: Technology | Industry: Semiconductors | Website: https://www.micron.com
Market Information
| Market Capitalisation | Enterprise Value | Shares Outstanding | Free Float [%] | Free Float Value |
|---|---|---|---|---|
| $290,857,887,803 | $295,902,887,995 | 1125349754 | 99.35 | $288,969,518,367 |
Balance Sheet & Quality
| Equity | Cash | Debt | Return On Equity (ROE) | EBITDA 25 Margin [%] | Net Debt / Equity [%] | Rule of 40 |
|---|---|---|---|---|---|---|
| $54,326,261,548 | $10,307,000,320 | $15,352,000,512 | 14.4 | 54.3 | 9.3 | 86.0 |
Technicals & Short Data
| 3EMA Status | Volatility [%] | Value Traded Today | Average Daily Liquidity | Short [%] | Days To Cover |
|---|---|---|---|---|---|
| Positive | 9.1 | $4,422,494,440 | $6,635,543,643 | None | 0.0 |
Dividends
| Previous Dividend | Last Dividend | Franking [%] | Ex-Div Date | Gross Yield [%] |
|---|---|---|---|---|
| $0.115 | $0.115 | None | 2025-10-03 | 0.1 |
Price Performance Snapshot
| Last Traded Price | Change [%] | 1 Week [%] | 1 Month [%] | 3 Months [%] | 6 Months [%] | 12 Months [%] |
|---|---|---|---|---|---|---|
| $258.460 | -2.0 | 9.0 | 5.5 | 115.5 | 299.4 | 154.3 |
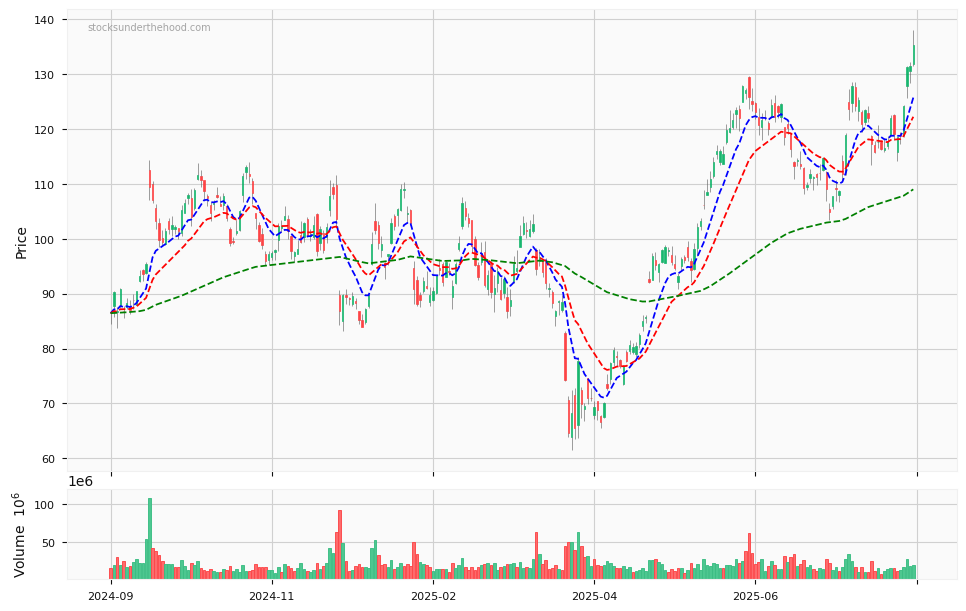
MU Price Chart with Volume and 3EMA
MU Short Positions
No chart available for this company.
Click HERE to understand why the above moving averages have been chosen.