Ticker code: MU
MU Red Flags & Risk Indicators
⚠️
⚠️
⚠️ RED FLAGS: 2 identified
- Falling Earnings
- High Relative Valuation
Income Statement
| Revenue 2024 Per Share | Revenue 2025e Per Share | Revenue 2026e Per Share | Revenue 24 to 25e [%] | Revenue 25e to 26e [%] | EBITDA 2024 Per Share | EBITDA 2025e Per Share | EBITDA 2026e Per Share | EBITDA 24 to 25e [%] | EBITDA 25e to 26e [%] |
|---|---|---|---|---|---|---|---|---|---|
| 22.67625 | 34.02983 | 39.32907 | 50.1 | 15.6 | 8.22879 | 18.42437 | 22.04836 | 123.9 | 19.7 |
MU Revenue Per Share (2012–2027)
✅✅
✅✅

MU Earnings before Interest, Tax, Depreciation and Amortisation (EBITDA) Per Share (2012–2027)
✅✅
✅✅

MU Normalised Earnings Per Share (EPS) (2012–2027)
✅✅
✅✅

Valuation
| Price To Sales | Price To Book | PER 2023 | PER 2024 | 13Y Median PER Low | PER 2025e | 13Y Median PER High | PER 2026e | Last Updated |
|---|---|---|---|---|---|---|---|---|
| 6.6 | 4.5 | -49.2 | 168.5 | 6.6 | 31.4 | 13.6 | 19.8 | 28/7/24 |
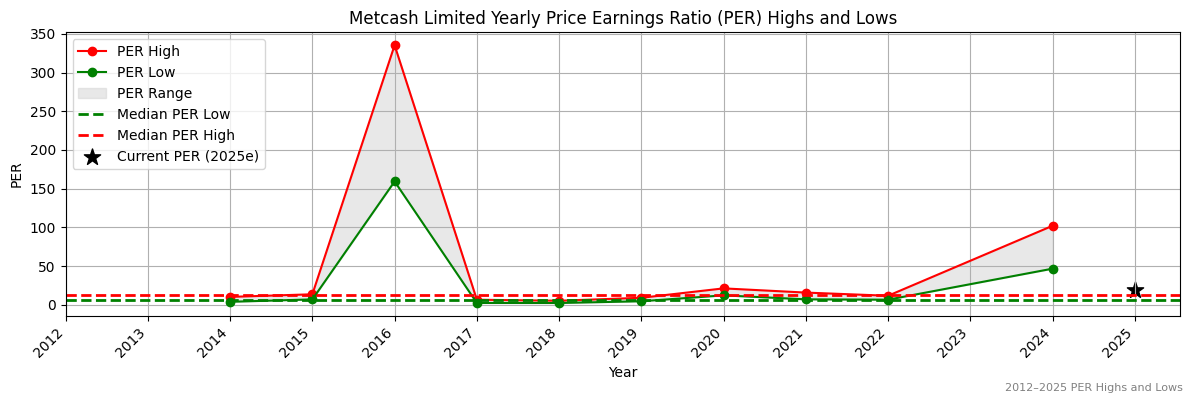
MU Yearly Price Earnings Ratio (PER) Highs and Lows
❌
❌
MU Weekly Price Chart with Average True Range (ATR) Trailing Stop (10-Year View)
