Monadelphous Group Limited is an engineering group providing construction, maintenance, and industrial services to the resources, energy, and infrastructure sectors across Australia.
Ticker code: MND
Sector: Industrials | Industry: Engineering & Construction | Website: https://www.monadelphous.com.au
Market Information
| Market Capitalisation | Enterprise Value | Shares Outstanding | Free Float [%] | Free Float Value |
|---|---|---|---|---|
| $2,239,048,050 | $2,113,517,058 | 99380736 | 93.44 | $2,092,193,496 |
Balance Sheet & Quality
| Equity | Cash | Debt | Return On Equity (ROE) | EBITDA 25 Margin [%] | Net Debt / Equity [%] | Rule of 40 |
|---|---|---|---|---|---|---|
| $500,580,798 | $205,828,992 | $80,298,000 | 15.7 | 7.3 | -25.1 | 12.9 |
Technicals & Short Data
| 3EMA Status | Volatility [%] | Value Traded Today | Average Daily Liquidity | Short [%] | Days To Cover |
|---|---|---|---|---|---|
| Positive | 2.2 | $2,601,922 | $5,327,106 | 0.34 | 1.4 |
Dividends
| Previous Dividend | Last Dividend | Franking [%] | Ex-Div Date | Gross Yield [%] |
|---|---|---|---|---|
| $0.330 | $0.390 | 100.0 | 2025-09-03 | 2.5 |
Price Performance Snapshot
| Last Traded Price | Change [%] | 1 Week [%] | 1 Month [%] | 3 Months [%] | 6 Months [%] | 12 Months [%] |
|---|---|---|---|---|---|---|
| $22.530 | 0.2 | -1.1 | 0.4 | 20.7 | 48.0 | 86.8 |
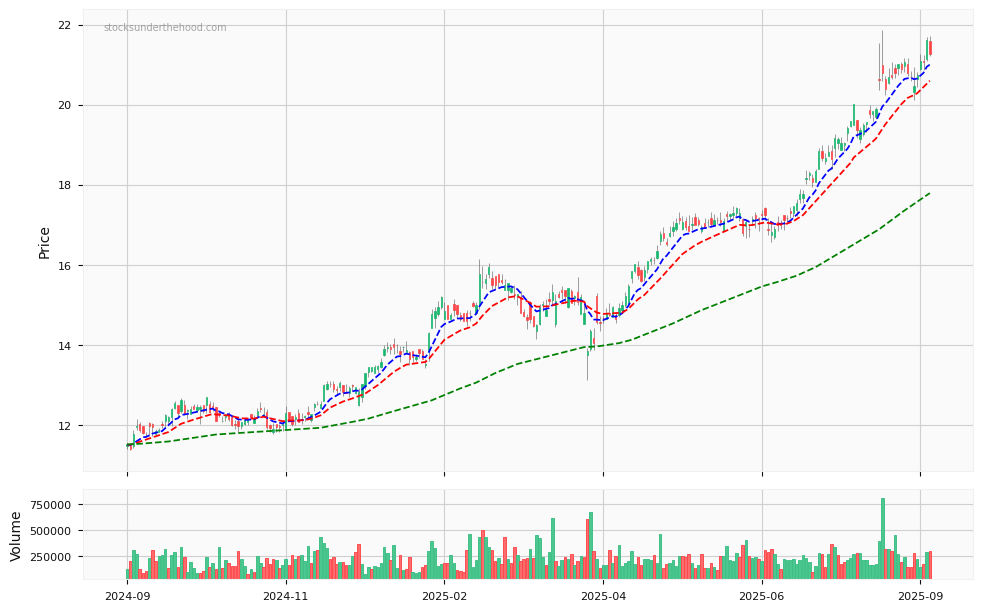
MND Price Chart with Volume and 3EMA
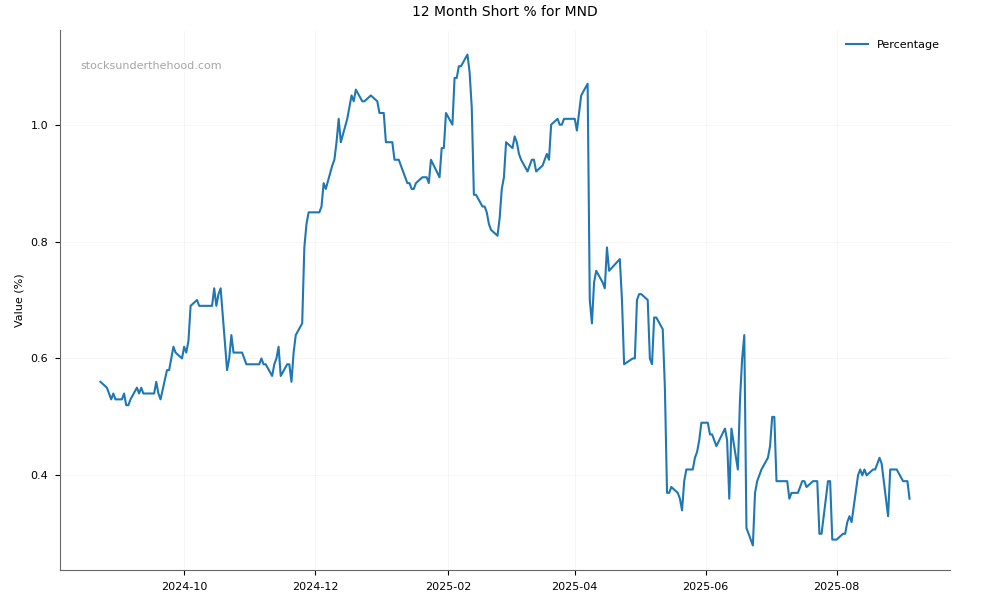
MND Short Positions
Click HERE to understand why the above moving averages have been chosen.