MyState Limited is a diversified financial services group providing banking, trustee, and wealth management services, primarily operating in Tasmania and southeast Australia.
Ticker code: MYS
Sector: Financial Services | Industry: Banks – Regional | Website: https://www.mystatelimited.com.au
Market Information
| Market Capitalisation | Enterprise Value | Shares Outstanding | Free Float [%] | Free Float Value |
|---|---|---|---|---|
| $763,593,683 | $3,801,424,659 | 169687485 | 94.34 | $720,354,132 |
Balance Sheet & Quality
| Equity | Cash | Debt | Return On Equity (ROE) | EBITDA 25 Margin [%] | Net Debt / Equity [%] | Rule of 40 |
|---|---|---|---|---|---|---|
| $738,649,704 | $359,192,000 | $3,397,022,976 | 7.6 | 32.3 | 411.3 | 5.3 |
Technicals & Short Data
| 3EMA Status | Volatility [%] | Value Traded Today | Average Daily Liquidity | Short [%] | Days To Cover |
|---|---|---|---|---|---|
| Positive | 2.7 | $708,503 | $1,053,743 | 0.42 | 3.0 |
Dividends
| Previous Dividend | Last Dividend | Franking [%] | Ex-Div Date | Gross Yield [%] |
|---|---|---|---|---|
| $0.105 | $0.110 | 100.0 | 2025-08-22 | 3.5 |
Price Performance Snapshot
| Last Traded Price | Change [%] | 1 Week [%] | 1 Month [%] | 3 Months [%] | 6 Months [%] | 12 Months [%] |
|---|---|---|---|---|---|---|
| $4.500 | 0.9 | 2.3 | -0.9 | 5.6 | 5.3 | 16.9 |
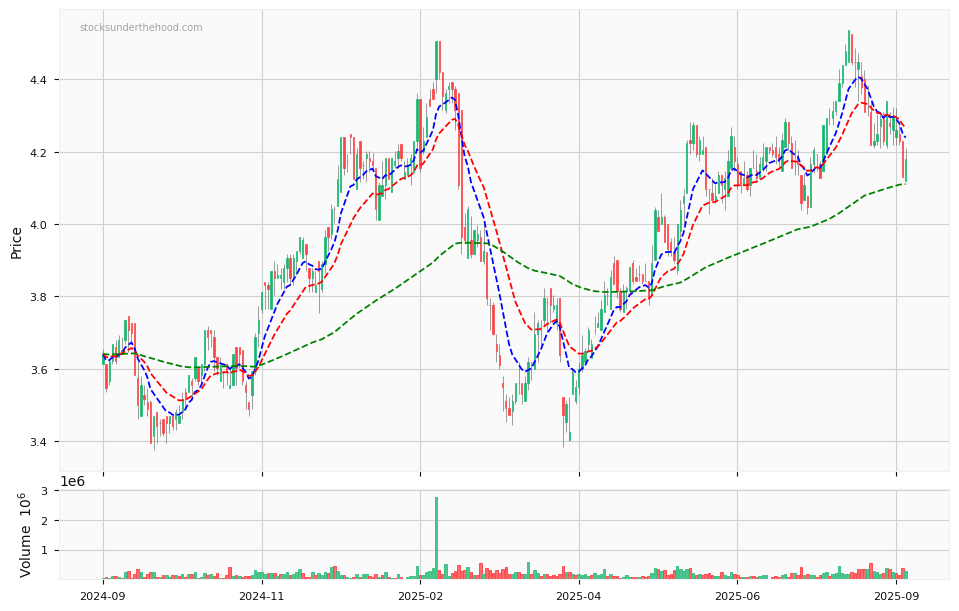
MYS Price Chart with Volume and 3EMA
MYS Short Positions

Click HERE to understand why the above moving averages have been chosen.