National Australia Bank Limited is one of Australia’s leading financial institutions, offering a comprehensive range of banking and financial services to individuals, businesses, and institutions domestically and internationally.
Ticker code: NAB
Sector: Financial Services | Industry: Banks – Diversified | Website: https://www.nab.com.au
Market Information
| Market Capitalisation | Enterprise Value | Shares Outstanding | Free Float [%] | Free Float Value |
|---|---|---|---|---|
| $132,124,140,458 | $242,824,143,786 | 3054893421 | 99.96 | $132,067,352,127 |
Balance Sheet & Quality
| Equity | Cash | Debt | Return On Equity (ROE) | EBITDA 25 Margin [%] | Net Debt / Equity [%] | Rule of 40 |
|---|---|---|---|---|---|---|
| $62,170,135,798 | $179,623,002,112 | $290,323,005,440 | 10.8 | None | 178.1 | None |
Technicals & Short Data
| 3EMA Status | Volatility [%] | Value Traded Today | Average Daily Liquidity | Short [%] | Days To Cover |
|---|---|---|---|---|---|
| Partial | 1.6 | $156,512,927 | $182,718,794 | 0.39 | 2.8 |
Dividends
| Previous Dividend | Last Dividend | Franking [%] | Ex-Div Date | Gross Yield [%] |
|---|---|---|---|---|
| $0.850 | $0.850 | 100.0 | 2025-05-12 | 2.8 |
Price Performance Snapshot
| Last Traded Price | Change [%] | 1 Week [%] | 1 Month [%] | 3 Months [%] | 6 Months [%] | 12 Months [%] |
|---|---|---|---|---|---|---|
| $43.250 | -0.3 | -1.1 | -0.9 | 15.3 | 24.0 | 17.6 |
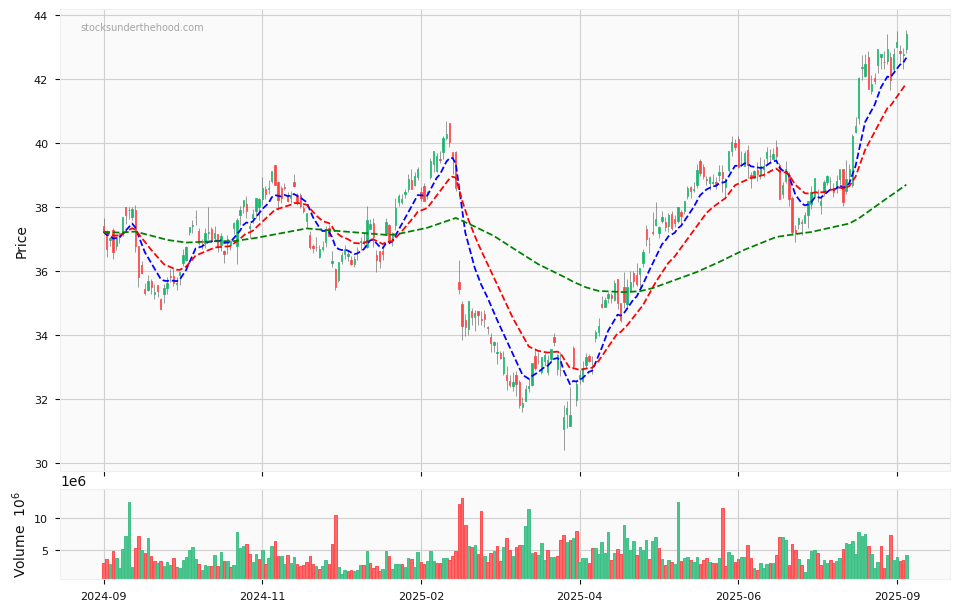
NAB Price Chart with Volume and 3EMA
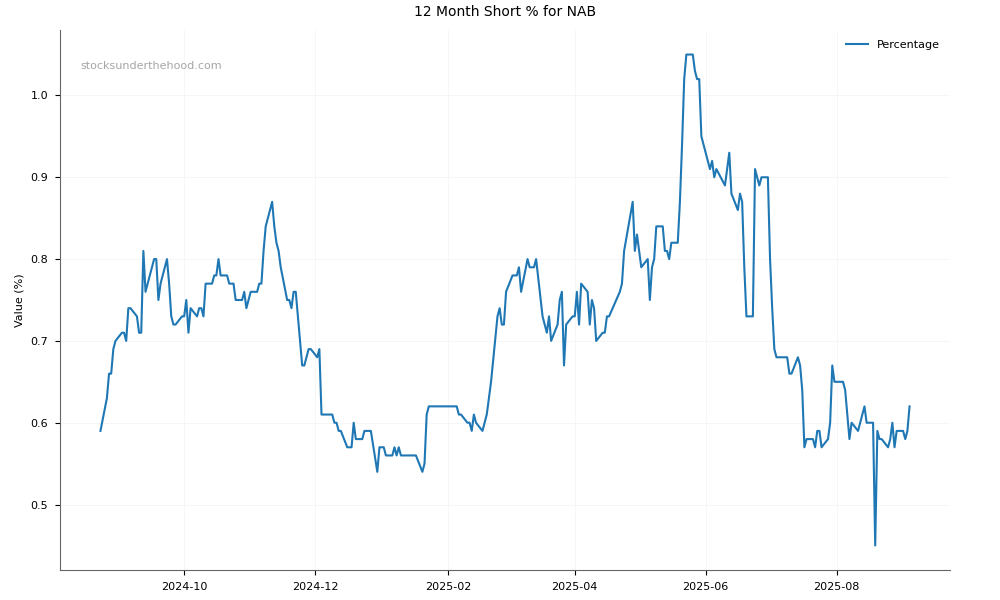
NAB Short Positions
Click HERE to understand why the above moving averages have been chosen.