Netwealth Group Limited offers investment and superannuation platform solutions, providing financial intermediaries and investors with a range of portfolio administration and management services.
Ticker code: NWL
Sector: Technology | Industry: Software – Application | Website: https://www.netwealth.com.au
Market Information
| Market Capitalisation | Enterprise Value | Shares Outstanding | Free Float [%] | Free Float Value |
|---|---|---|---|---|
| $6,612,747,155 | $6,453,206,163 | 245370945 | 47.41 | $3,134,864,918 |
Balance Sheet & Quality
| Equity | Cash | Debt | Return On Equity (ROE) | EBITDA 25 Margin [%] | Net Debt / Equity [%] | Rule of 40 |
|---|---|---|---|---|---|---|
| $199,486,593 | $173,044,992 | $13,504,000 | 58.8 | 50.3 | -80.0 | 75.7 |
Technicals & Short Data
| 3EMA Status | Volatility [%] | Value Traded Today | Average Daily Liquidity | Short [%] | Days To Cover |
|---|---|---|---|---|---|
| Negative | 7.3 | $21,522,783 | $16,687,414 | 0.18 | 0.7 |
Dividends
| Previous Dividend | Last Dividend | Franking [%] | Ex-Div Date | Gross Yield [%] |
|---|---|---|---|---|
| $0.175 | $0.210 | 100.0 | 2025-09-03 | 1.1 |
Price Performance Snapshot
| Last Traded Price | Change [%] | 1 Week [%] | 1 Month [%] | 3 Months [%] | 6 Months [%] | 12 Months [%] |
|---|---|---|---|---|---|---|
| $26.950 | 0.9 | -1.5 | -10.9 | -14.4 | -16.3 | -5.9 |
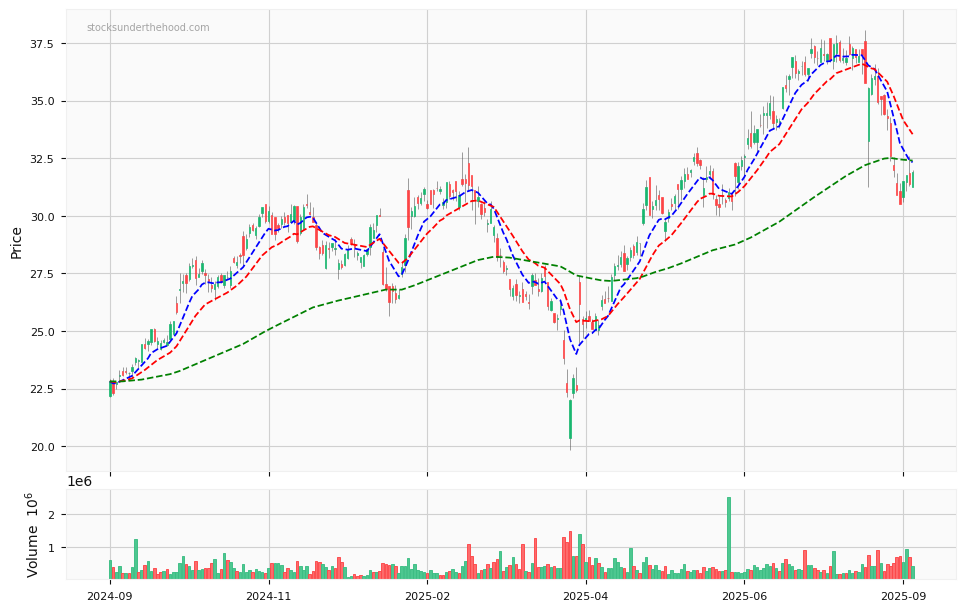
NWL Price Chart with Volume and 3EMA
NWL Short Positions

Click HERE to understand why the above moving averages have been chosen.