Ticker code: NEU
NEU Red Flags & Risk Indicators
❌
❌
⚠️ RED FLAGS: 4 identified
- Highly Shorted
- Increasing Shorts
- High Price to Book vs ROE
- Falling EBITDA Margins
Income Statement
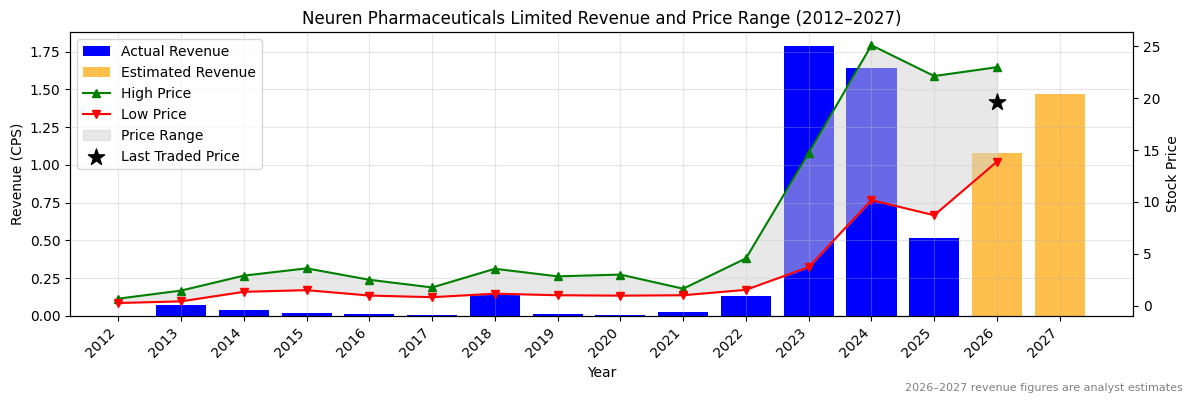
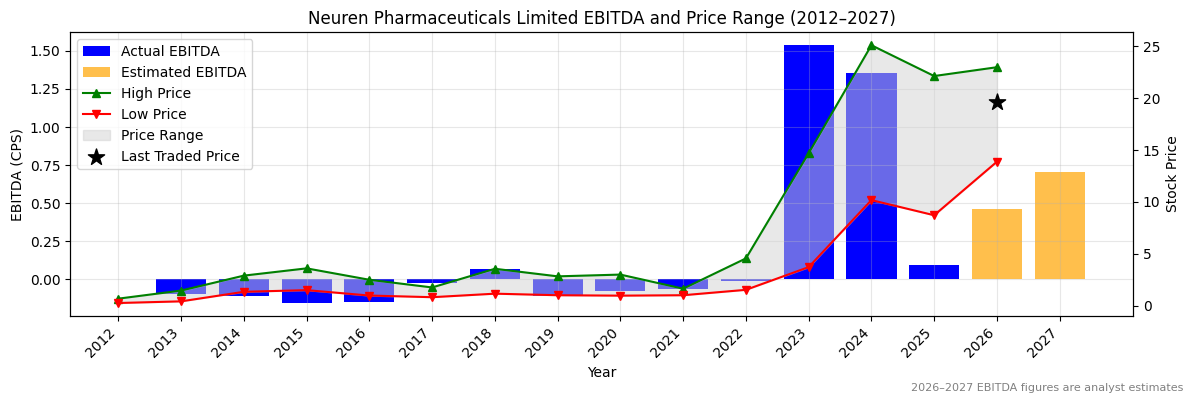
| Revenue 2024 Per Share | Revenue 2025e Per Share | Revenue 2026e Per Share | Revenue 24 to 25e [%] | Revenue 25e to 26e [%] | EBITDA 2024 Per Share | EBITDA 2025e Per Share | EBITDA 2026e Per Share | EBITDA 24 to 25e [%] | EBITDA 25e to 26e [%] |
|---|---|---|---|---|---|---|---|---|---|
| 1.64454 | 0.51696 | 1.07906 | -68.6 | 108.7 | 1.35417 | 0.09691 | 0.4613 | -92.8 | 376.0 |
NEU Revenue Per Share (2012–2027)
❌
❌
NEU Earnings before Interest, Tax, Depreciation and Amortisation (EBITDA) Per Share (2012–2027)
❌
❌
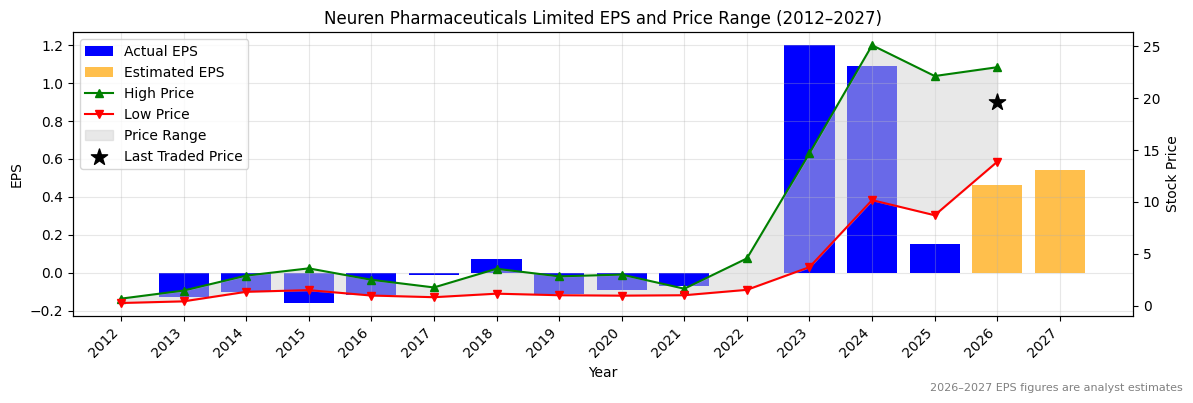
NEU Normalised Earnings Per Share (EPS) (2012–2027)
❌
❌
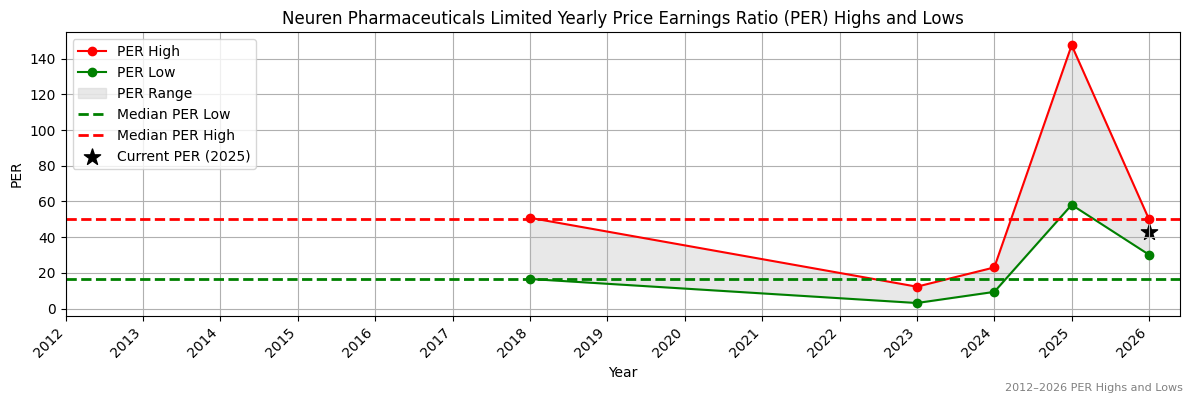
Valuation
| Price To Sales | Price To Book | PER 2023 | PER 2024 | 13Y Median PER Low | PER 2025e | 13Y Median PER High | PER 2026e | Last Updated |
|---|---|---|---|---|---|---|---|---|
| 12.6 | 8.4 | 18.1 | 20.0 | 16.6 | 145.1 | 50.0 | 47.3 | 4/10/25 |
NEU Yearly Price Earnings Ratio (PER) Highs and Lows
❌
❌
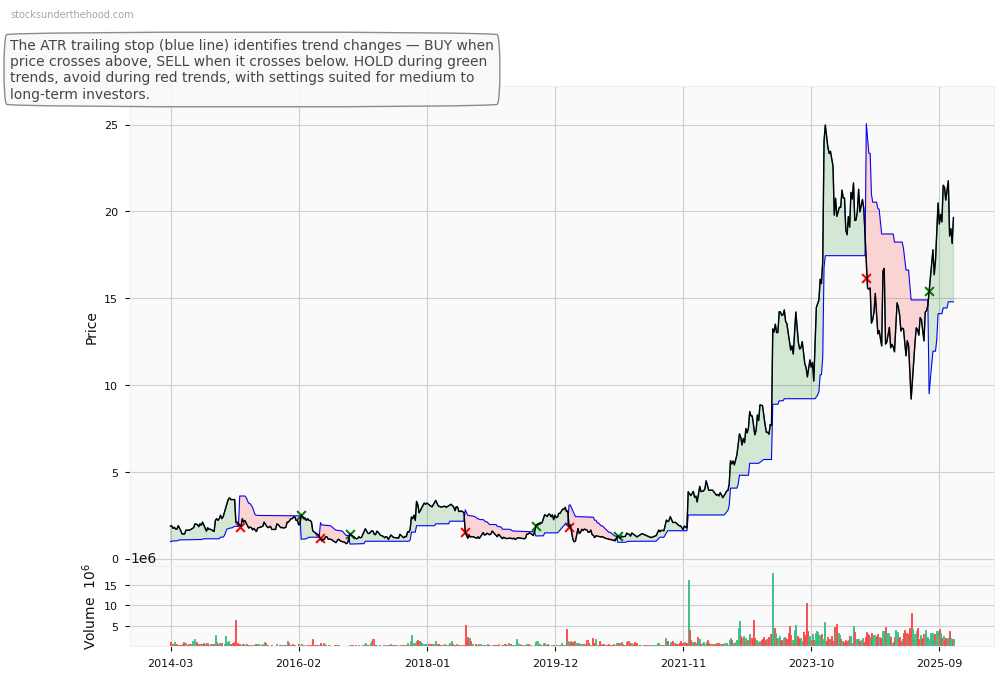
NEU Weekly Price Chart with Average True Range (ATR) Trailing Stop (10-Year View)