Newmont Corporation (ASX:NEM): A leading gold mining company with operations spanning multiple continents.
Ticker code: NEM
Sector: Basic Materials | Industry: Gold | Website: https://www.newmont.com
Market Information
| Market Capitalisation | Enterprise Value | Shares Outstanding | Free Float [%] | Free Float Value |
|---|---|---|---|---|
| $163,754,920,265 | $163,438,920,009 | 1091262981 | 99.78 | $163,401,209,643 |
Balance Sheet & Quality
| Equity | Cash | Debt | Return On Equity (ROE) | EBITDA 25 Margin [%] | Net Debt / Equity [%] | Rule of 40 |
|---|---|---|---|---|---|---|
| $49,709,003,967 | $5,967,000,064 | $5,650,999,808 | 14.8 | 62.0 | -0.6 | 51.2 |
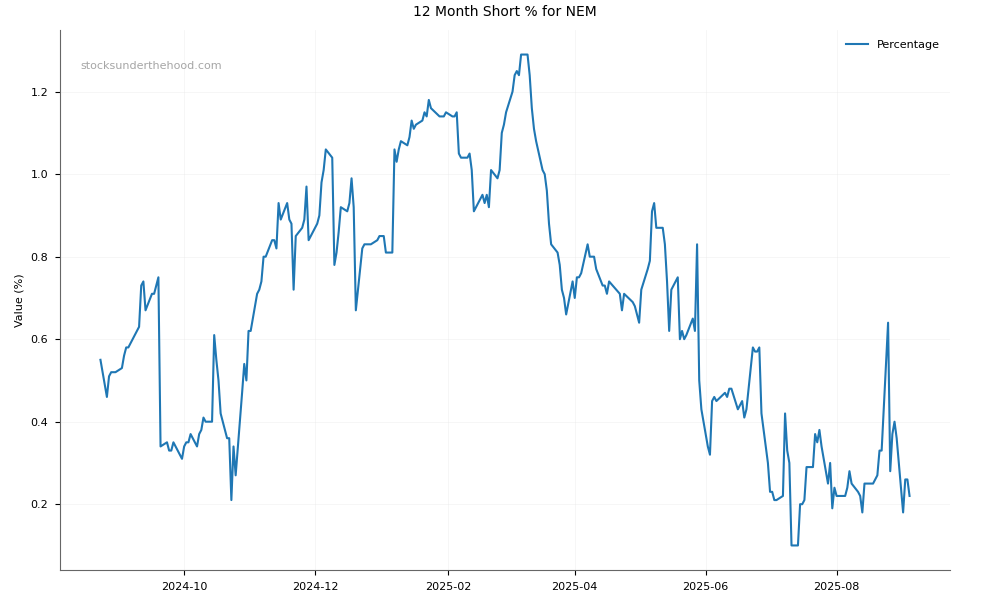
Technicals & Short Data
| 3EMA Status | Volatility [%] | Value Traded Today | Average Daily Liquidity | Short [%] | Days To Cover |
|---|---|---|---|---|---|
| Positive | 6.2 | $66,792,755 | $75,537,802 | 0.39 | 8.5 |
Dividends
| Previous Dividend | Last Dividend | Franking [%] | Ex-Div Date | Gross Yield [%] |
|---|---|---|---|---|
| $0.377 | $0.377 | None | 2025-11-25 | 0.5 |
Price Performance Snapshot
| Last Traded Price | Change [%] | 1 Week [%] | 1 Month [%] | 3 Months [%] | 6 Months [%] | 12 Months [%] |
|---|---|---|---|---|---|---|
| $150.060 | 5.7 | 8.6 | 9.2 | 29.8 | 78.1 | 131.2 |
NEM Price Chart with Volume and 3EMA

NEM Short Positions
Click HERE to understand why the above moving averages have been chosen.