nib Holdings Limited provides health and medical insurance products to residents of Australia and New Zealand, as well as international students and visitors.
Ticker code: NHF
Sector: Financial Services | Industry: Insurance – Specialty | Website: https://www.nib.com.au
Market Information
| Market Capitalisation | Enterprise Value | Shares Outstanding | Free Float [%] | Free Float Value |
|---|---|---|---|---|
| $3,366,879,272 | $2,324,579,304 | 487953511 | 98.87 | $3,328,834,590 |
Balance Sheet & Quality
| Equity | Cash | Debt | Return On Equity (ROE) | EBITDA 25 Margin [%] | Net Debt / Equity [%] | Rule of 40 |
|---|---|---|---|---|---|---|
| $1,115,461,706 | $1,352,499,968 | $310,200,000 | 18.4 | None | -93.4 | None |
Technicals & Short Data
| 3EMA Status | Volatility [%] | Value Traded Today | Average Daily Liquidity | Short [%] | Days To Cover |
|---|---|---|---|---|---|
| Negative | 6.5 | $5,938,651 | $4,489,637 | 1.18 | 8.8 |
Dividends
| Previous Dividend | Last Dividend | Franking [%] | Ex-Div Date | Gross Yield [%] |
|---|---|---|---|---|
| $0.130 | $0.160 | 100.0 | 2025-09-04 | 3.3 |
Price Performance Snapshot
| Last Traded Price | Change [%] | 1 Week [%] | 1 Month [%] | 3 Months [%] | 6 Months [%] | 12 Months [%] |
|---|---|---|---|---|---|---|
| $6.900 | 1.2 | 2.7 | -8.6 | -6.4 | 6.0 | 29.3 |
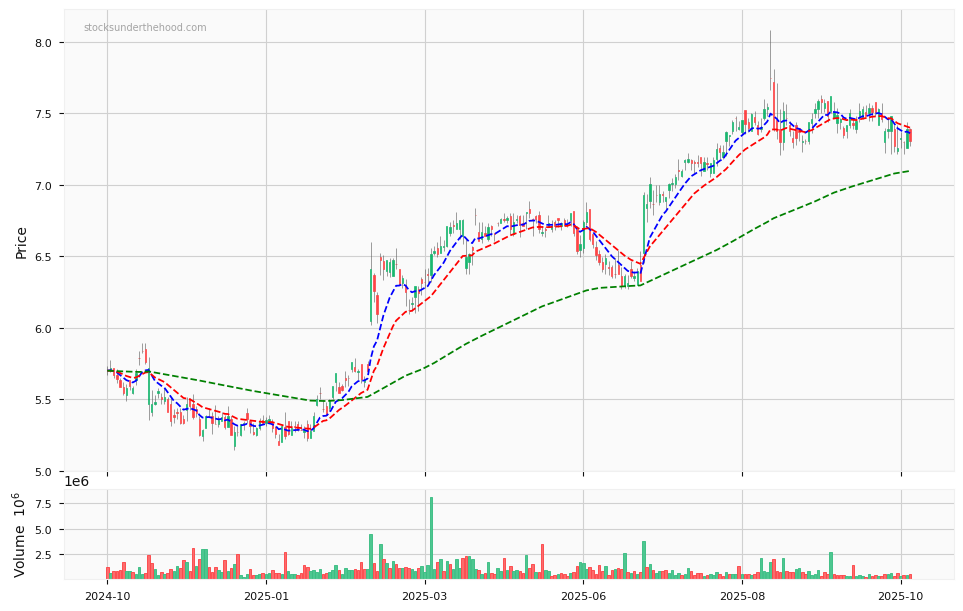
NHF Price Chart with Volume and 3EMA
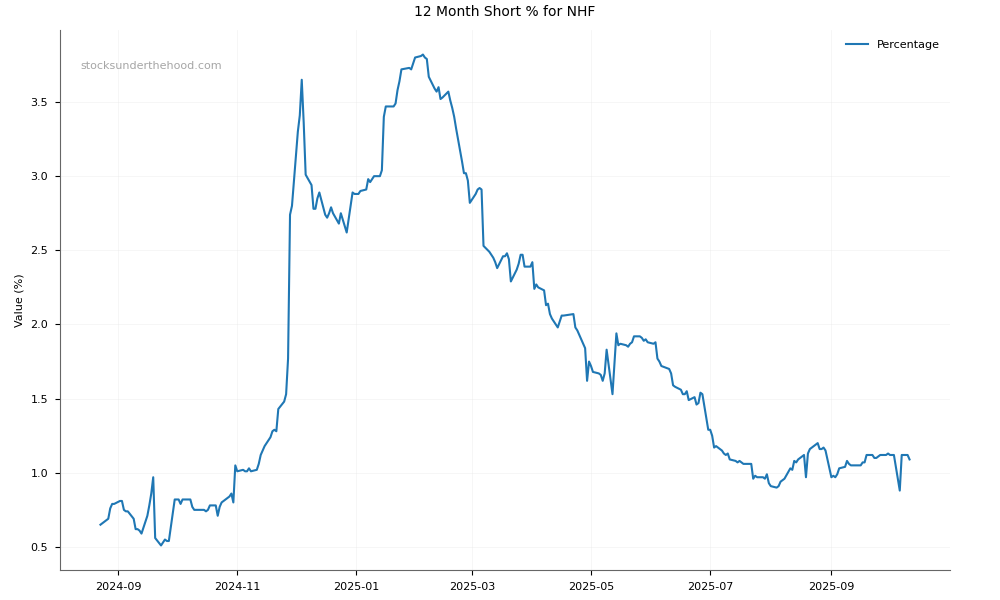
NHF Short Positions
Click HERE to understand why the above moving averages have been chosen.