Nine Entertainment Co. Holdings Limited is a diversified media company with interests in television broadcasting, digital media, newspapers, and radio, delivering a broad range of content across Australia.
Ticker code: NEC
Sector: Communication Services | Industry: Entertainment | Website: https://www.nineforbrands.com.au
Market Information
| Market Capitalisation | Enterprise Value | Shares Outstanding | Free Float [%] | Free Float Value |
|---|---|---|---|---|
| $1,910,843,426 | $2,827,740,418 | 1585762123 | 78.68 | $1,503,450,387 |
Balance Sheet & Quality
| Equity | Cash | Debt | Return On Equity (ROE) | EBITDA 25 Margin [%] | Net Debt / Equity [%] | Rule of 40 |
|---|---|---|---|---|---|---|
| $1,574,661,794 | $141,668,000 | $1,058,564,992 | 9.1 | 17.1 | 58.2 | 30.4 |
Technicals & Short Data
| 3EMA Status | Volatility [%] | Value Traded Today | Average Daily Liquidity | Short [%] | Days To Cover |
|---|---|---|---|---|---|
| Negative | 2.0 | $3,061,639 | $8,095,459 | 1.91 | 4.5 |
Dividends
| Previous Dividend | Last Dividend | Franking [%] | Ex-Div Date | Gross Yield [%] |
|---|---|---|---|---|
| $0.035 | $0.530 | 100.0 | 2025-09-11 | 62.8 |
Price Performance Snapshot
| Last Traded Price | Change [%] | 1 Week [%] | 1 Month [%] | 3 Months [%] | 6 Months [%] | 12 Months [%] |
|---|---|---|---|---|---|---|
| $1.205 | None | None | 3.9 | 4.5 | 23.7 | 52.3 |
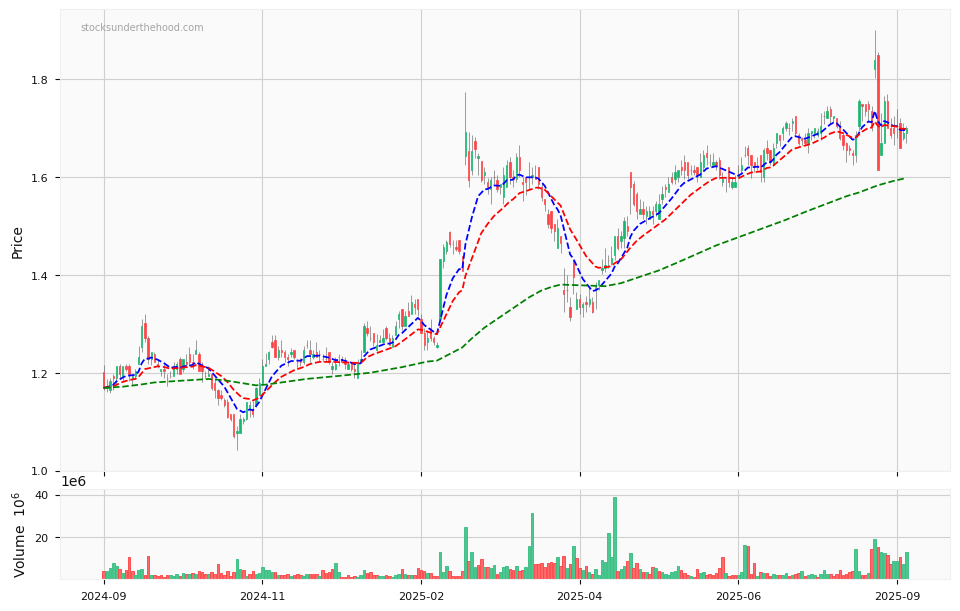
NEC Price Chart with Volume and 3EMA
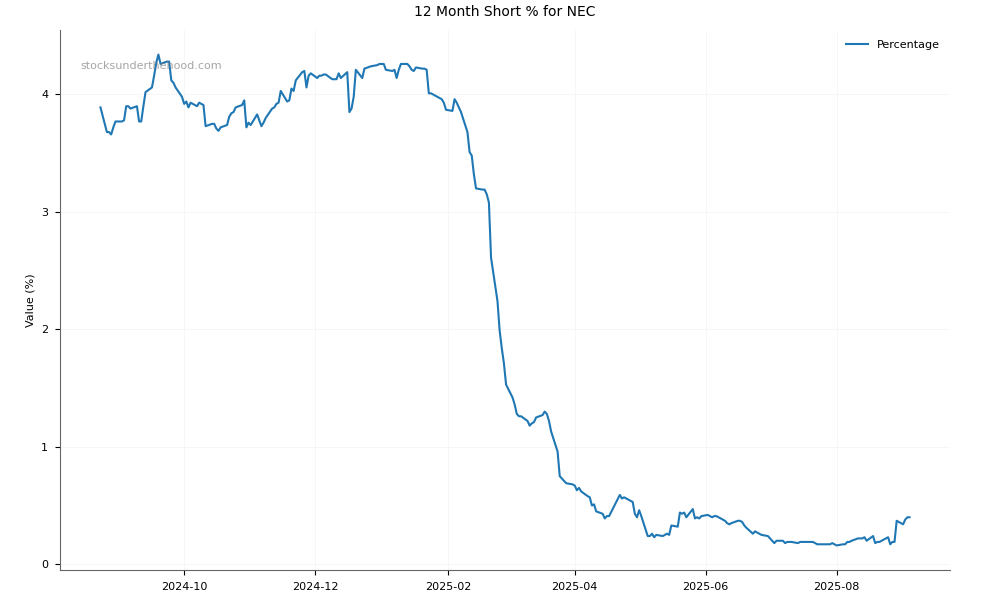
NEC Short Positions
Click HERE to understand why the above moving averages have been chosen.