Nufarm Limited is an agricultural chemicals company involved in the manufacturing and supply of crop protection products and seeds, serving customers globally.
Ticker code: NUF
Sector: Basic Materials | Industry: Agricultural Inputs | Website: https://www.nufarm.com
Market Information
| Market Capitalisation | Enterprise Value | Shares Outstanding | Free Float [%] | Free Float Value |
|---|---|---|---|---|
| $840,797,025 | $2,203,184,097 | 383925572 | 90.7 | $762,576,030 |
Balance Sheet & Quality
| Equity | Cash | Debt | Return On Equity (ROE) | EBITDA 25 Margin [%] | Net Debt / Equity [%] | Rule of 40 |
|---|---|---|---|---|---|---|
| $2,063,216,117 | $301,028,992 | $1,663,416,064 | 3.7 | 10.6 | 66.0 | 16.9 |
Technicals & Short Data
| 3EMA Status | Volatility [%] | Value Traded Today | Average Daily Liquidity | Short [%] | Days To Cover |
|---|---|---|---|---|---|
| Negative | 2.7 | $3,484,888 | $3,112,279 | 2.22 | 6.0 |
Dividends
| Previous Dividend | Last Dividend | Franking [%] | Ex-Div Date | Gross Yield [%] |
|---|---|---|---|---|
| None | None | None | 2024-05-29 | 0.0 |
Price Performance Snapshot
| Last Traded Price | Change [%] | 1 Week [%] | 1 Month [%] | 3 Months [%] | 6 Months [%] | 12 Months [%] |
|---|---|---|---|---|---|---|
| $2.190 | 2.3 | 1.9 | -3.9 | -17.7 | -43.7 | -43.0 |
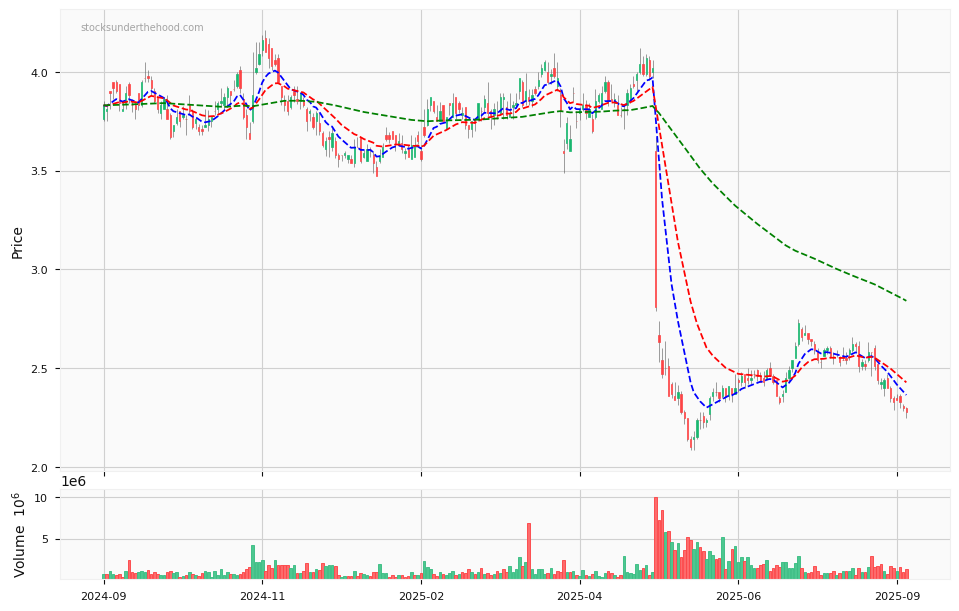
NUF Price Chart with Volume and 3EMA
NUF Short Positions

Click HERE to understand why the above moving averages have been chosen.