Nuix Limited provides investigative analytics and intelligence software, enabling organizations to process and analyze large volumes of unstructured data for cybersecurity, risk, and compliance purposes.
Ticker code: NXL
Sector: Technology | Industry: Software – Application | Website: https://www.nuix.com
Market Information
| Market Capitalisation | Enterprise Value | Shares Outstanding | Free Float [%] | Free Float Value |
|---|---|---|---|---|
| $622,462,374 | $587,507,374 | 334657188 | 63.13 | $392,948,309 |
Balance Sheet & Quality
| Equity | Cash | Debt | Return On Equity (ROE) | EBITDA 25 Margin [%] | Net Debt / Equity [%] | Rule of 40 |
|---|---|---|---|---|---|---|
| $294,163,664 | $39,974,000 | $5,019,000 | 2.3 | 21.7 | -11.9 | 22.4 |
Technicals & Short Data
| 3EMA Status | Volatility [%] | Value Traded Today | Average Daily Liquidity | Short [%] | Days To Cover |
|---|---|---|---|---|---|
| Negative | 12.4 | $1,524,482 | $2,622,650 | 3.54 | 8.4 |
Dividends
| Previous Dividend | Last Dividend | Franking [%] | Ex-Div Date | Gross Yield [%] |
|---|---|---|---|---|
| None | None | None | None | 0.0 |
Price Performance Snapshot
| Last Traded Price | Change [%] | 1 Week [%] | 1 Month [%] | 3 Months [%] | 6 Months [%] | 12 Months [%] |
|---|---|---|---|---|---|---|
| $1.860 | 0.8 | 2.8 | -12.3 | -23.5 | -19.1 | -71.1 |
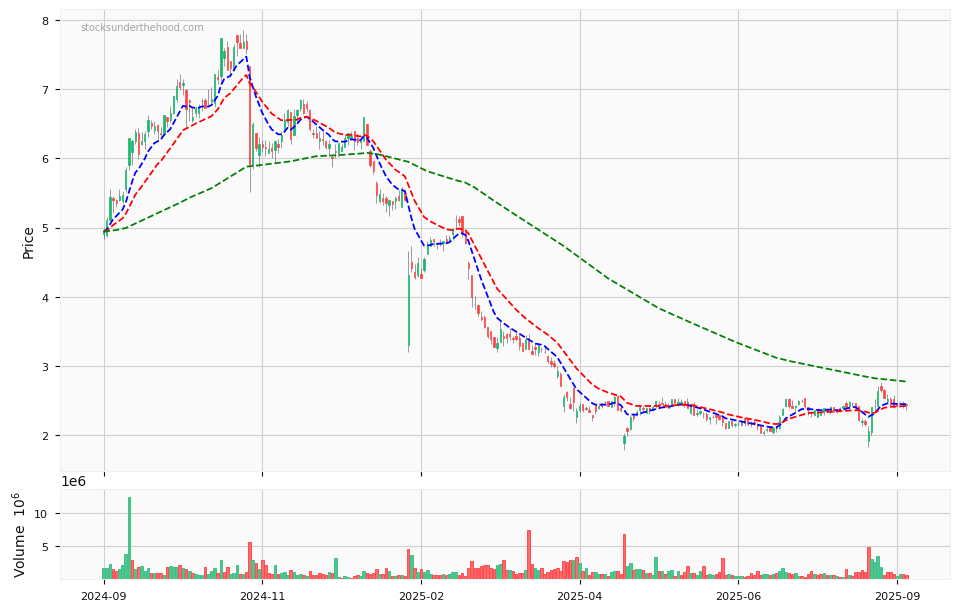
NXL Price Chart with Volume and 3EMA
NXL Short Positions

Click HERE to understand why the above moving averages have been chosen.