Objective Corporation Limited develops and supplies information and process governance software solutions, helping organizations manage content, collaboration, and business processes efficiently.
Ticker code: OCL
Sector: Technology | Industry: Software – Application | Website: https://www.objective.com
Market Information
| Market Capitalisation | Enterprise Value | Shares Outstanding | Free Float [%] | Free Float Value |
|---|---|---|---|---|
| $1,651,348,209 | $1,563,635,209 | 95674866 | 33.46 | $552,596,271 |
Balance Sheet & Quality
| Equity | Cash | Debt | Return On Equity (ROE) | EBITDA 25 Margin [%] | Net Debt / Equity [%] | Rule of 40 |
|---|---|---|---|---|---|---|
| $106,294,768 | $99,157,000 | $11,444,000 | 33.2 | 37.6 | -82.5 | 42.6 |
Technicals & Short Data
| 3EMA Status | Volatility [%] | Value Traded Today | Average Daily Liquidity | Short [%] | Days To Cover |
|---|---|---|---|---|---|
| Negative | 4.8 | $240,777 | $1,439,536 | 0.23 | 2.6 |
Dividends
| Previous Dividend | Last Dividend | Franking [%] | Ex-Div Date | Gross Yield [%] |
|---|---|---|---|---|
| $0.090 | $0.130 | None | 2025-09-05 | 0.8 |
Price Performance Snapshot
| Last Traded Price | Change [%] | 1 Week [%] | 1 Month [%] | 3 Months [%] | 6 Months [%] | 12 Months [%] |
|---|---|---|---|---|---|---|
| $17.260 | -0.4 | -1.1 | -5.4 | -16.7 | -7.3 | 0.4 |
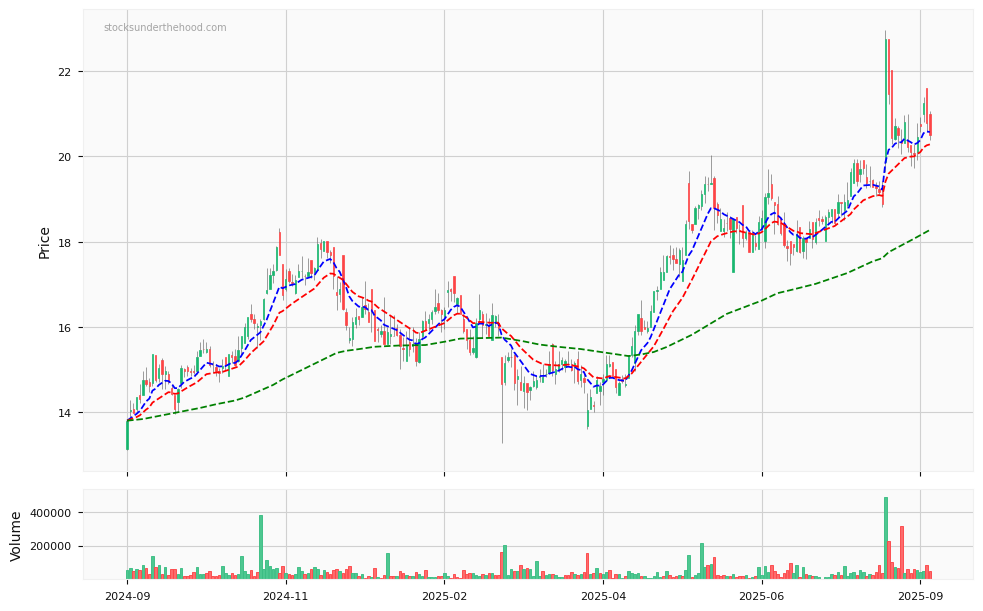
OCL Price Chart with Volume and 3EMA
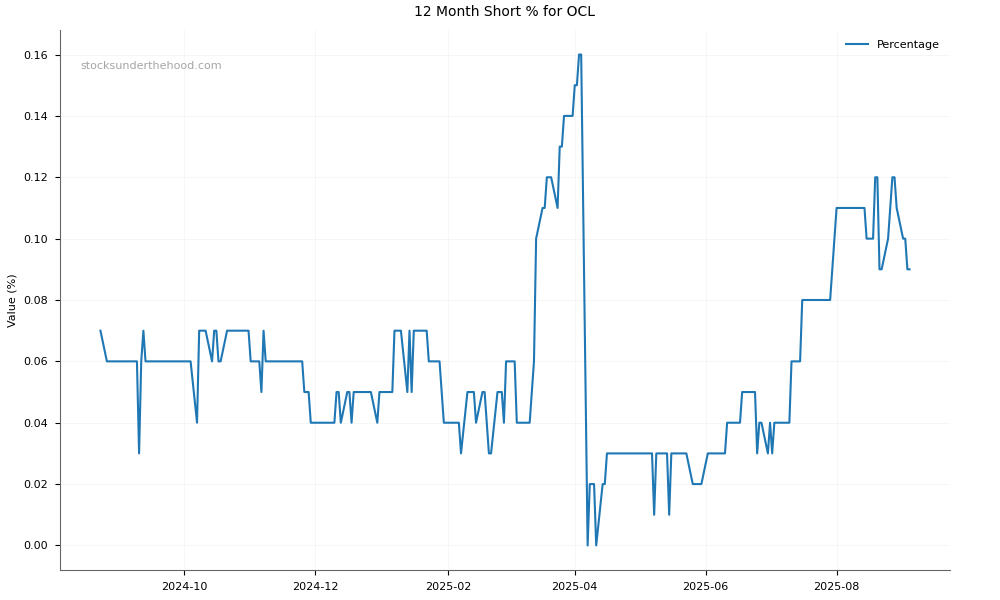
OCL Short Positions
Click HERE to understand why the above moving averages have been chosen.