Omni Bridgeway Limited is a global litigation funding company, offering dispute finance and risk management services, including funding for legal claims and enforcement of judgments.
Ticker code: OBL
Sector: Financial Services | Industry: Credit Services | Website: https://omnibridgeway.com
Market Information
| Market Capitalisation | Enterprise Value | Shares Outstanding | Free Float [%] | Free Float Value |
|---|---|---|---|---|
| $458,608,063 | $310,850,071 | 288432738 | 84.53 | $387,661,395 |
Balance Sheet & Quality
| Equity | Cash | Debt | Return On Equity (ROE) | EBITDA 25 Margin [%] | Net Debt / Equity [%] | Rule of 40 |
|---|---|---|---|---|---|---|
| $668,587,103 | $180,288,992 | $32,531,000 | 53.1 | 82.2 | -22.1 | 213.6 |
Technicals & Short Data
| 3EMA Status | Volatility [%] | Value Traded Today | Average Daily Liquidity | Short [%] | Days To Cover |
|---|---|---|---|---|---|
| Partial | 3.9 | $652,689 | $305,647 | 2.06 | 30.9 |
Dividends
| Previous Dividend | Last Dividend | Franking [%] | Ex-Div Date | Gross Yield [%] |
|---|---|---|---|---|
| None | None | None | 2020-09-01 | 0.0 |
Price Performance Snapshot
| Last Traded Price | Change [%] | 1 Week [%] | 1 Month [%] | 3 Months [%] | 6 Months [%] | 12 Months [%] |
|---|---|---|---|---|---|---|
| $1.590 | None | -0.3 | -9.4 | 8.2 | 10.0 | 67.4 |
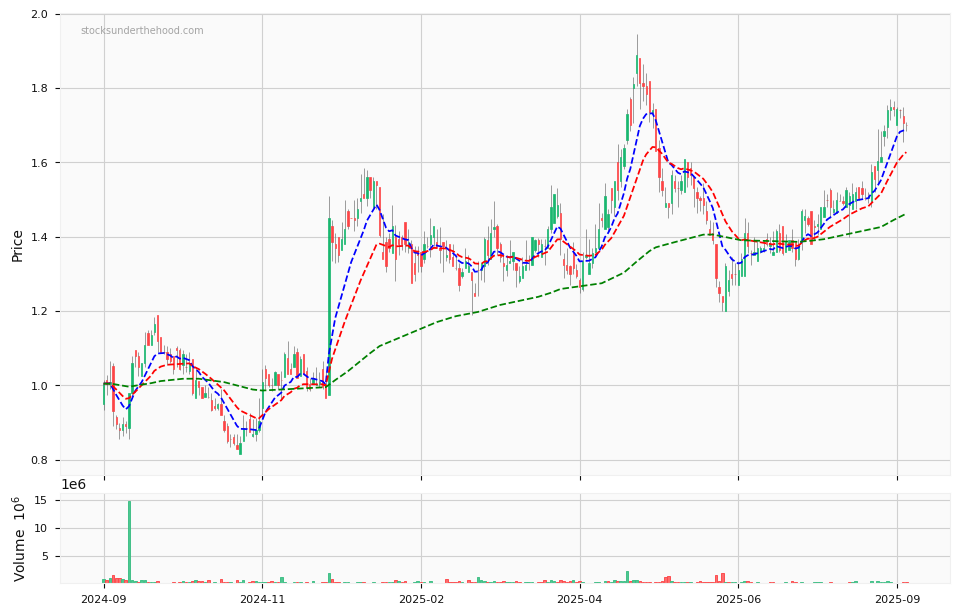
OBL Price Chart with Volume and 3EMA
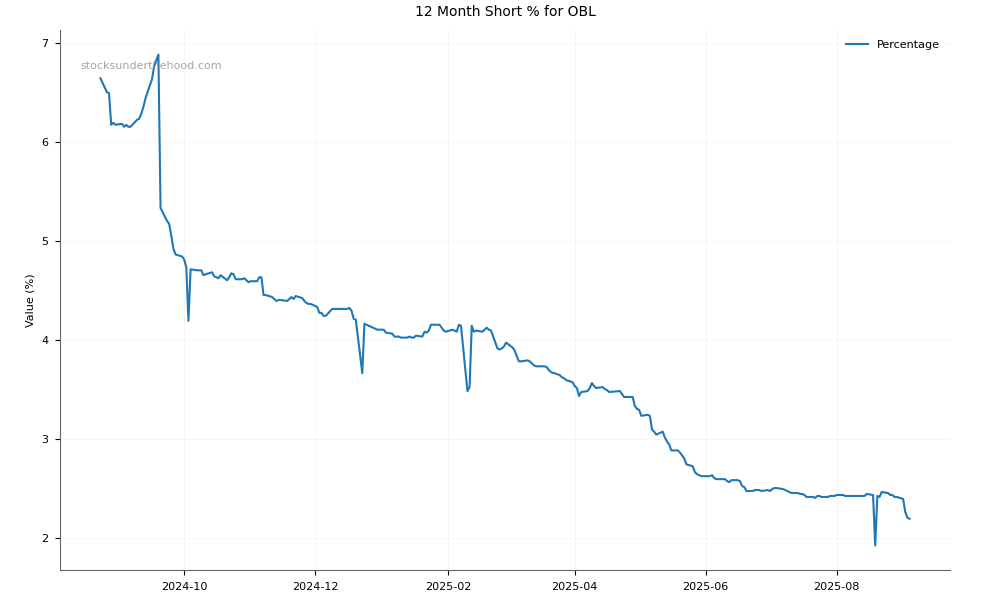
OBL Short Positions
Click HERE to understand why the above moving averages have been chosen.