Ticker code: WOR
WOR Red Flags & Risk Indicators
⚠️
⚠️ RED FLAGS: 2 identified
- Low Operating Margin
- Falling Revenues
Income Statement
| Revenue 2024 Per Share |
Revenue 2025e Per Share |
Revenue 2026e Per Share |
Revenue 24 to 25e [%] |
Revenue 25e to 26e [%] |
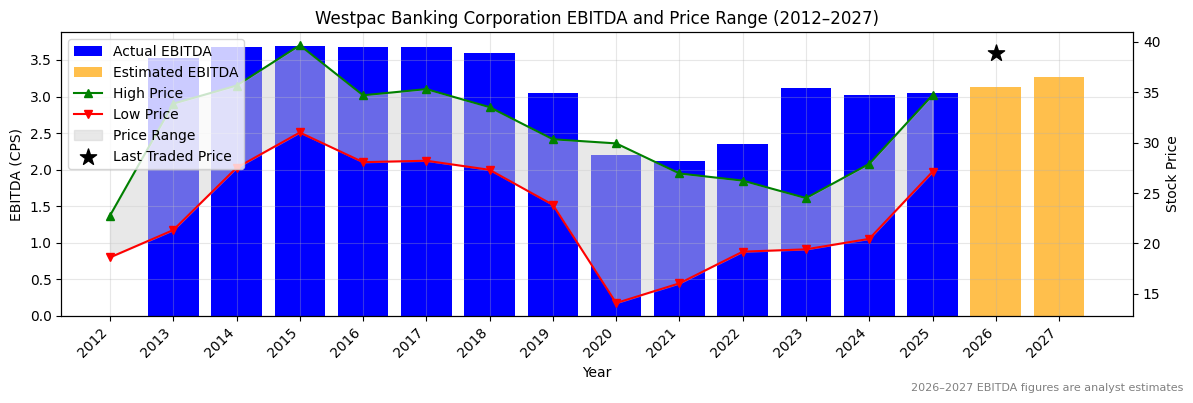
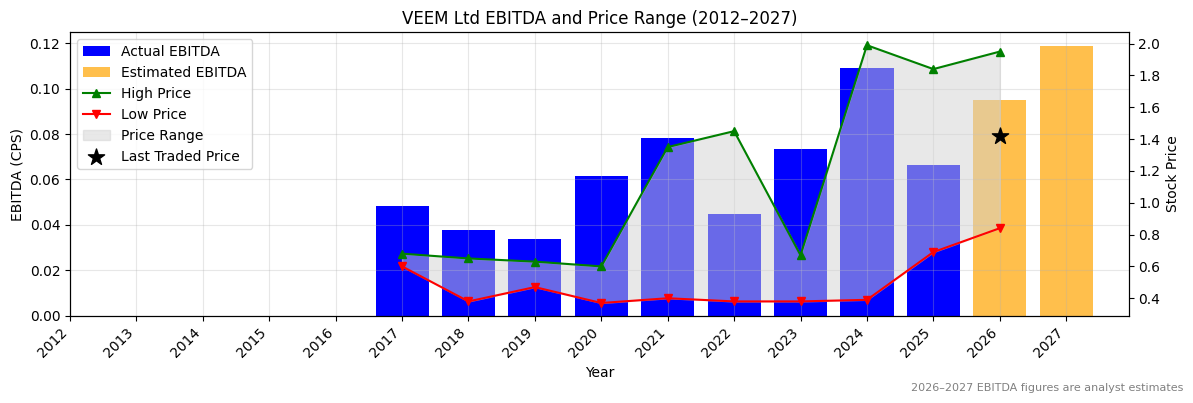
EBITDA 2024 Per Share |
EBITDA 2025e Per Share |
EBITDA 2026e Per Share |
EBITDA 24 to 25e [%] |
EBITDA 25e to 26e [%] |
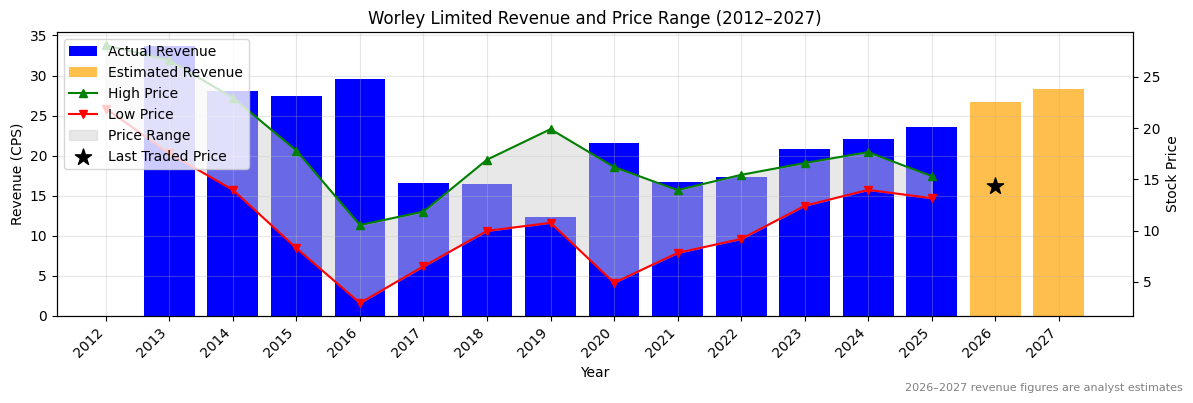
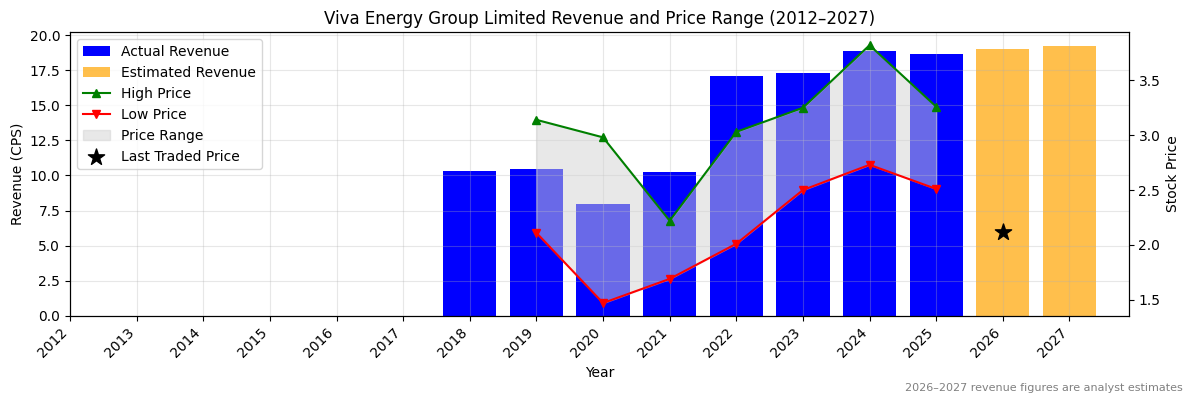
| 22.01946 |
23.58814 |
26.70273 |
7.1 |
13.2 |
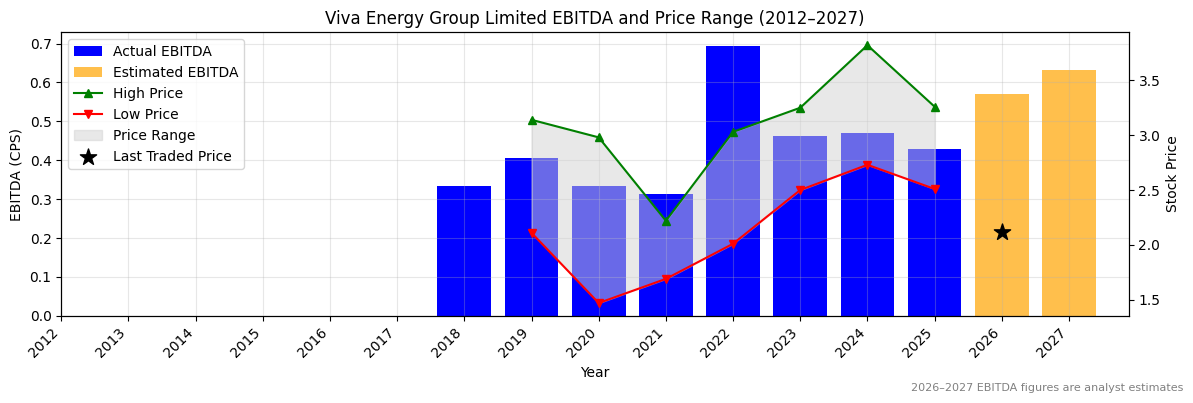
1.7743 |
1.93493 |
2.23499 |
9.1 |
15.5 |
WOR Revenue Per Share (2012–2027)
✅
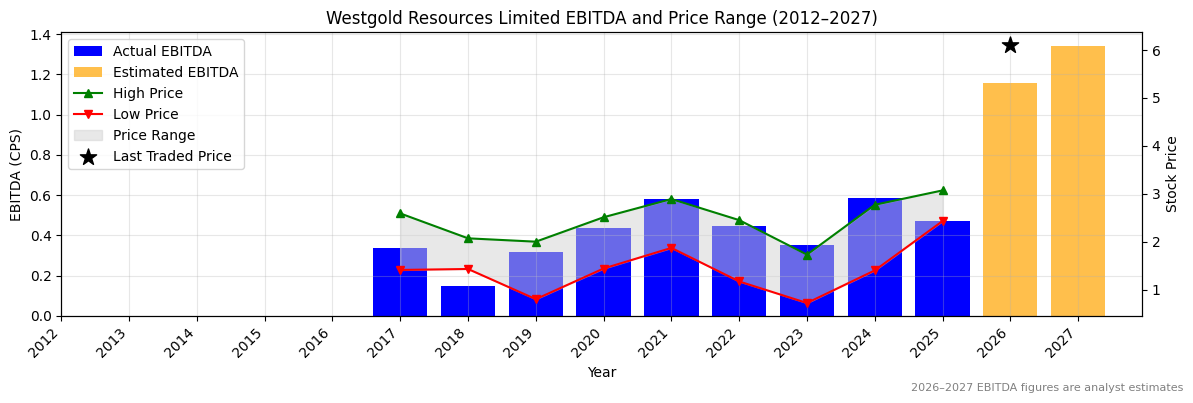
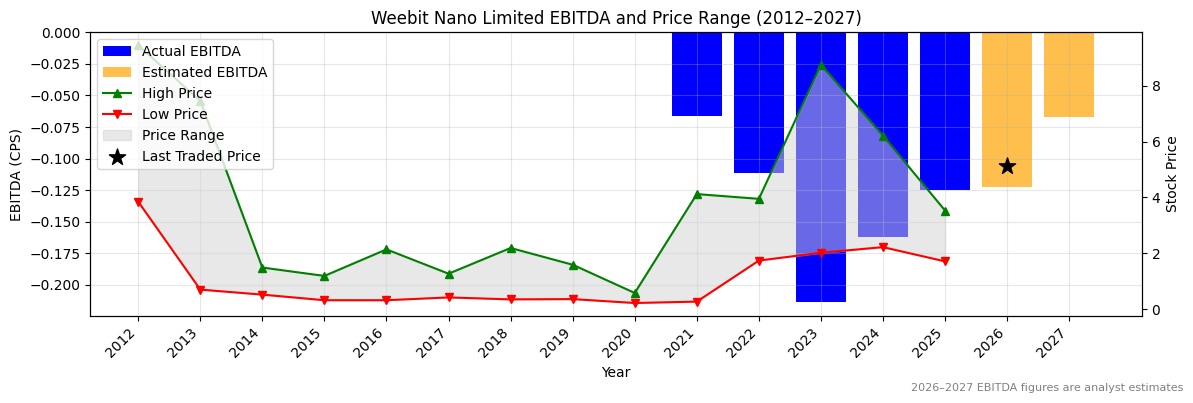
WOR Earnings before Interest, Tax, Depreciation and Amortisation (EBITDA) Per Share (2012–2027)
✅
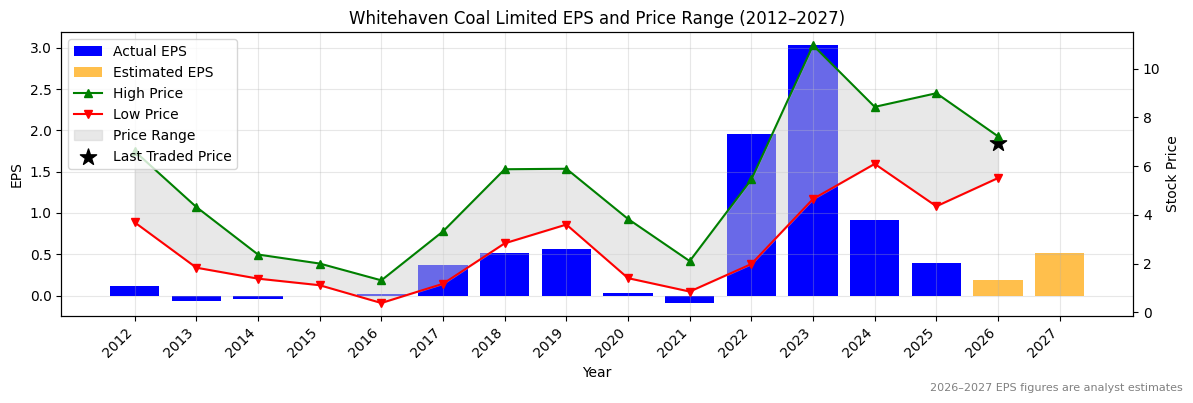
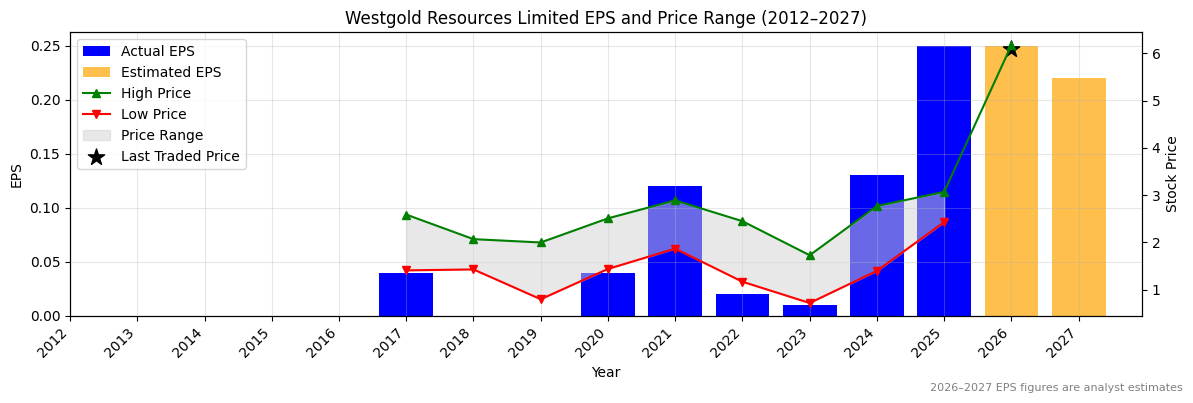
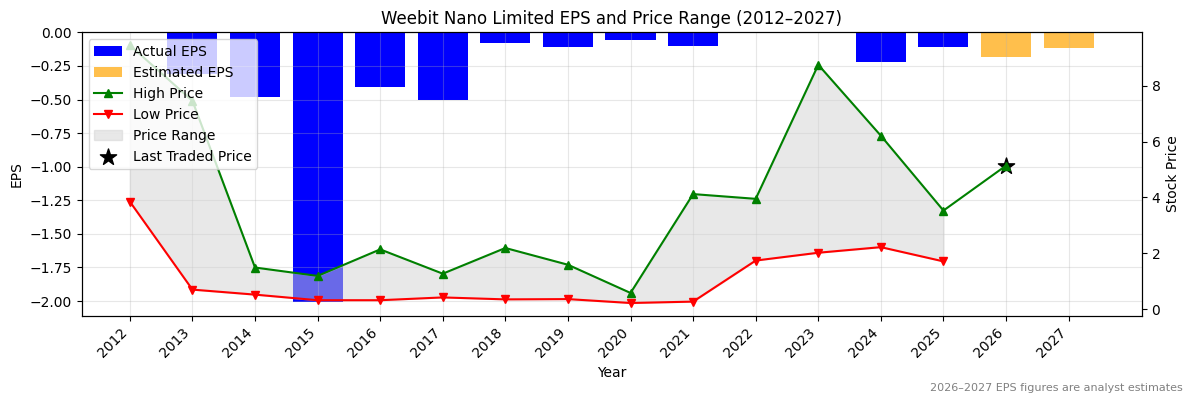
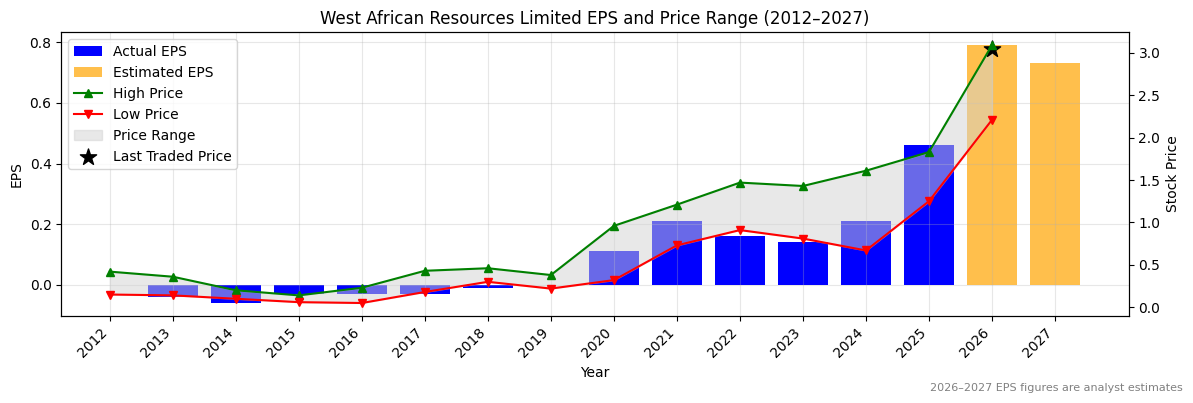
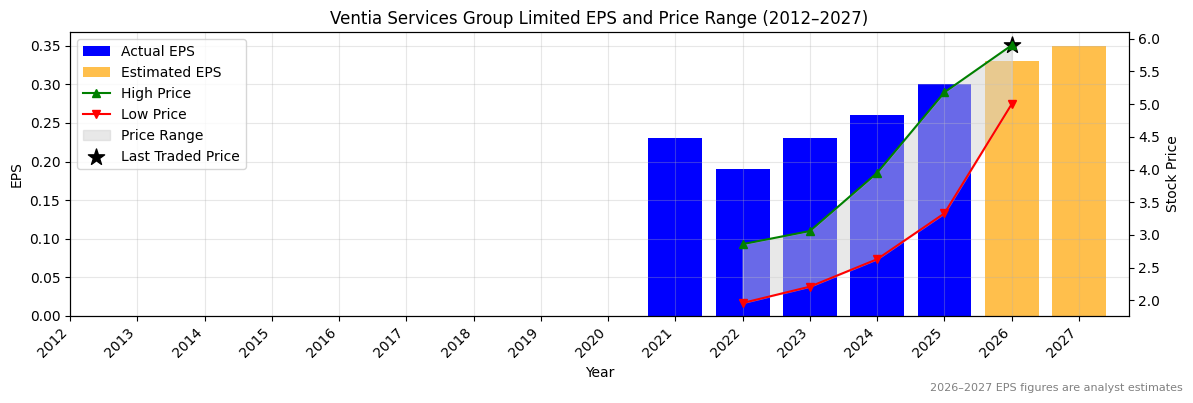
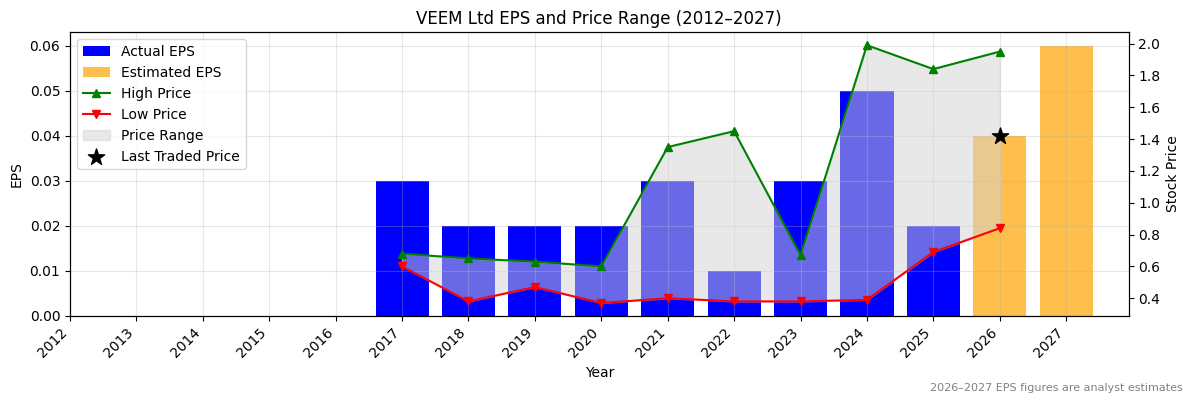
WOR Normalised Earnings Per Share (EPS) (2012–2027)
✅✅
Valuation
| Price To Sales |
Price To Book |
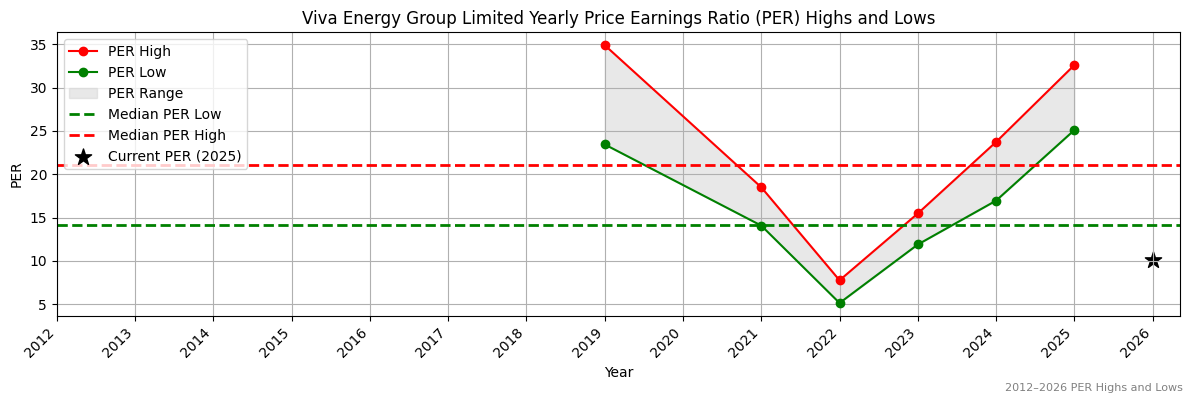
PER 2023 |
PER 2024 |
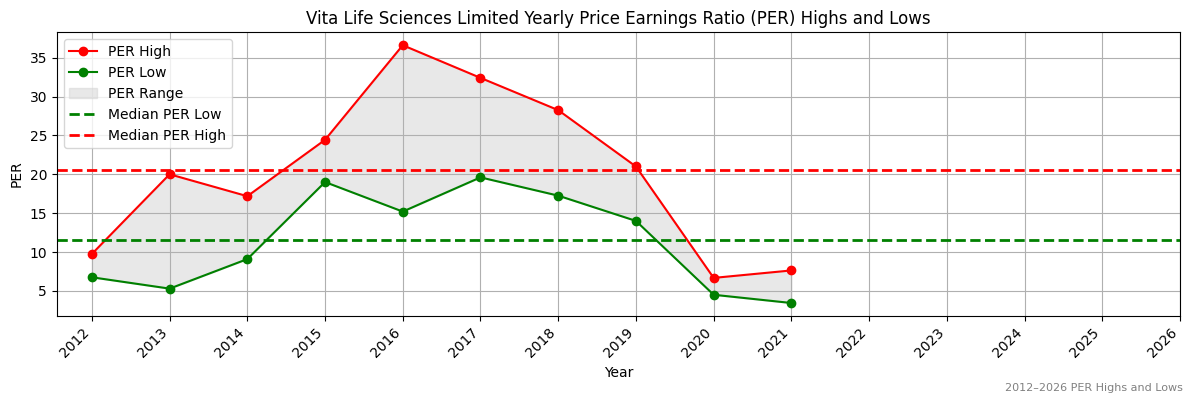
13Y Median PER Low |
PER 2025e |
13Y Median PER High |
PER 2026e |
Last Updated |
| 0.7 |
1.3 |
27.0 |
21.7 |
15.6 |
17.2 |
24.2 |
14.0 |
5/3/25 |
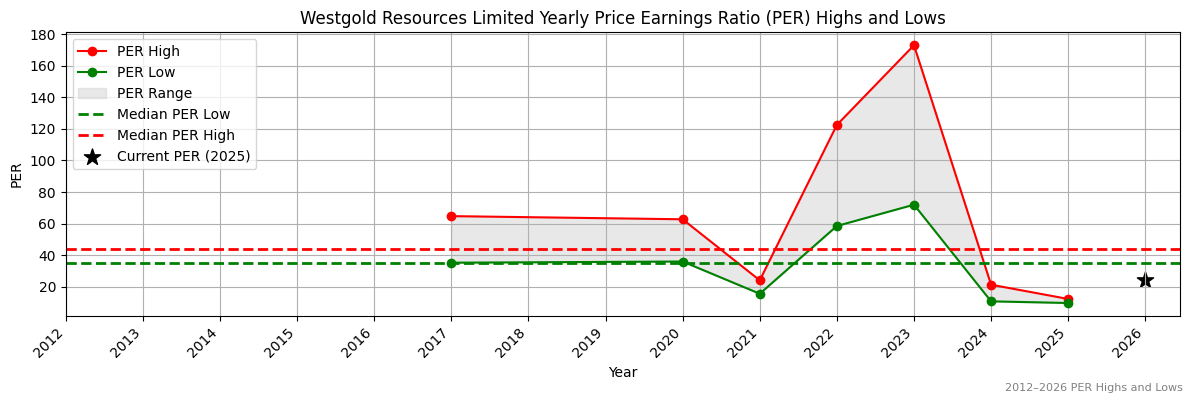
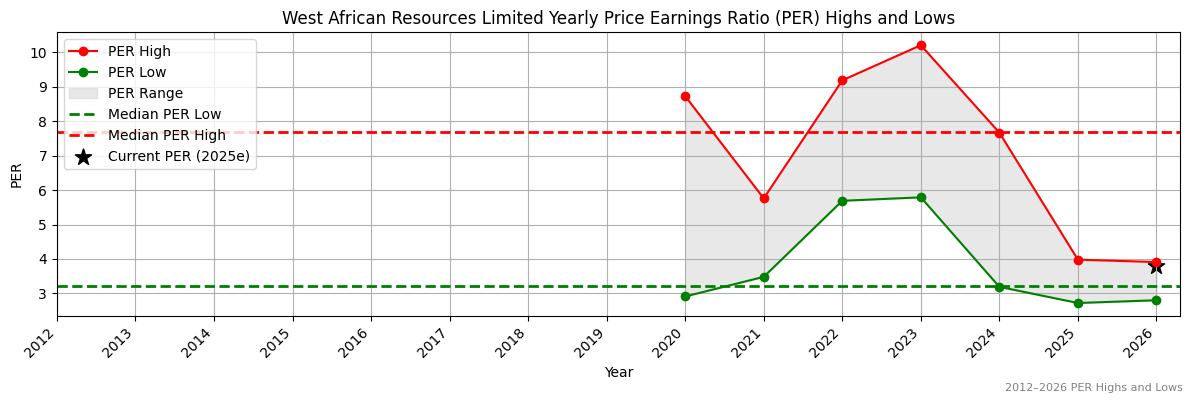
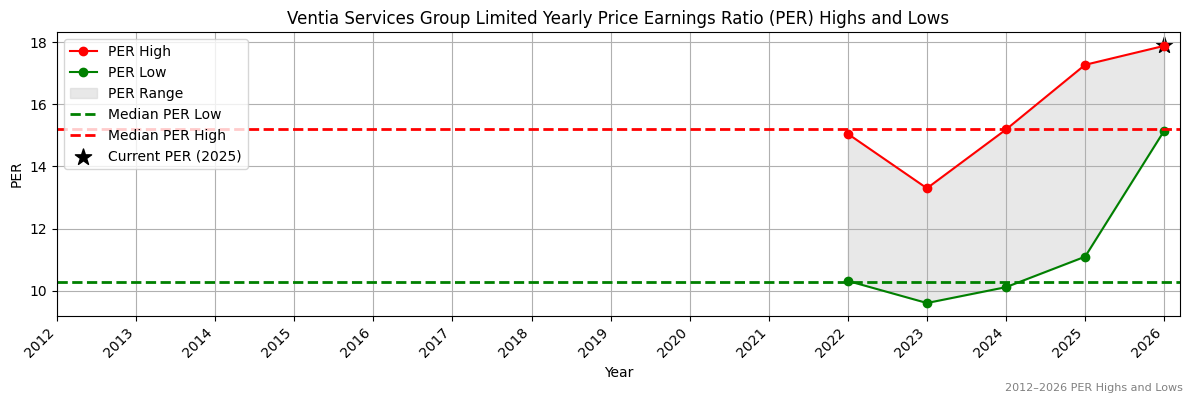
WOR Yearly Price Earnings Ratio (PER) Highs and Lows
✅
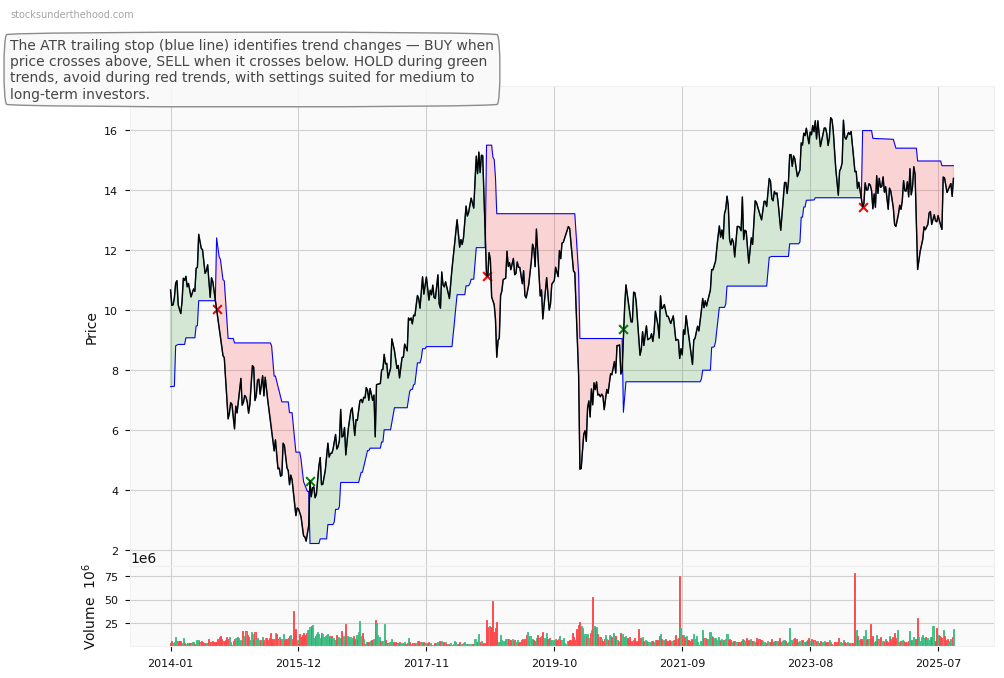
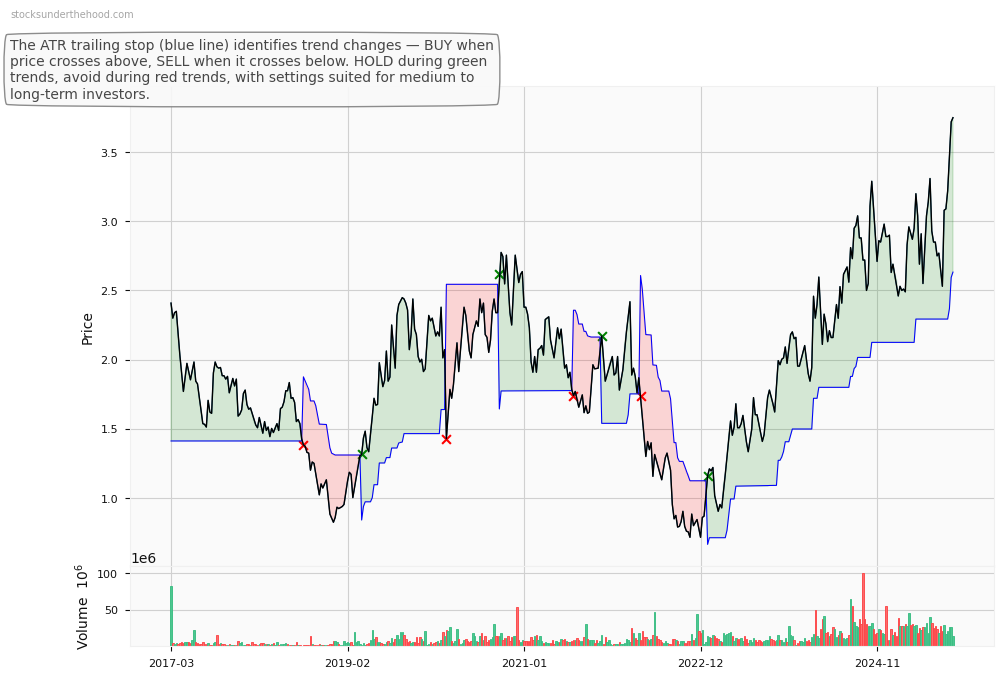
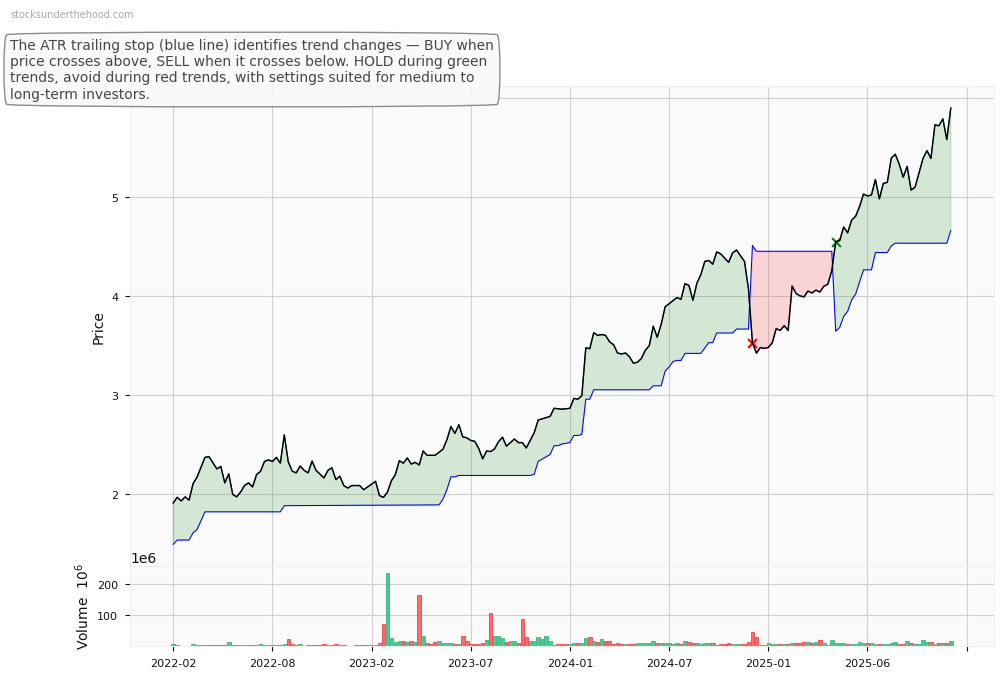
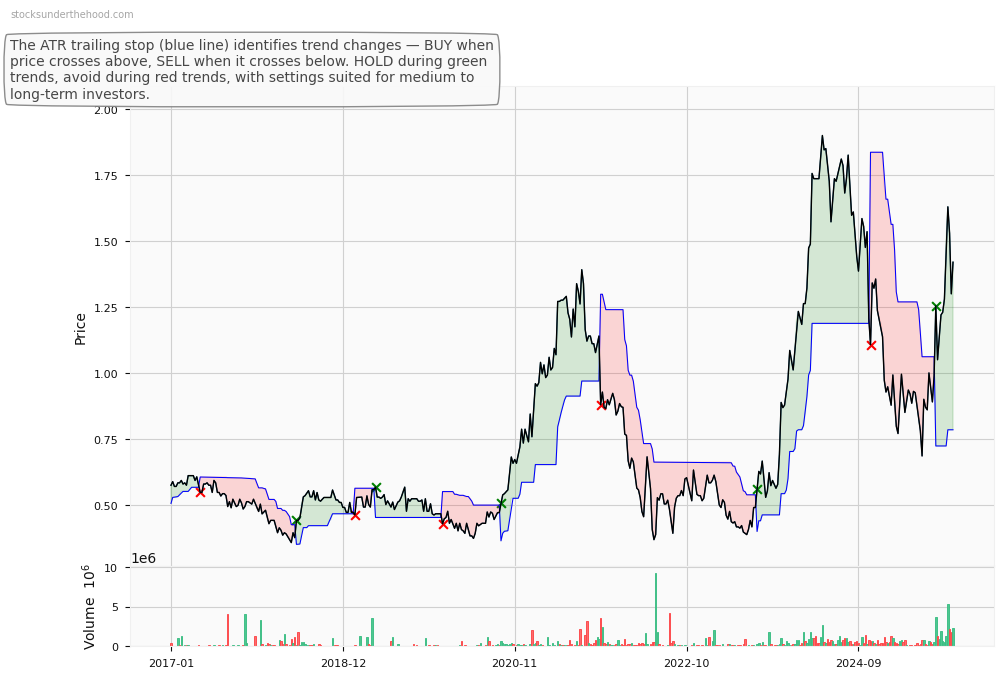
WOR Weekly Price Chart with Average True Range (ATR) Trailing Stop (10-Year View)
Ticker code: WHC
WHC Red Flags & Risk Indicators
⚠️
⚠️ RED FLAGS: 1 identified
Income Statement
| Revenue 2024 Per Share |
Revenue 2025e Per Share |
Revenue 2026e Per Share |
Revenue 24 to 25e [%] |
Revenue 25e to 26e [%] |
EBITDA 2024 Per Share |
EBITDA 2025e Per Share |
EBITDA 2026e Per Share |
EBITDA 24 to 25e [%] |
EBITDA 25e to 26e [%] |
| 4.57805 |
None |
None |
None |
None |
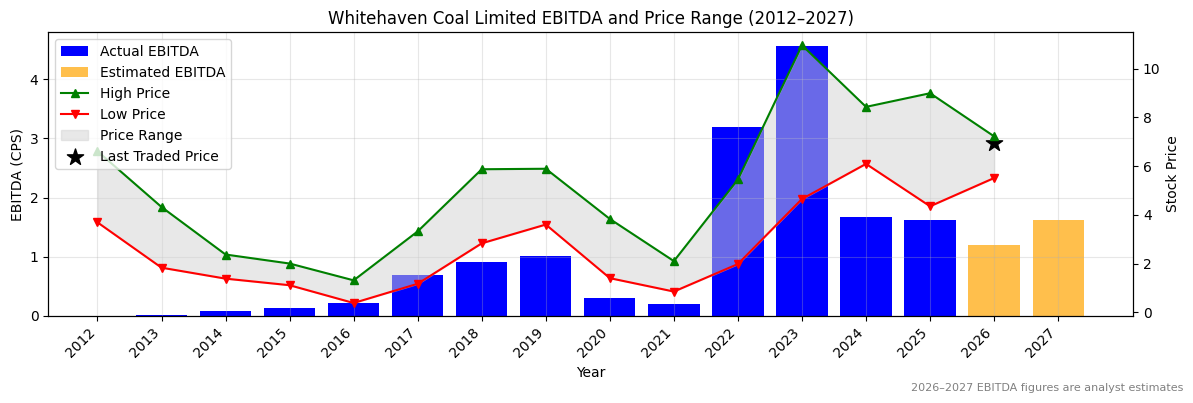
1.77233 |
3.17775 |
None |
79.3 |
None |
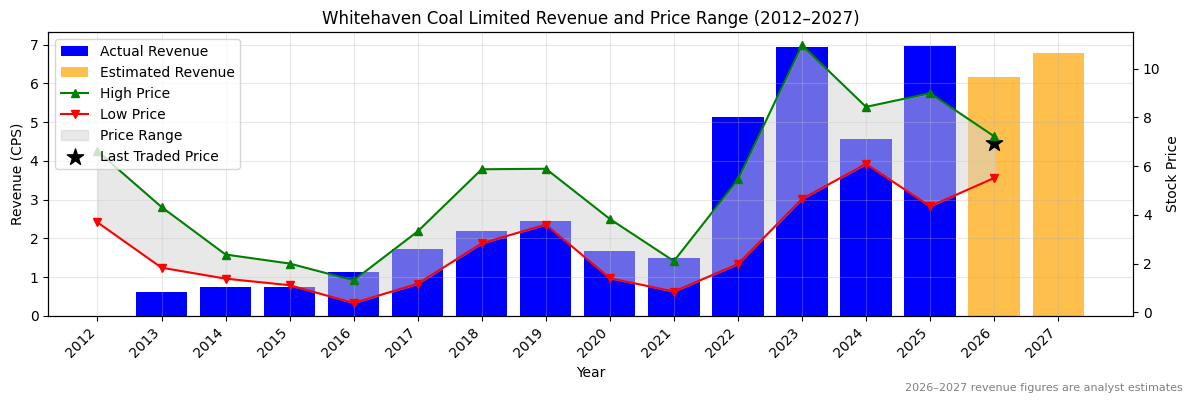
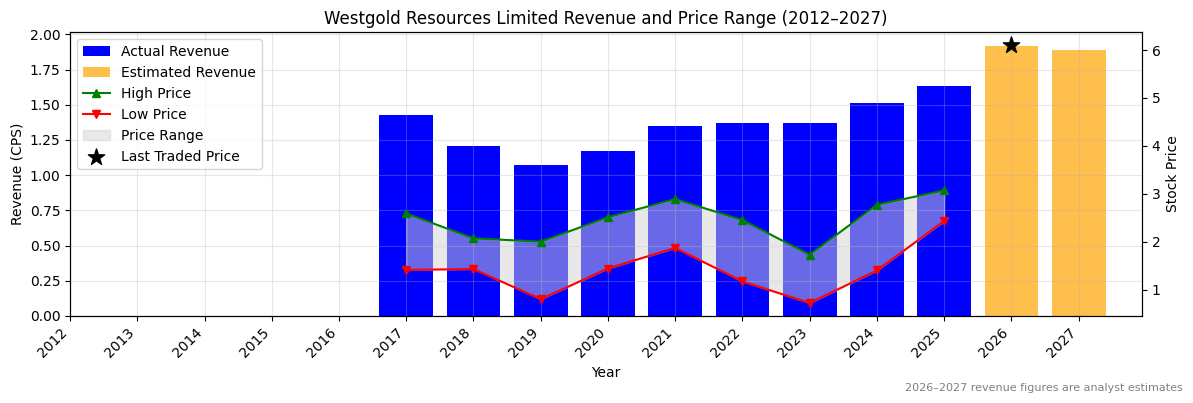
WHC Revenue Per Share (2012–2027)
WHC Earnings before Interest, Tax, Depreciation and Amortisation (EBITDA) Per Share (2012–2027)
✅✅
WHC Normalised Earnings Per Share (EPS) (2012–2027)
❌
Valuation
| Price To Sales |
Price To Book |
PER 2023 |
PER 2024 |
13Y Median PER Low |
PER 2025e |
13Y Median PER High |
PER 2026e |
Last Updated |
| 1.0 |
1.1 |
2.4 |
7.9 |
6.6 |
15.7 |
10.9 |
8.6 |
21/4/24 |
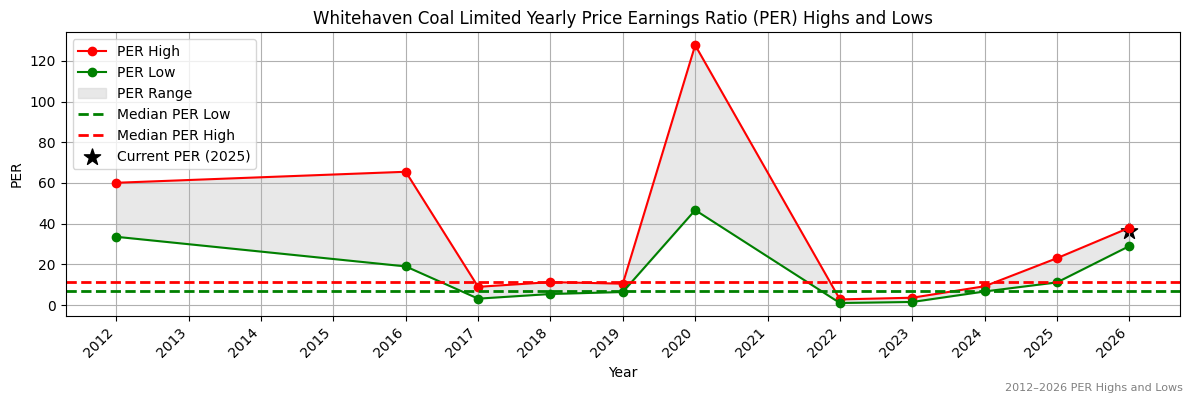
WHC Yearly Price Earnings Ratio (PER) Highs and Lows
❌
WHC Weekly Price Chart with Average True Range (ATR) Trailing Stop (10-Year View)
Ticker code: WGX
WGX Red Flags & Risk Indicators
⚠️
⚠️ RED FLAGS: 1 identified
Income Statement
| Revenue 2024 Per Share |
Revenue 2025e Per Share |
Revenue 2026e Per Share |
Revenue 24 to 25e [%] |
Revenue 25e to 26e [%] |
EBITDA 2024 Per Share |
EBITDA 2025e Per Share |
EBITDA 2026e Per Share |
EBITDA 24 to 25e [%] |
EBITDA 25e to 26e [%] |
| 1.51275 |
1.63421 |
1.91878 |
8.0 |
17.4 |
0.58823 |
0.47327 |
1.15834 |
-19.5 |
144.8 |
WGX Revenue Per Share (2012–2027)
✅
WGX Earnings before Interest, Tax, Depreciation and Amortisation (EBITDA) Per Share (2012–2027)
❌
WGX Normalised Earnings Per Share (EPS) (2012–2027)
✅✅
Valuation
| Price To Sales |
Price To Book |
PER 2023 |
PER 2024 |
13Y Median PER Low |
PER 2025e |
13Y Median PER High |
PER 2026e |
Last Updated |
| 3.7 |
2.5 |
532.0 |
40.9 |
35.3 |
21.3 |
43.4 |
21.3 |
4/10/25 |
WGX Yearly Price Earnings Ratio (PER) Highs and Lows
✅✅
WGX Weekly Price Chart with Average True Range (ATR) Trailing Stop (10-Year View)
Ticker code: WES
WES Red Flags & Risk Indicators
⚠️
⚠️ RED FLAGS: 2 identified
- More Net Debt Than Equity
- High Relative Valuation
Income Statement
| Revenue 2024 Per Share |
Revenue 2025e Per Share |
Revenue 2026e Per Share |
Revenue 24 to 25e [%] |
Revenue 25e to 26e [%] |
EBITDA 2024 Per Share |
EBITDA 2025e Per Share |
EBITDA 2026e Per Share |
EBITDA 24 to 25e [%] |
EBITDA 25e to 26e [%] |
| 38.94056 |
40.34171 |
41.52252 |
3.6 |
2.9 |
5.10143 |
5.30411 |
5.53923 |
4.0 |
4.4 |
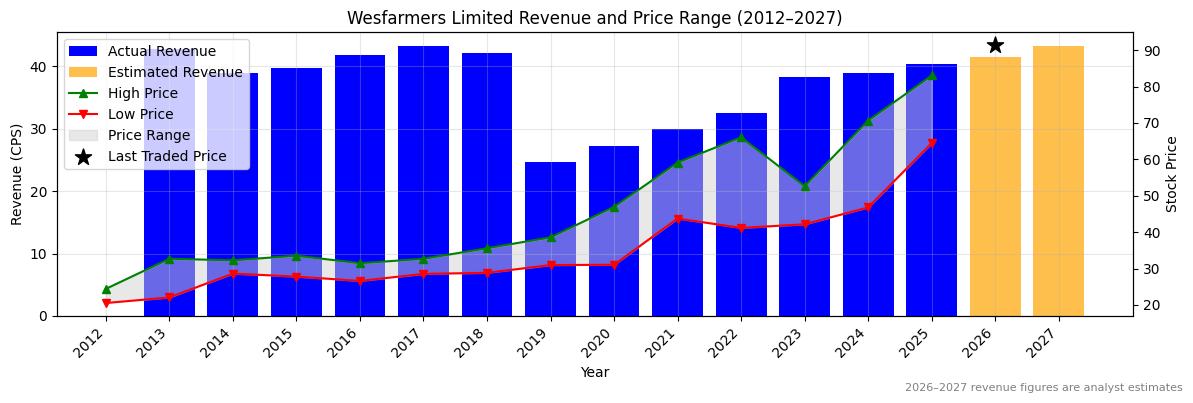
WES Revenue Per Share (2012–2027)
✅
WES Earnings before Interest, Tax, Depreciation and Amortisation (EBITDA) Per Share (2012–2027)
✅
WES Normalised Earnings Per Share (EPS) (2012–2027)
✅
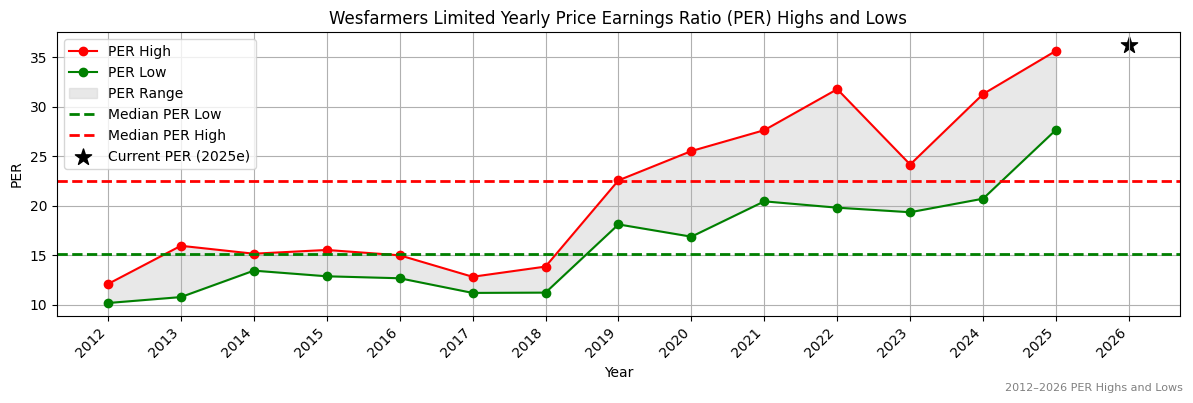
Valuation
| Price To Sales |
Price To Book |
PER 2023 |
PER 2024 |
13Y Median PER Low |
PER 2025e |
13Y Median PER High |
PER 2026e |
Last Updated |
| 2.1 |
10.4 |
38.5 |
37.2 |
15.1 |
36.1 |
22.5 |
33.3 |
11/10/25 |
WES Yearly Price Earnings Ratio (PER) Highs and Lows
❌
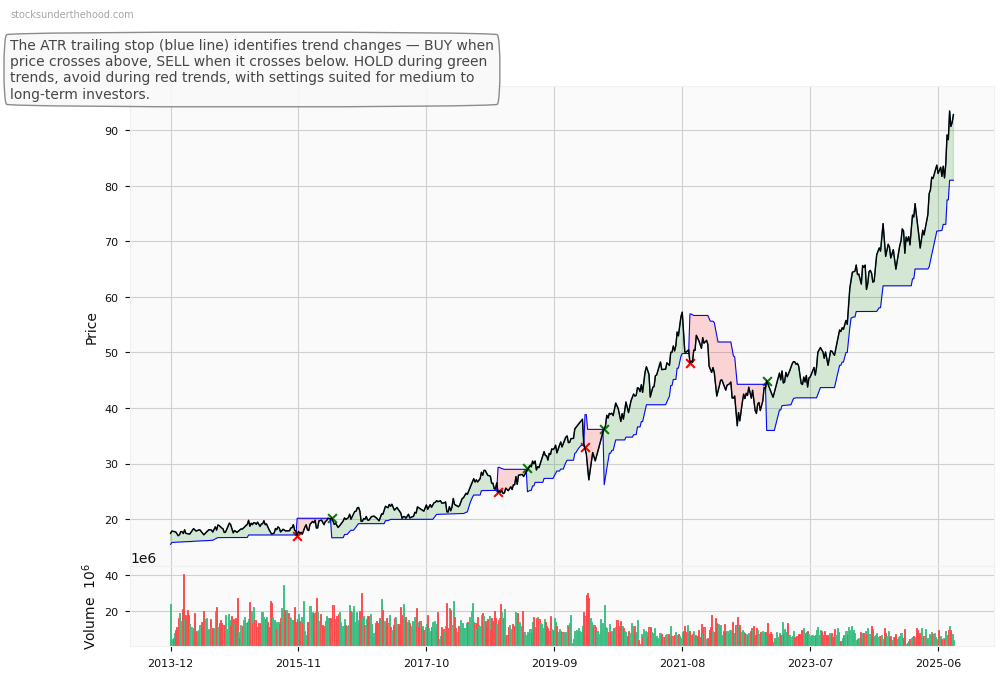
WES Weekly Price Chart with Average True Range (ATR) Trailing Stop (10-Year View)
Ticker code: WEB
WEB Red Flags & Risk Indicators
⚠️
⚠️ RED FLAGS: 1 identified
Income Statement
| Revenue 2024 Per Share |
Revenue 2025e Per Share |
Revenue 2026e Per Share |
Revenue 24 to 25e [%] |
Revenue 25e to 26e [%] |
EBITDA 2024 Per Share |
EBITDA 2025e Per Share |
EBITDA 2026e Per Share |
EBITDA 24 to 25e [%] |
EBITDA 25e to 26e [%] |
| 1.22097 |
None |
None |
None |
None |
0.48709 |
0.63453 |
0.73421 |
30.3 |
15.7 |
WEB Revenue Per Share (2012–2027)
WEB Earnings before Interest, Tax, Depreciation and Amortisation (EBITDA) Per Share (2012–2027)
✅✅
WEB Normalised Earnings Per Share (EPS) (2012–2027)
❌
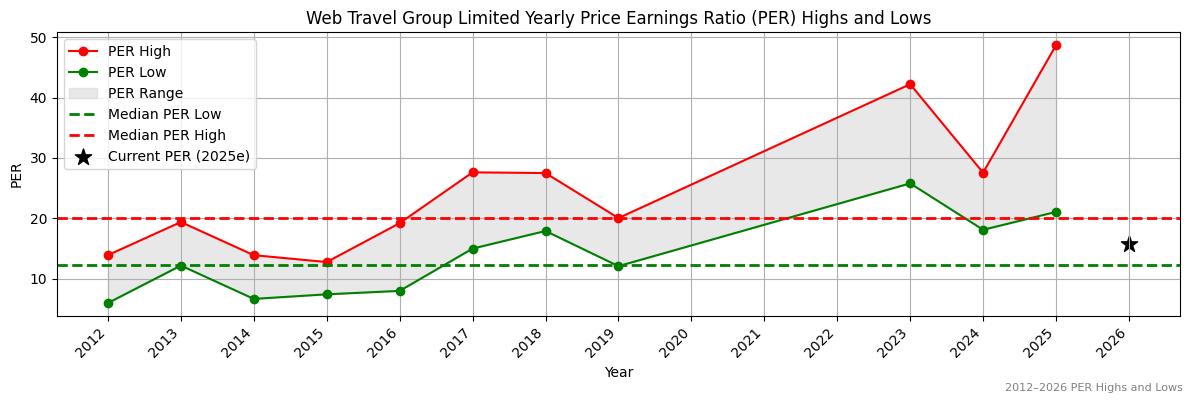
Valuation
| Price To Sales |
Price To Book |
PER 2023 |
PER 2024 |
13Y Median PER Low |
PER 2025e |
13Y Median PER High |
PER 2026e |
Last Updated |
| 4.6 |
2.6 |
23.2 |
12.7 |
12.2 |
22.0 |
20.0 |
15.5 |
30/7/24 |
WEB Yearly Price Earnings Ratio (PER) Highs and Lows
❌
WEB Weekly Price Chart with Average True Range (ATR) Trailing Stop (10-Year View)
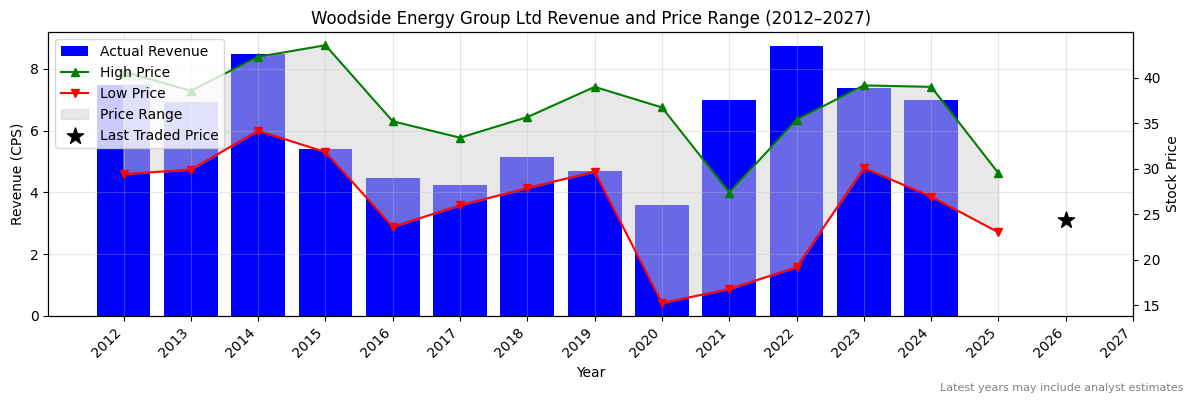
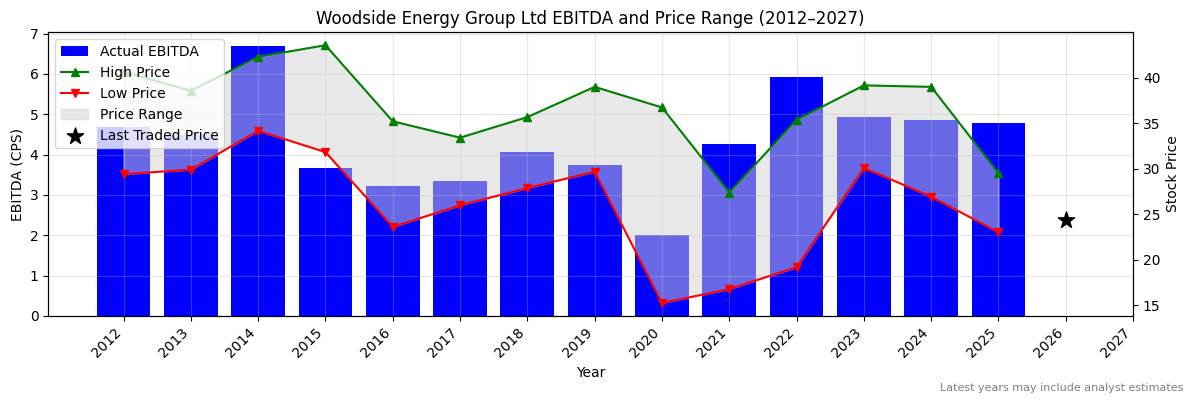
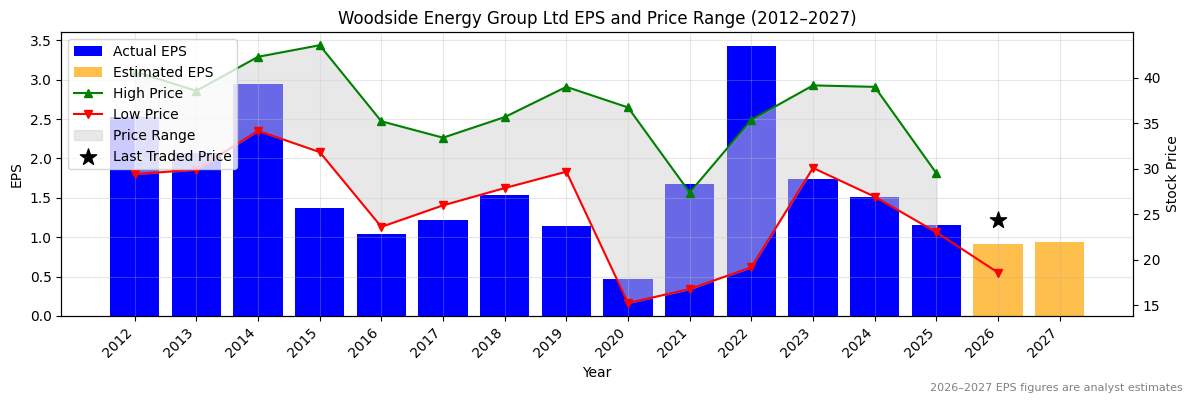
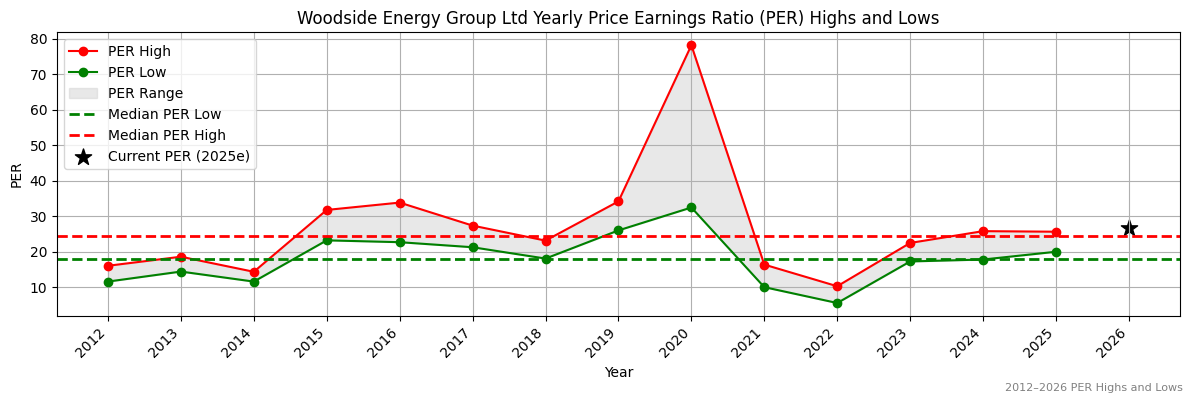
Ticker code: WDS
WDS Red Flags & Risk Indicators
⚠️
⚠️ RED FLAGS: 2 identified
- Falling Earnings
- High Relative Valuation
Income Statement
| Revenue 2024 Per Share |
Revenue 2025e Per Share |
Revenue 2026e Per Share |
Revenue 24 to 25e [%] |
Revenue 25e to 26e [%] |
EBITDA 2024 Per Share |
EBITDA 2025e Per Share |
EBITDA 2026e Per Share |
EBITDA 24 to 25e [%] |
EBITDA 25e to 26e [%] |
| 6.98256 |
None |
None |
None |
None |
4.86422 |
4.79405 |
None |
-1.4 |
None |
WDS Revenue Per Share (2012–2027)
WDS Earnings before Interest, Tax, Depreciation and Amortisation (EBITDA) Per Share (2012–2027)
❌
WDS Normalised Earnings Per Share (EPS) (2012–2027)
❌
Valuation
| Price To Sales |
Price To Book |
PER 2023 |
PER 2024 |
13Y Median PER Low |
PER 2025e |
13Y Median PER High |
PER 2026e |
Last Updated |
| 3.4 |
1.3 |
14.3 |
16.4 |
18.1 |
21.6 |
24.4 |
27.3 |
9/4/24 |
WDS Yearly Price Earnings Ratio (PER) Highs and Lows
✅
WDS Weekly Price Chart with Average True Range (ATR) Trailing Stop (10-Year View)
Ticker code: WBT
WBT Red Flags & Risk Indicators
❌
⚠️ RED FLAGS: 4 identified
- Negative Operating Cash Flow
- Large Share Issuance
- Low Operating Margin
- High Price to Book vs ROE
Income Statement
| Revenue 2024 Per Share |
Revenue 2025e Per Share |
Revenue 2026e Per Share |
Revenue 24 to 25e [%] |
Revenue 25e to 26e [%] |
EBITDA 2024 Per Share |
EBITDA 2025e Per Share |
EBITDA 2026e Per Share |
EBITDA 24 to 25e [%] |
EBITDA 25e to 26e [%] |
| 0.0036 |
0.0144 |
0.05829 |
299.9 |
304.9 |
-0.16226 |
-0.12465 |
-0.1228 |
23.2 |
1.5 |
WBT Revenue Per Share (2012–2027)
✅✅
WBT Earnings before Interest, Tax, Depreciation and Amortisation (EBITDA) Per Share (2012–2027)
✅✅
WBT Normalised Earnings Per Share (EPS) (2012–2027)
✅✅
Valuation
| Price To Sales |
Price To Book |
PER 2023 |
PER 2024 |
13Y Median PER Low |
PER 2025e |
13Y Median PER High |
PER 2026e |
Last Updated |
| 257.6 |
12.6 |
None |
-24.7 |
None |
-49.5 |
None |
-30.2 |
10/10/25 |
WBT Yearly Price Earnings Ratio (PER) Highs and Lows
WBT Weekly Price Chart with Average True Range (ATR) Trailing Stop (10-Year View)
Ticker code: WBC
WBC Red Flags & Risk Indicators
⚠️
⚠️ RED FLAGS: 2 identified
- Falling Earnings
- High Relative Valuation
Income Statement
| Revenue 2024 Per Share |
Revenue 2025e Per Share |
Revenue 2026e Per Share |
Revenue 24 to 25e [%] |
Revenue 25e to 26e [%] |
EBITDA 2024 Per Share |
EBITDA 2025e Per Share |
EBITDA 2026e Per Share |
EBITDA 24 to 25e [%] |
EBITDA 25e to 26e [%] |
| 6.28886 |
None |
None |
None |
None |
3.01953 |
3.0548 |
3.12662 |
1.2 |
2.4 |
WBC Revenue Per Share (2012–2027)
WBC Earnings before Interest, Tax, Depreciation and Amortisation (EBITDA) Per Share (2012–2027)
✅
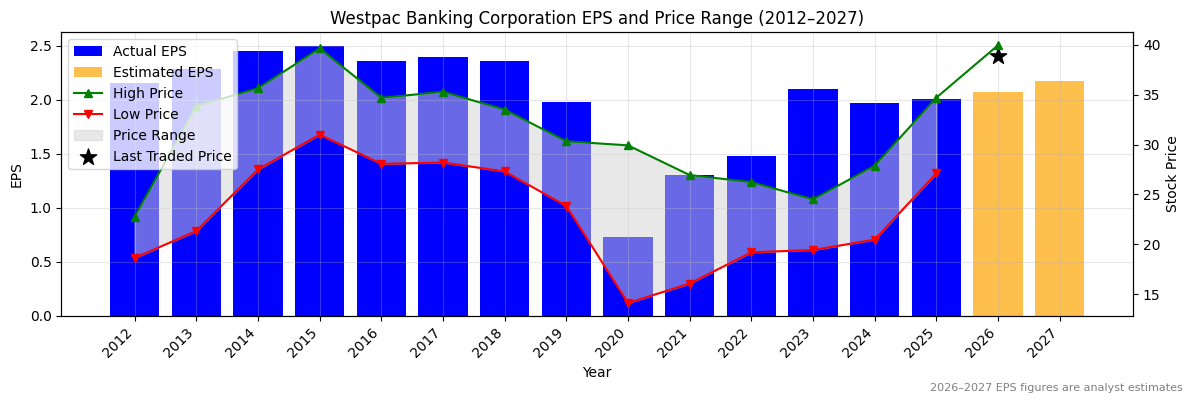
WBC Normalised Earnings Per Share (EPS) (2012–2027)
✅
Valuation
| Price To Sales |
Price To Book |
PER 2023 |
PER 2024 |
13Y Median PER Low |
PER 2025e |
13Y Median PER High |
PER 2026e |
Last Updated |
| 6.1 |
1.8 |
18.4 |
19.7 |
11.8 |
19.3 |
14.8 |
18.7 |
23/7/25 |
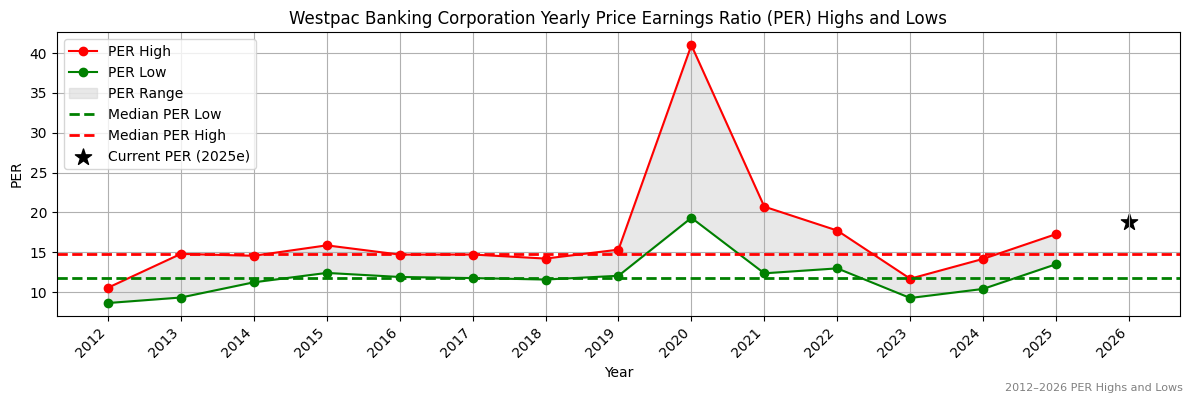
WBC Yearly Price Earnings Ratio (PER) Highs and Lows
❌
WBC Weekly Price Chart with Average True Range (ATR) Trailing Stop (10-Year View)
Ticker code: WAF
WAF Red Flags & Risk Indicators
✅
⚠️ RED FLAGS: 0 identified
No red flags detected.
Income Statement
| Revenue 2024 Per Share |
Revenue 2025e Per Share |
Revenue 2026e Per Share |
Revenue 24 to 25e [%] |
Revenue 25e to 26e [%] |
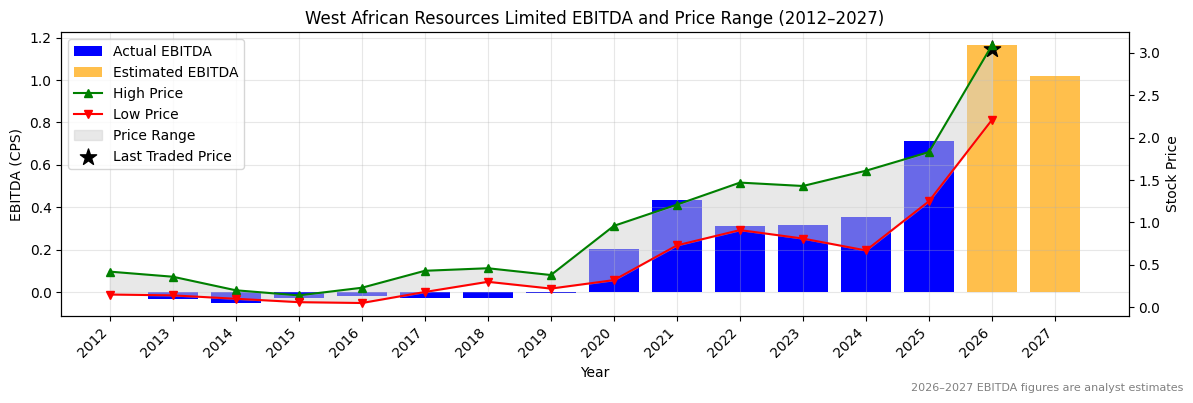
EBITDA 2024 Per Share |
EBITDA 2025e Per Share |
EBITDA 2026e Per Share |
EBITDA 24 to 25e [%] |
EBITDA 25e to 26e [%] |
| 0.64045 |
1.19168 |
1.94194 |
86.1 |
63.0 |
0.35539 |
0.71441 |
1.16458 |
101.0 |
63.0 |
WAF Revenue Per Share (2012–2027)
✅✅
WAF Earnings before Interest, Tax, Depreciation and Amortisation (EBITDA) Per Share (2012–2027)
✅✅
WAF Normalised Earnings Per Share (EPS) (2012–2027)
✅✅
Valuation
| Price To Sales |
Price To Book |
PER 2023 |
PER 2024 |
13Y Median PER Low |
PER 2025e |
13Y Median PER High |
PER 2026e |
Last Updated |
| 4.0 |
2.4 |
None |
None |
3.2 |
None |
7.7 |
None |
28/9/25 |
WAF Yearly Price Earnings Ratio (PER) Highs and Lows
WAF Weekly Price Chart with Average True Range (ATR) Trailing Stop (10-Year View)
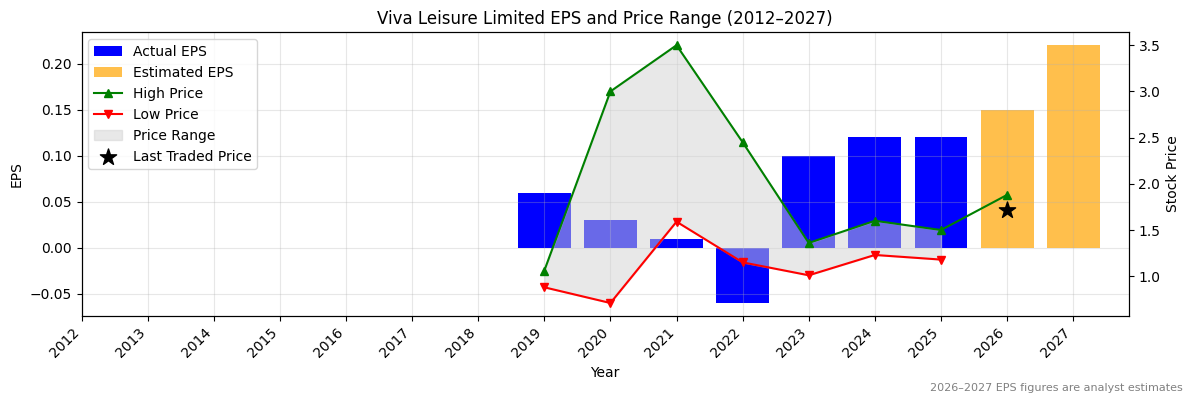
Ticker code: VVA
VVA Red Flags & Risk Indicators
⚠️
⚠️ RED FLAGS: 1 identified
- More Net Debt Than Equity
Income Statement
| Revenue 2024 Per Share |
Revenue 2025e Per Share |
Revenue 2026e Per Share |
Revenue 24 to 25e [%] |
Revenue 25e to 26e [%] |
EBITDA 2024 Per Share |
EBITDA 2025e Per Share |
EBITDA 2026e Per Share |
EBITDA 24 to 25e [%] |
EBITDA 25e to 26e [%] |
| 1.61017 |
2.04149 |
2.45184 |
26.8 |
20.1 |
0.3505 |
0.45446 |
0.56522 |
29.7 |
24.4 |
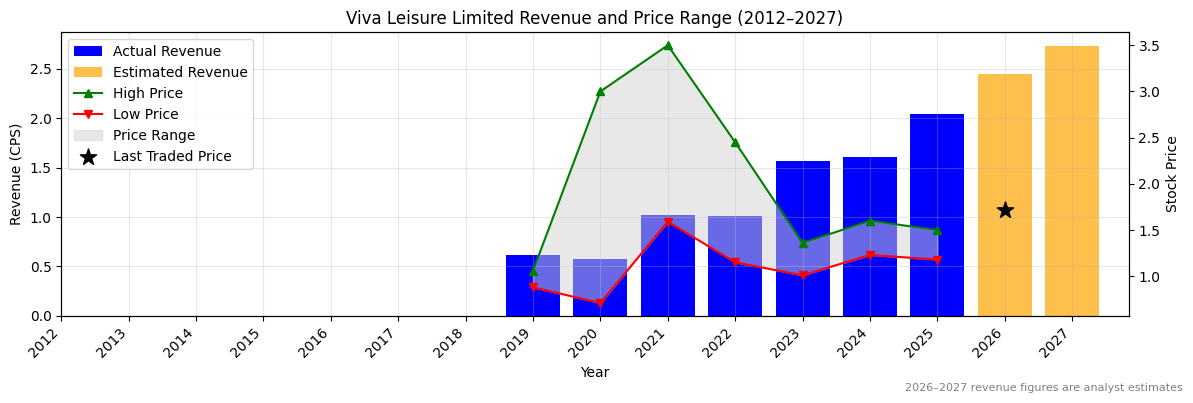
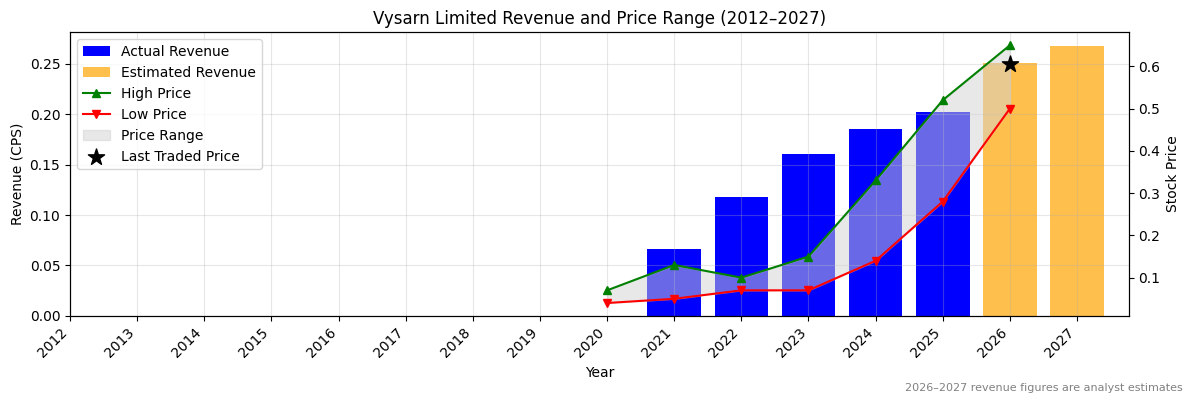
VVA Revenue Per Share (2012–2027)
✅✅
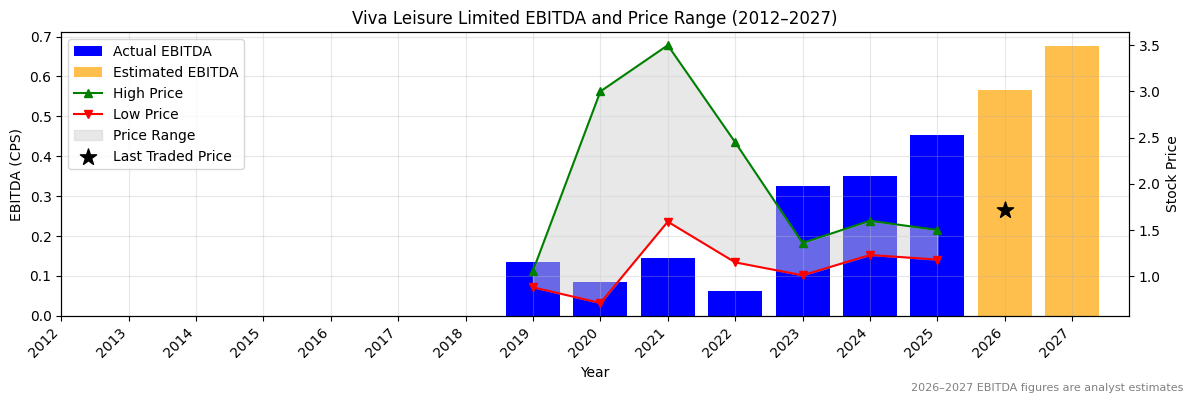
VVA Earnings before Interest, Tax, Depreciation and Amortisation (EBITDA) Per Share (2012–2027)
✅✅
VVA Normalised Earnings Per Share (EPS) (2012–2027)
❌
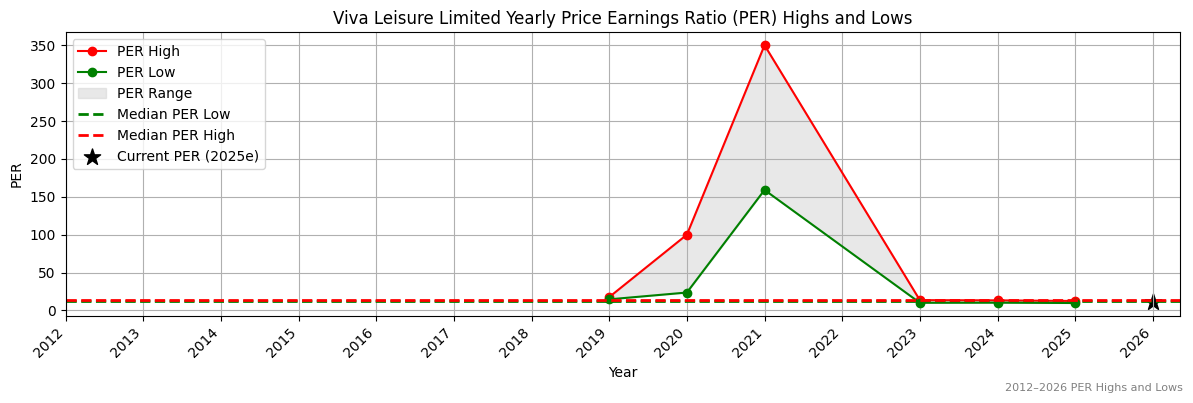
Valuation
| Price To Sales |
Price To Book |
PER 2023 |
PER 2024 |
13Y Median PER Low |
PER 2025e |
13Y Median PER High |
PER 2026e |
Last Updated |
| 0.8 |
1.5 |
16.8 |
14.0 |
12.5 |
14.0 |
13.6 |
11.2 |
4/10/25 |
VVA Yearly Price Earnings Ratio (PER) Highs and Lows
❌
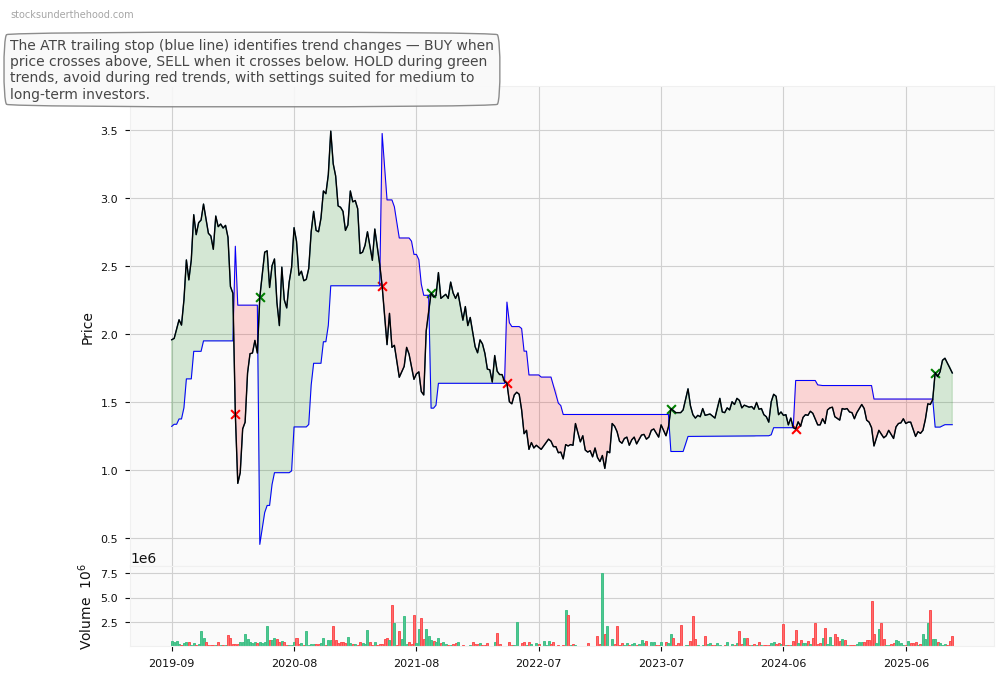
VVA Weekly Price Chart with Average True Range (ATR) Trailing Stop (10-Year View)
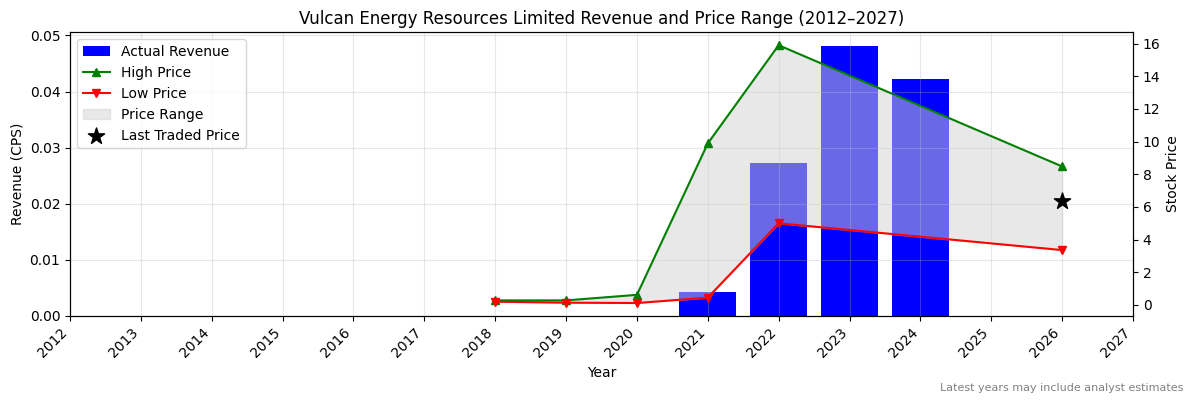
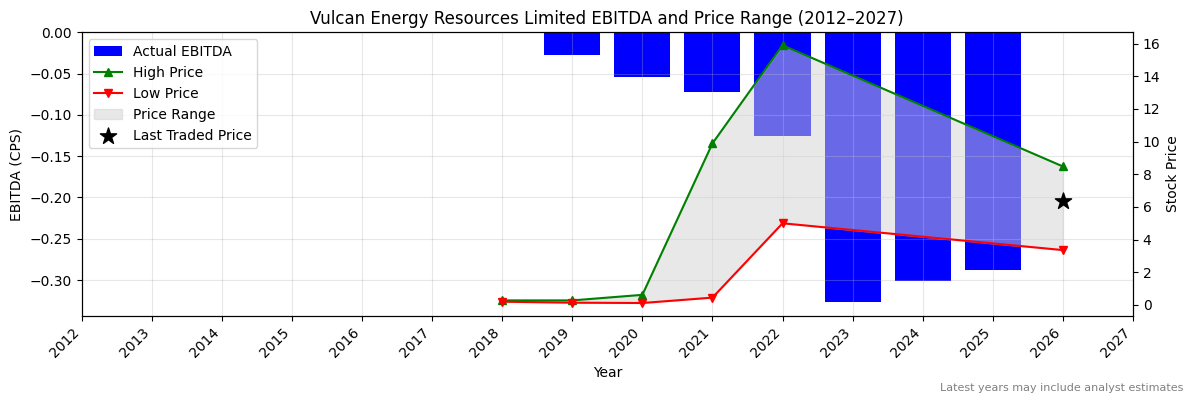
Ticker code: VUL
VUL Red Flags & Risk Indicators
❌
⚠️ RED FLAGS: 5 identified
- Large Share Issuance
- Highly Shorted
- Increasing Shorts
- Falling Earnings
- High Price to Book vs ROE
Income Statement
| Revenue 2024 Per Share |
Revenue 2025e Per Share |
Revenue 2026e Per Share |
Revenue 24 to 25e [%] |
Revenue 25e to 26e [%] |
EBITDA 2024 Per Share |
EBITDA 2025e Per Share |
EBITDA 2026e Per Share |
EBITDA 24 to 25e [%] |
EBITDA 25e to 26e [%] |
| 0.04225 |
None |
None |
None |
None |
-0.30127 |
-0.28783 |
None |
4.5 |
None |
VUL Revenue Per Share (2012–2027)
VUL Earnings before Interest, Tax, Depreciation and Amortisation (EBITDA) Per Share (2012–2027)
✅
VUL Normalised Earnings Per Share (EPS) (2012–2027)
❌
Valuation
| Price To Sales |
Price To Book |
PER 2023 |
PER 2024 |
13Y Median PER Low |
PER 2025e |
13Y Median PER High |
PER 2026e |
Last Updated |
| 75.0 |
4.5 |
-24.0 |
-19.2 |
None |
-10.0 |
None |
-9.2 |
13/4/24 |
VUL Yearly Price Earnings Ratio (PER) Highs and Lows
VUL Weekly Price Chart with Average True Range (ATR) Trailing Stop (10-Year View)
Ticker code: VNT
VNT Red Flags & Risk Indicators
⚠️
⚠️ RED FLAGS: 2 identified
- Falling Revenues
- High Relative Valuation
Income Statement
| Revenue 2024 Per Share |
Revenue 2025e Per Share |
Revenue 2026e Per Share |
Revenue 24 to 25e [%] |
Revenue 25e to 26e [%] |
EBITDA 2024 Per Share |
EBITDA 2025e Per Share |
EBITDA 2026e Per Share |
EBITDA 24 to 25e [%] |
EBITDA 25e to 26e [%] |
| 7.13689 |
7.28556 |
7.9526 |
2.1 |
9.2 |
0.58365 |
0.62994 |
0.66581 |
7.9 |
5.7 |
VNT Revenue Per Share (2012–2027)
✅
VNT Earnings before Interest, Tax, Depreciation and Amortisation (EBITDA) Per Share (2012–2027)
✅
VNT Normalised Earnings Per Share (EPS) (2012–2027)
✅
Valuation
| Price To Sales |
Price To Book |
PER 2023 |
PER 2024 |
13Y Median PER Low |
PER 2025e |
13Y Median PER High |
PER 2026e |
Last Updated |
| 0.8 |
8.2 |
24.9 |
22.0 |
10.3 |
19.1 |
15.2 |
17.4 |
4/10/25 |
VNT Yearly Price Earnings Ratio (PER) Highs and Lows
❌
VNT Weekly Price Chart with Average True Range (ATR) Trailing Stop (10-Year View)
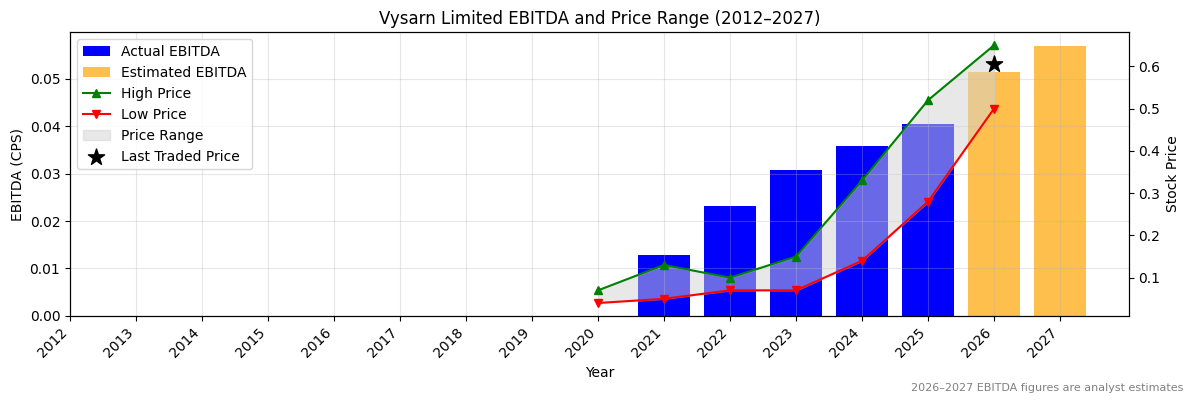
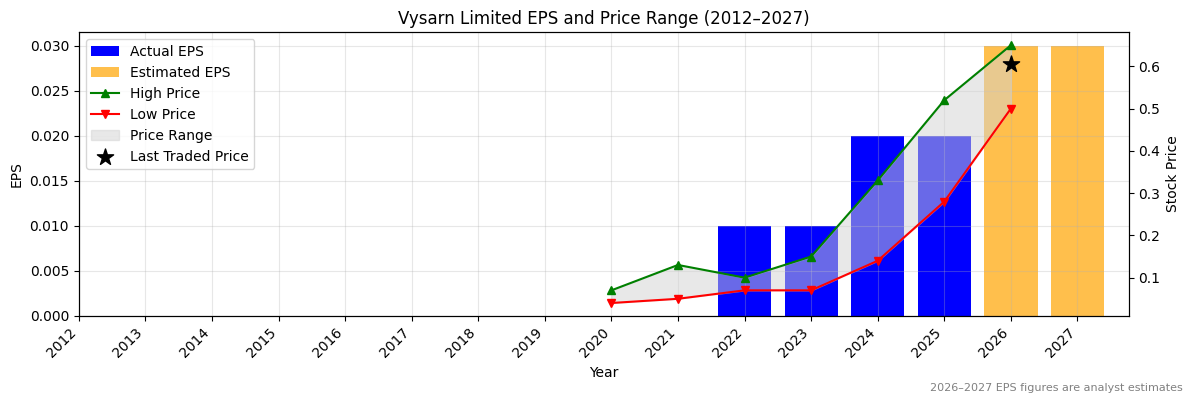
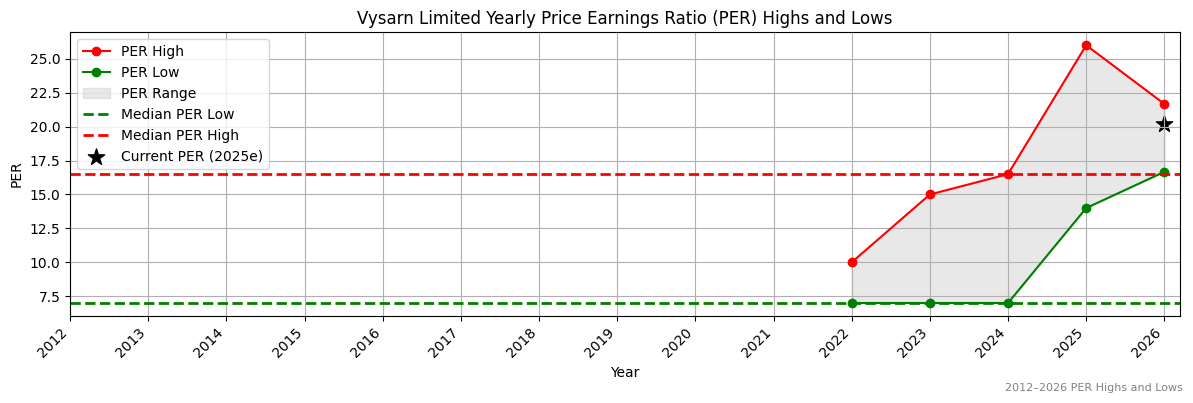
Ticker code: VYS
VYS Red Flags & Risk Indicators
⚠️
⚠️ RED FLAGS: 1 identified
Income Statement
| Revenue 2024 Per Share |
Revenue 2025e Per Share |
Revenue 2026e Per Share |
Revenue 24 to 25e [%] |
Revenue 25e to 26e [%] |
EBITDA 2024 Per Share |
EBITDA 2025e Per Share |
EBITDA 2026e Per Share |
EBITDA 24 to 25e [%] |
EBITDA 25e to 26e [%] |
| 0.18571 |
0.20198 |
0.25074 |
8.8 |
24.1 |
0.03574 |
0.04044 |
0.05138 |
13.2 |
27.0 |
VYS Revenue Per Share (2012–2027)
✅
VYS Earnings before Interest, Tax, Depreciation and Amortisation (EBITDA) Per Share (2012–2027)
✅
VYS Normalised Earnings Per Share (EPS) (2012–2027)
❌
Valuation
| Price To Sales |
Price To Book |
PER 2023 |
PER 2024 |
13Y Median PER Low |
PER 2025e |
13Y Median PER High |
PER 2026e |
Last Updated |
| 3.2 |
3.4 |
64.5 |
32.3 |
7.0 |
32.2 |
16.5 |
21.5 |
3/10/25 |
VYS Yearly Price Earnings Ratio (PER) Highs and Lows
❌
VYS Weekly Price Chart with Average True Range (ATR) Trailing Stop (10-Year View)
Ticker code: VMT
VMT Red Flags & Risk Indicators
✅
⚠️ RED FLAGS: 0 identified
No red flags detected.
Income Statement
| Revenue 2024 Per Share |
Revenue 2025e Per Share |
Revenue 2026e Per Share |
Revenue 24 to 25e [%] |
Revenue 25e to 26e [%] |
EBITDA 2024 Per Share |
EBITDA 2025e Per Share |
EBITDA 2026e Per Share |
EBITDA 24 to 25e [%] |
EBITDA 25e to 26e [%] |
| None |
None |
None |
None |
None |
None |
None |
None |
None |
None |
VMT Revenue Per Share (2012–2027)
VMT Earnings before Interest, Tax, Depreciation and Amortisation (EBITDA) Per Share (2012–2027)
VMT Normalised Earnings Per Share (EPS) (2012–2027)
Valuation
| Price To Sales |
Price To Book |
PER 2023 |
PER 2024 |
13Y Median PER Low |
PER 2025e |
13Y Median PER High |
PER 2026e |
Last Updated |
| 0.5 |
0.4 |
None |
None |
None |
None |
None |
None |
None |
VMT Yearly Price Earnings Ratio (PER) Highs and Lows
VMT Weekly Price Chart with Average True Range (ATR) Trailing Stop (10-Year View)
Ticker code: VLS
VLS Red Flags & Risk Indicators
⚠️
⚠️ RED FLAGS: 2 identified
- Falling Earnings
- High Relative Valuation
Income Statement
| Revenue 2024 Per Share |
Revenue 2025e Per Share |
Revenue 2026e Per Share |
Revenue 24 to 25e [%] |
Revenue 25e to 26e [%] |
EBITDA 2024 Per Share |
EBITDA 2025e Per Share |
EBITDA 2026e Per Share |
EBITDA 24 to 25e [%] |
EBITDA 25e to 26e [%] |
| 1.47216 |
None |
None |
None |
None |
0.20919 |
0.20896 |
None |
-0.1 |
None |
VLS Revenue Per Share (2012–2027)
VLS Earnings before Interest, Tax, Depreciation and Amortisation (EBITDA) Per Share (2012–2027)
❌
VLS Normalised Earnings Per Share (EPS) (2012–2027)
Valuation
| Price To Sales |
Price To Book |
PER 2023 |
PER 2024 |
13Y Median PER Low |
PER 2025e |
13Y Median PER High |
PER 2026e |
Last Updated |
| 1.5 |
2.5 |
None |
14.1 |
11.5 |
None |
20.5 |
None |
4/3/24 |
VLS Yearly Price Earnings Ratio (PER) Highs and Lows
VLS Weekly Price Chart with Average True Range (ATR) Trailing Stop (10-Year View)
Ticker code: VGL
VGL Red Flags & Risk Indicators
⚠️
⚠️ RED FLAGS: 2 identified
- Low Operating Margin
- High Relative Valuation
Income Statement
| Revenue 2024 Per Share |
Revenue 2025e Per Share |
Revenue 2026e Per Share |
Revenue 24 to 25e [%] |
Revenue 25e to 26e [%] |
EBITDA 2024 Per Share |
EBITDA 2025e Per Share |
EBITDA 2026e Per Share |
EBITDA 24 to 25e [%] |
EBITDA 25e to 26e [%] |
| 0.63494 |
0.70732 |
0.79185 |
11.4 |
11.9 |
0.09143 |
0.11992 |
0.1571 |
31.2 |
31.0 |
VGL Revenue Per Share (2012–2027)
✅
VGL Earnings before Interest, Tax, Depreciation and Amortisation (EBITDA) Per Share (2012–2027)
✅✅
VGL Normalised Earnings Per Share (EPS) (2012–2027)
✅✅
Valuation
| Price To Sales |
Price To Book |
PER 2023 |
PER 2024 |
13Y Median PER Low |
PER 2025e |
13Y Median PER High |
PER 2026e |
Last Updated |
| 3.5 |
3.9 |
None |
-230.0 |
40.9 |
230.0 |
55.6 |
76.7 |
11/10/25 |
VGL Yearly Price Earnings Ratio (PER) Highs and Lows
❌
VGL Weekly Price Chart with Average True Range (ATR) Trailing Stop (10-Year View)
Ticker code: VEE
VEE Red Flags & Risk Indicators
❌
⚠️ RED FLAGS: 4 identified
- Increasing Shorts
- Falling Earnings
- Falling Revenues
- Falling EBITDA Margins
Income Statement
| Revenue 2024 Per Share |
Revenue 2025e Per Share |
Revenue 2026e Per Share |
Revenue 24 to 25e [%] |
Revenue 25e to 26e [%] |
EBITDA 2024 Per Share |
EBITDA 2025e Per Share |
EBITDA 2026e Per Share |
EBITDA 24 to 25e [%] |
EBITDA 25e to 26e [%] |
| 0.59332 |
0.50453 |
0.57165 |
-15.0 |
13.3 |
0.10901 |
0.06629 |
0.09508 |
-39.2 |
43.4 |
VEE Revenue Per Share (2012–2027)
❌
VEE Earnings before Interest, Tax, Depreciation and Amortisation (EBITDA) Per Share (2012–2027)
❌
VEE Normalised Earnings Per Share (EPS) (2012–2027)
❌
Valuation
| Price To Sales |
Price To Book |
PER 2023 |
PER 2024 |
13Y Median PER Low |
PER 2025e |
13Y Median PER High |
PER 2026e |
Last Updated |
| 3.0 |
3.6 |
47.5 |
28.5 |
19.5 |
71.2 |
36.2 |
35.6 |
17/8/25 |
VEE Yearly Price Earnings Ratio (PER) Highs and Lows
❌
VEE Weekly Price Chart with Average True Range (ATR) Trailing Stop (10-Year View)
Ticker code: VEA
VEA Red Flags & Risk Indicators
❌
⚠️ RED FLAGS: 4 identified
- Low Operating Margin
- Highly Shorted
- Falling Earnings
- More Net Debt Than Equity
Income Statement
| Revenue 2024 Per Share |
Revenue 2025e Per Share |
Revenue 2026e Per Share |
Revenue 24 to 25e [%] |
Revenue 25e to 26e [%] |
EBITDA 2024 Per Share |
EBITDA 2025e Per Share |
EBITDA 2026e Per Share |
EBITDA 24 to 25e [%] |
EBITDA 25e to 26e [%] |
| 18.90008 |
18.65884 |
18.97195 |
-1.3 |
1.7 |
0.4694 |
0.43024 |
0.57119 |
-8.3 |
32.8 |
VEA Revenue Per Share (2012–2027)
❌
VEA Earnings before Interest, Tax, Depreciation and Amortisation (EBITDA) Per Share (2012–2027)
❌
VEA Normalised Earnings Per Share (EPS) (2012–2027)
❌
Valuation
| Price To Sales |
Price To Book |
PER 2023 |
PER 2024 |
13Y Median PER Low |
PER 2025e |
13Y Median PER High |
PER 2026e |
Last Updated |
| 0.1 |
1.8 |
8.7 |
11.4 |
14.1 |
18.4 |
21.1 |
8.7 |
8/7/25 |
VEA Yearly Price Earnings Ratio (PER) Highs and Lows
✅
VEA Weekly Price Chart with Average True Range (ATR) Trailing Stop (10-Year View)
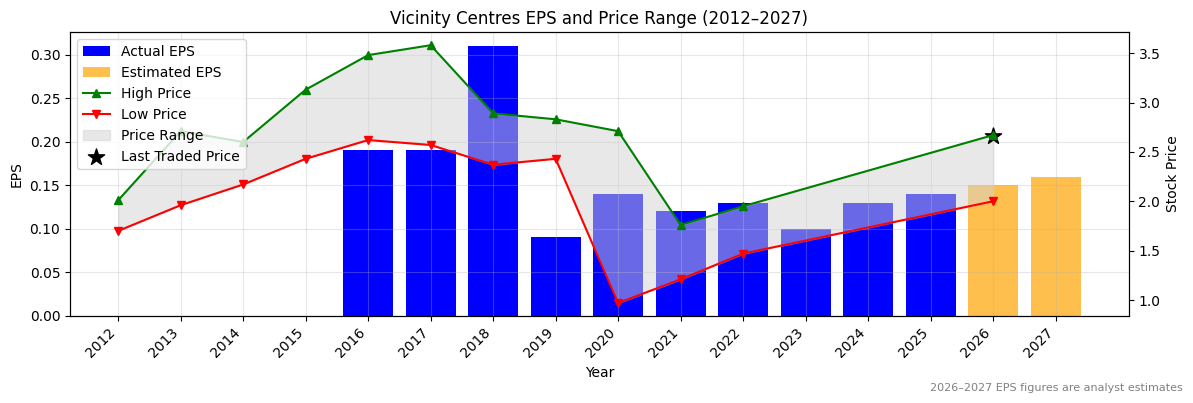
Ticker code: VCX
VCX Red Flags & Risk Indicators
❌
⚠️ RED FLAGS: 3 identified
- Increasing Shorts
- Falling Earnings
- Falling EBITDA Margins
Income Statement
| Revenue 2024 Per Share |
Revenue 2025e Per Share |
Revenue 2026e Per Share |
Revenue 24 to 25e [%] |
Revenue 25e to 26e [%] |
EBITDA 2024 Per Share |
EBITDA 2025e Per Share |
EBITDA 2026e Per Share |
EBITDA 24 to 25e [%] |
EBITDA 25e to 26e [%] |
| 0.20823 |
0.21049 |
0.21444 |
1.1 |
1.9 |
0.1967 |
0.19168 |
0.19994 |
-2.6 |
4.3 |
VCX Revenue Per Share (2012–2027)
✅
VCX Earnings before Interest, Tax, Depreciation and Amortisation (EBITDA) Per Share (2012–2027)
❌
VCX Normalised Earnings Per Share (EPS) (2012–2027)
✅
Valuation
| Price To Sales |
Price To Book |
PER 2023 |
PER 2024 |
13Y Median PER Low |
PER 2025e |
13Y Median PER High |
PER 2026e |
Last Updated |
| 8.4 |
1.0 |
25.2 |
19.4 |
12.3 |
18.0 |
18.1 |
16.8 |
12/11/24 |
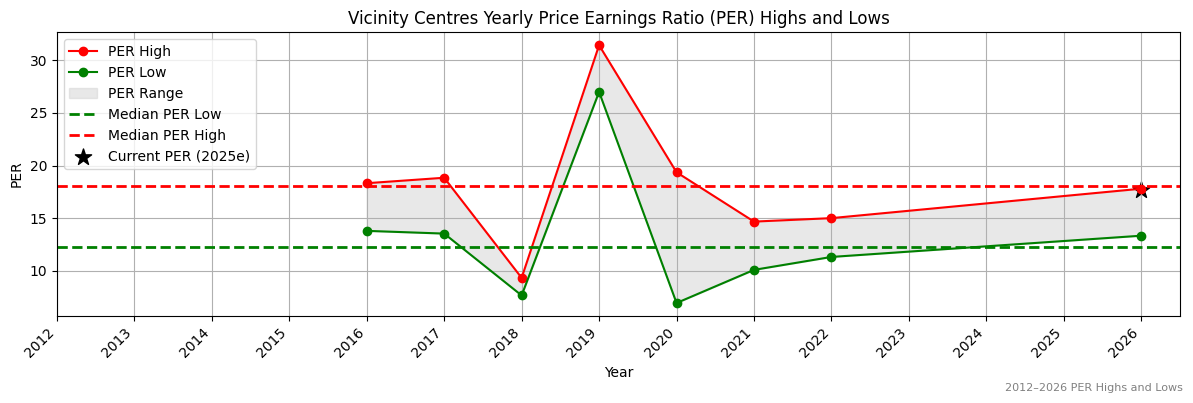
VCX Yearly Price Earnings Ratio (PER) Highs and Lows
✅
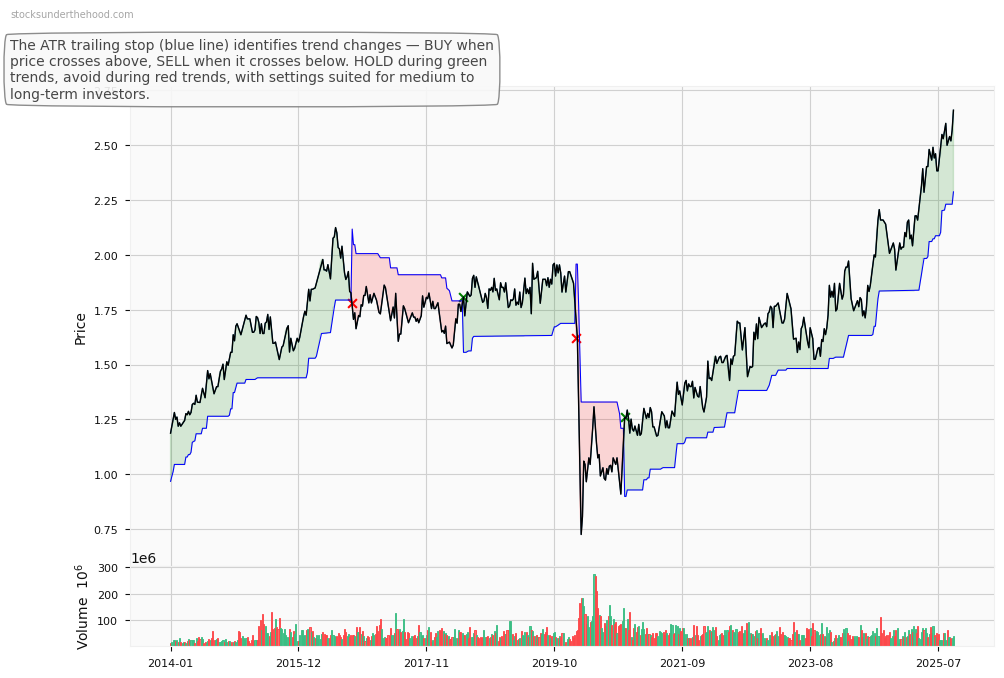
VCX Weekly Price Chart with Average True Range (ATR) Trailing Stop (10-Year View)
Ticker code: VAU
VAU Red Flags & Risk Indicators
⚠️
⚠️ RED FLAGS: 1 identified
Income Statement
| Revenue 2024 Per Share |
Revenue 2025e Per Share |
Revenue 2026e Per Share |
Revenue 24 to 25e [%] |
Revenue 25e to 26e [%] |
EBITDA 2024 Per Share |
EBITDA 2025e Per Share |
EBITDA 2026e Per Share |
EBITDA 24 to 25e [%] |
EBITDA 25e to 26e [%] |
| 0.09114 |
0.21053 |
0.229 |
131.0 |
8.8 |
0.02832 |
0.09105 |
0.10772 |
221.5 |
18.3 |
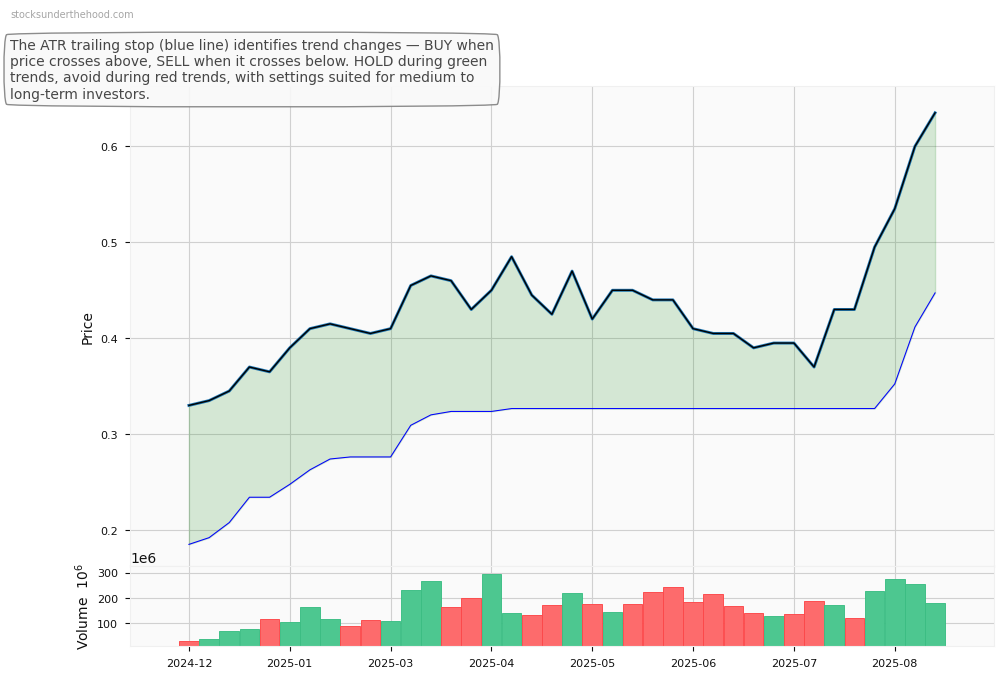
VAU Revenue Per Share (2012–2027)
✅✅
VAU Earnings before Interest, Tax, Depreciation and Amortisation (EBITDA) Per Share (2012–2027)
✅✅
VAU Normalised Earnings Per Share (EPS) (2012–2027)
✅✅
Valuation
| Price To Sales |
Price To Book |
PER 2023 |
PER 2024 |
13Y Median PER Low |
PER 2025e |
13Y Median PER High |
PER 2026e |
Last Updated |
| 3.5 |
2.5 |
None |
73.0 |
9.3 |
24.3 |
19.9 |
18.3 |
4/10/25 |
VAU Yearly Price Earnings Ratio (PER) Highs and Lows
❌
VAU Weekly Price Chart with Average True Range (ATR) Trailing Stop (10-Year View)