Ticker code: URW
URW Red Flags & Risk Indicators
✅
⚠️ RED FLAGS: 0 identified
No red flags detected.
Income Statement
| Revenue 2024 Per Share |
Revenue 2025e Per Share |
Revenue 2026e Per Share |
Revenue 24 to 25e [%] |
Revenue 25e to 26e [%] |
EBITDA 2024 Per Share |
EBITDA 2025e Per Share |
EBITDA 2026e Per Share |
EBITDA 24 to 25e [%] |
EBITDA 25e to 26e [%] |
| None |
None |
None |
None |
None |
None |
None |
None |
None |
None |
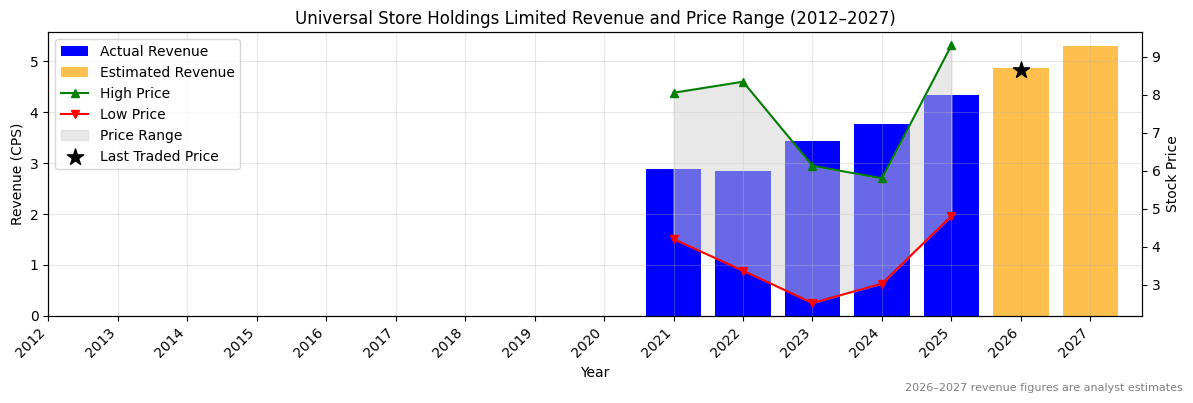
URW Revenue Per Share (2012–2027)
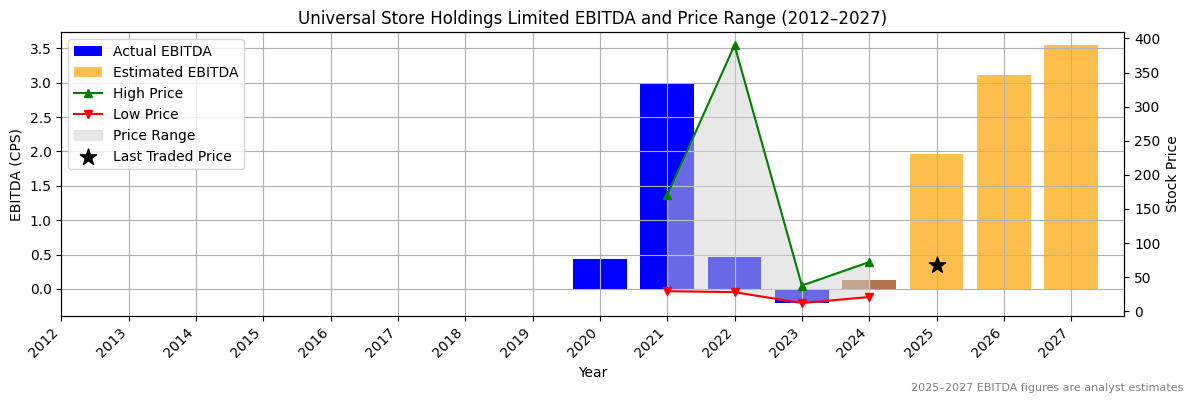
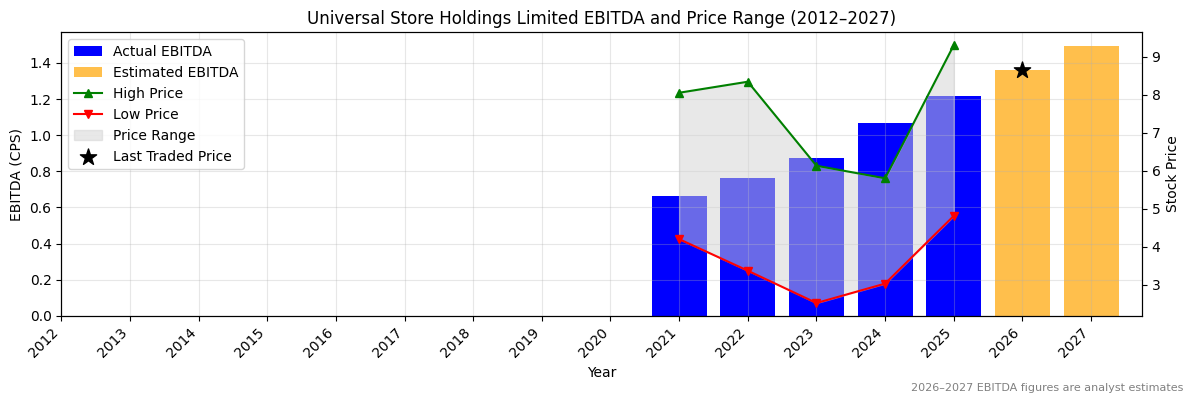
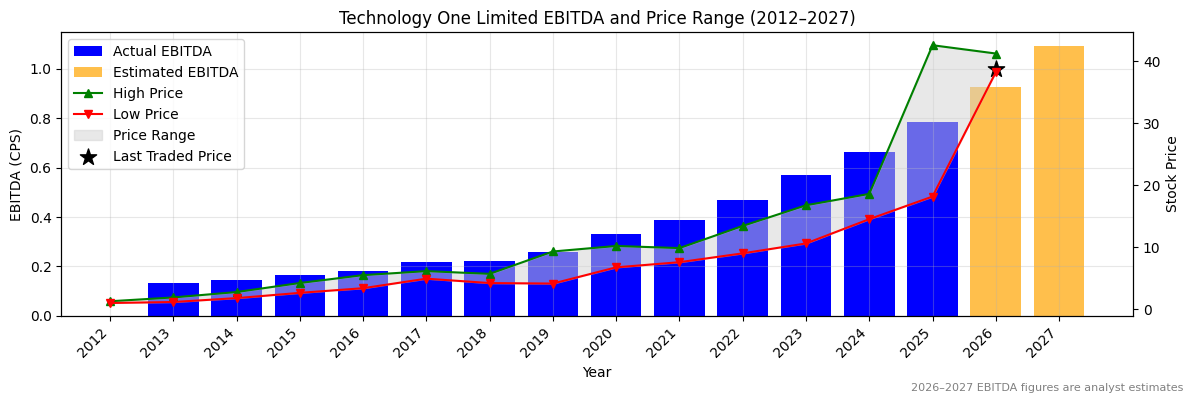
URW Earnings before Interest, Tax, Depreciation and Amortisation (EBITDA) Per Share (2012–2027)
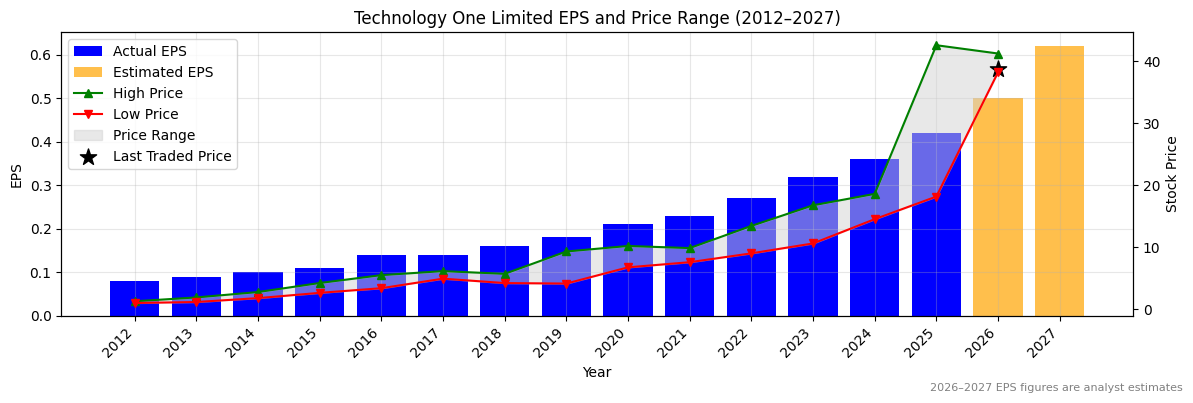
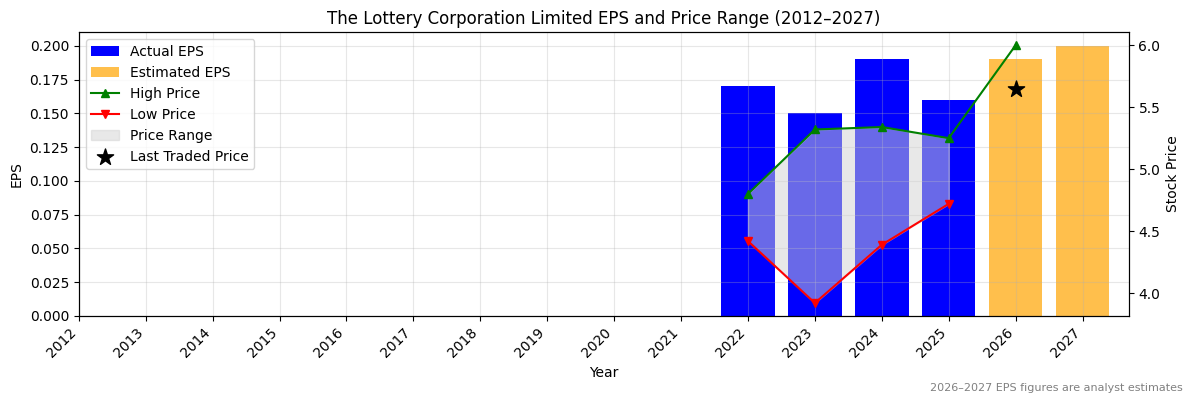
URW Normalised Earnings Per Share (EPS) (2012–2027)
Valuation
| Price To Sales |
Price To Book |
PER 2023 |
PER 2024 |
13Y Median PER Low |
PER 2025e |
13Y Median PER High |
PER 2026e |
Last Updated |
| 6.5 |
0.1 |
None |
None |
None |
None |
None |
None |
None |
URW Yearly Price Earnings Ratio (PER) Highs and Lows
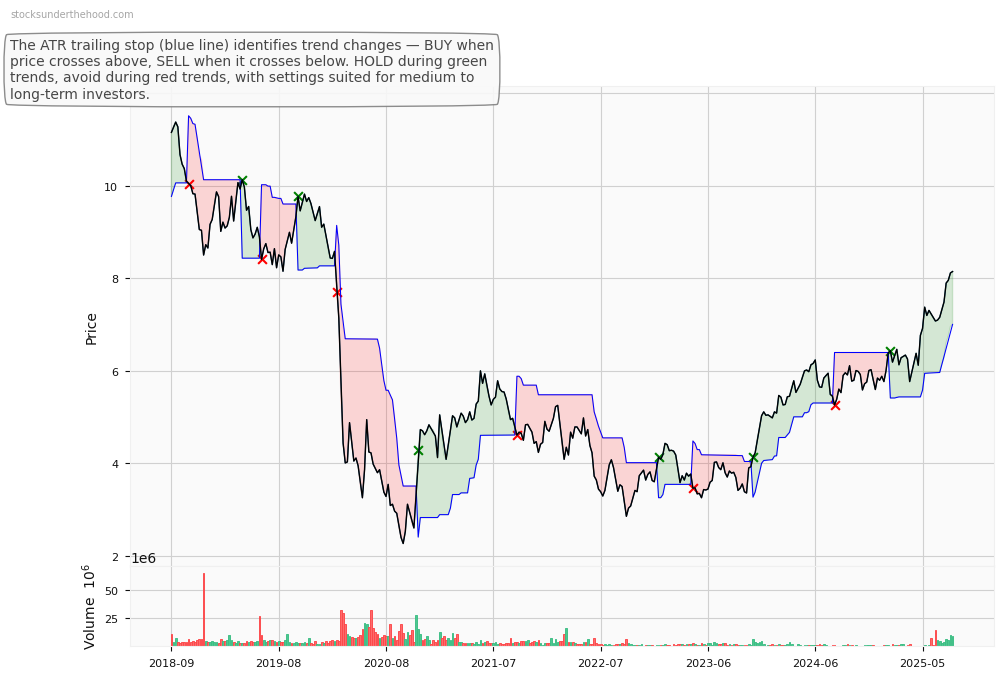
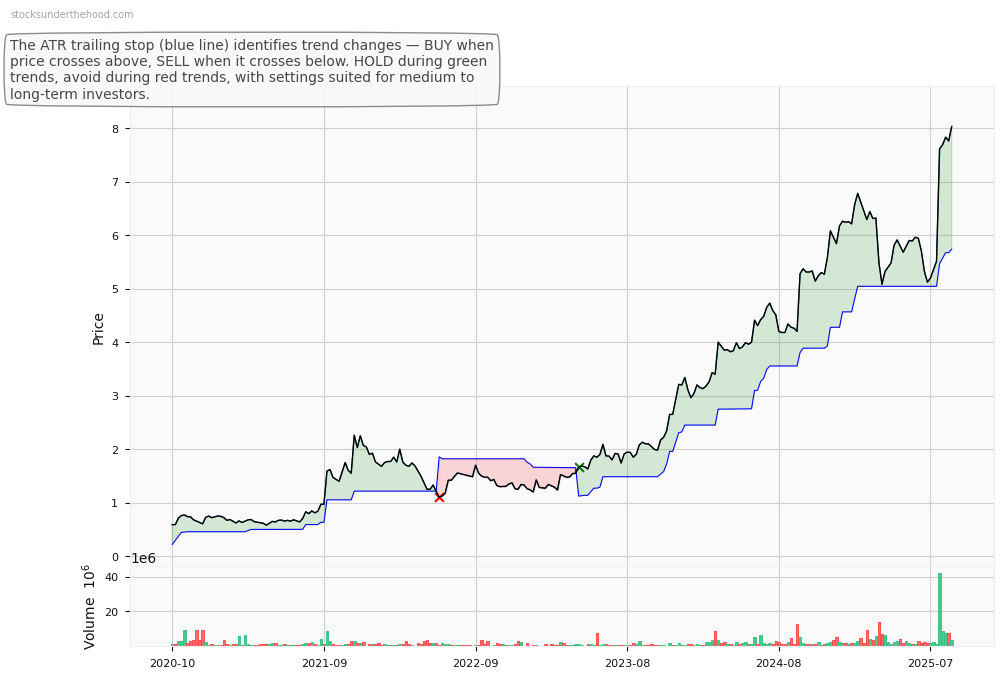
URW Weekly Price Chart with Average True Range (ATR) Trailing Stop (10-Year View)
Ticker code: UPST
UPST Red Flags & Risk Indicators
⚠️
⚠️ RED FLAGS: 1 identified
- More Net Debt Than Equity
Income Statement
| Revenue 2024 Per Share |
Revenue 2025e Per Share |
Revenue 2026e Per Share |
Revenue 24 to 25e [%] |
Revenue 25e to 26e [%] |
EBITDA 2024 Per Share |
EBITDA 2025e Per Share |
EBITDA 2026e Per Share |
EBITDA 24 to 25e [%] |
EBITDA 25e to 26e [%] |
| 7.36469 |
10.4514 |
12.87216 |
41.9 |
23.2 |
0.12253 |
1.96164 |
3.11523 |
1501.0 |
58.8 |
UPST Revenue Per Share (2012–2027)
✅✅
UPST Earnings before Interest, Tax, Depreciation and Amortisation (EBITDA) Per Share (2012–2027)
✅✅
UPST Normalised Earnings Per Share (EPS) (2012–2027)
✅✅
Valuation
| Price To Sales |
Price To Book |
PER 2023 |
PER 2024 |
13Y Median PER Low |
PER 2025e |
13Y Median PER High |
PER 2026e |
Last Updated |
| 4.9 |
6.0 |
-80.3 |
-224.8 |
13.9 |
32.3 |
71.7 |
19.9 |
9/11/24 |
UPST Yearly Price Earnings Ratio (PER) Highs and Lows
✅
UPST Weekly Price Chart with Average True Range (ATR) Trailing Stop (10-Year View)
Ticker code: UNI
UNI Red Flags & Risk Indicators
⚠️
⚠️ RED FLAGS: 2 identified
- Increasing Shorts
- Falling Earnings
Income Statement
| Revenue 2024 Per Share |
Revenue 2025e Per Share |
Revenue 2026e Per Share |
Revenue 24 to 25e [%] |
Revenue 25e to 26e [%] |
EBITDA 2024 Per Share |
EBITDA 2025e Per Share |
EBITDA 2026e Per Share |
EBITDA 24 to 25e [%] |
EBITDA 25e to 26e [%] |
| 3.76069 |
4.34393 |
4.858 |
15.5 |
11.8 |
1.06751 |
1.21623 |
1.36299 |
13.9 |
12.1 |
UNI Revenue Per Share (2012–2027)
✅
UNI Earnings before Interest, Tax, Depreciation and Amortisation (EBITDA) Per Share (2012–2027)
✅
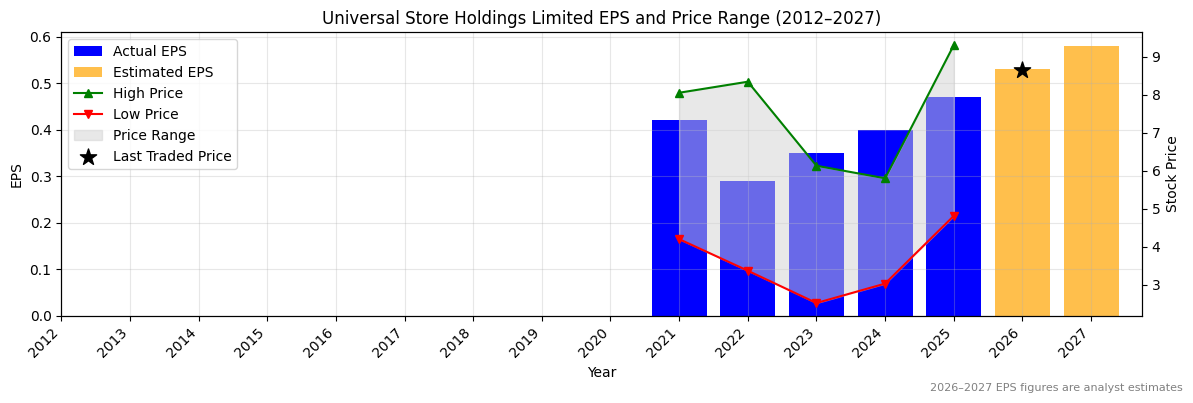
UNI Normalised Earnings Per Share (EPS) (2012–2027)
✅
Valuation
| Price To Sales |
Price To Book |
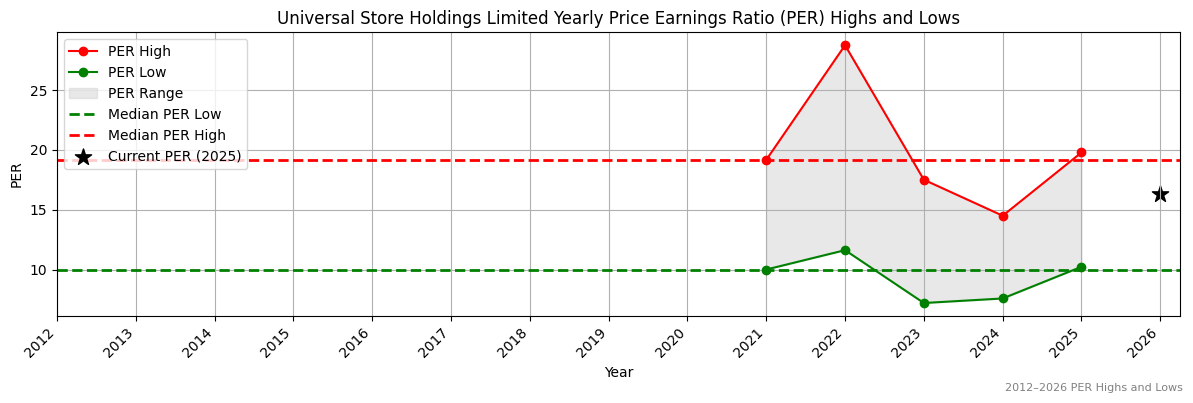
PER 2023 |
PER 2024 |
13Y Median PER Low |
PER 2025e |
13Y Median PER High |
PER 2026e |
Last Updated |
| 2.0 |
4.7 |
25.3 |
22.1 |
10.0 |
18.9 |
19.2 |
16.7 |
11/10/25 |
UNI Yearly Price Earnings Ratio (PER) Highs and Lows
✅
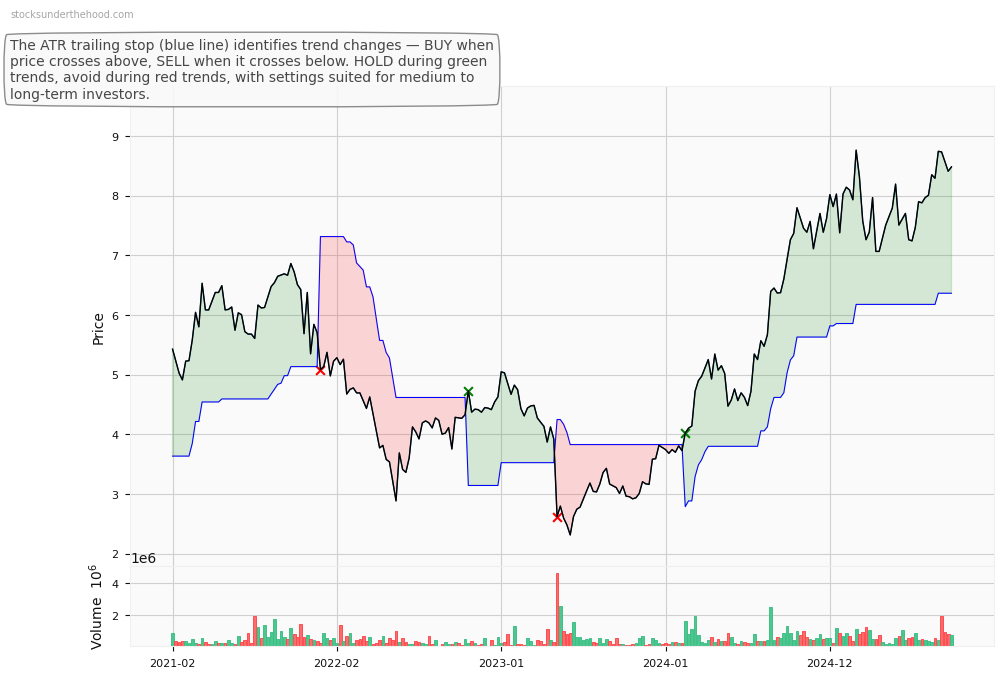
UNI Weekly Price Chart with Average True Range (ATR) Trailing Stop (10-Year View)
Ticker code: TYR
TYR Red Flags & Risk Indicators
⚠️
⚠️ RED FLAGS: 2 identified
- Increasing Shorts
- Falling Earnings
Income Statement
| Revenue 2024 Per Share |
Revenue 2025e Per Share |
Revenue 2026e Per Share |
Revenue 24 to 25e [%] |
Revenue 25e to 26e [%] |
EBITDA 2024 Per Share |
EBITDA 2025e Per Share |
EBITDA 2026e Per Share |
EBITDA 24 to 25e [%] |
EBITDA 25e to 26e [%] |
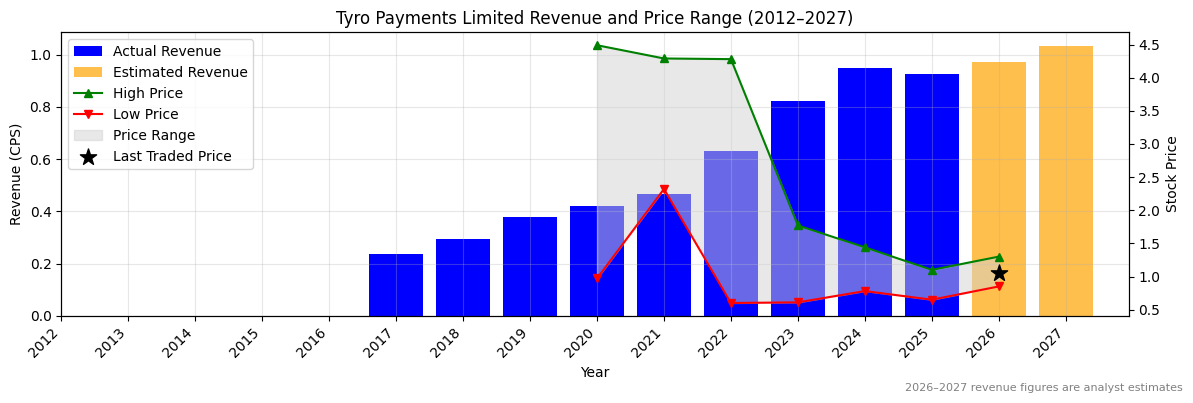
| 0.94893 |
0.92684 |
0.9722 |
-2.3 |
4.9 |
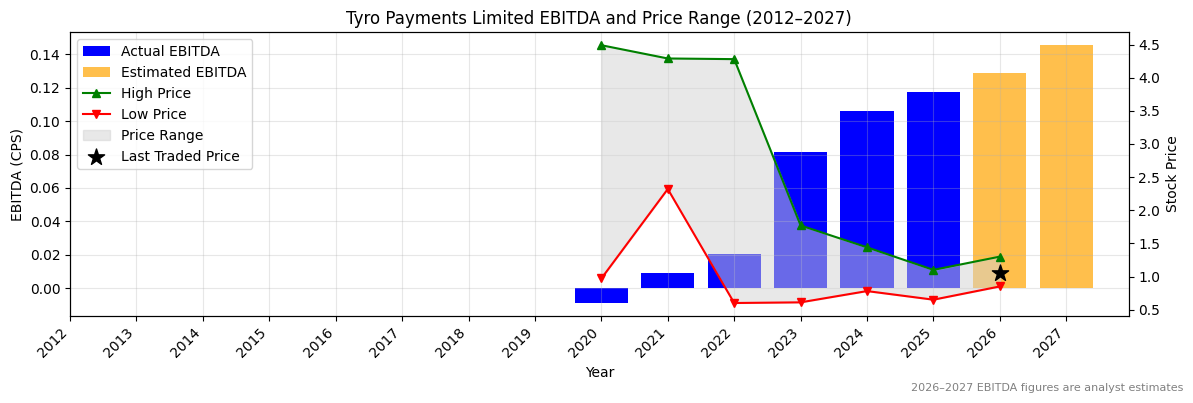
0.10616 |
0.11736 |
0.12872 |
10.6 |
9.7 |
TYR Revenue Per Share (2012–2027)
❌
TYR Earnings before Interest, Tax, Depreciation and Amortisation (EBITDA) Per Share (2012–2027)
✅
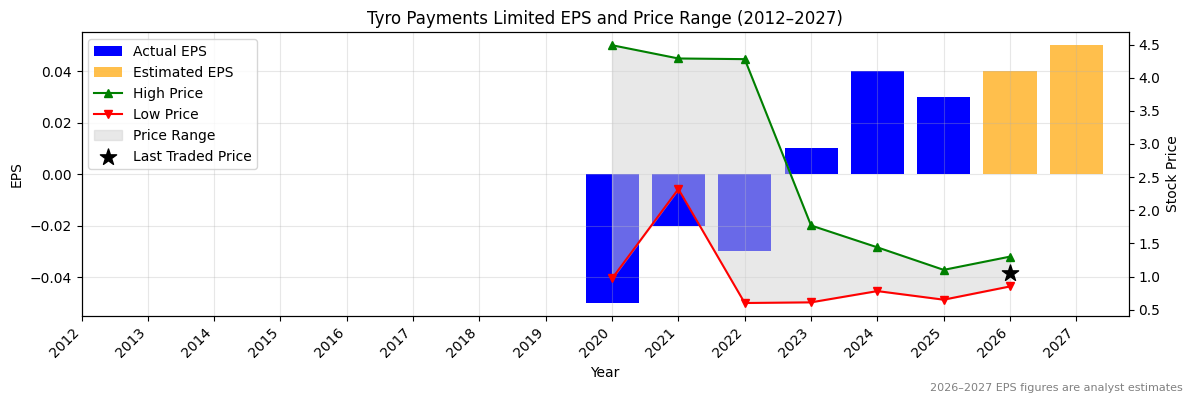
TYR Normalised Earnings Per Share (EPS) (2012–2027)
❌
Valuation
| Price To Sales |
Price To Book |
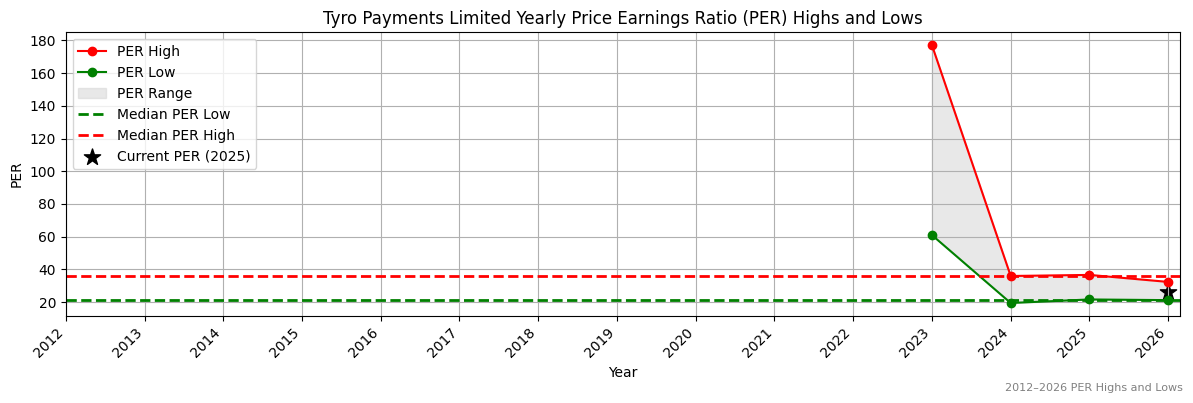
PER 2023 |
PER 2024 |
13Y Median PER Low |
PER 2025e |
13Y Median PER High |
PER 2026e |
Last Updated |
| 1.2 |
2.6 |
111.0 |
27.8 |
21.5 |
37.0 |
36.3 |
27.8 |
3/10/25 |
TYR Yearly Price Earnings Ratio (PER) Highs and Lows
❌
TYR Weekly Price Chart with Average True Range (ATR) Trailing Stop (10-Year View)
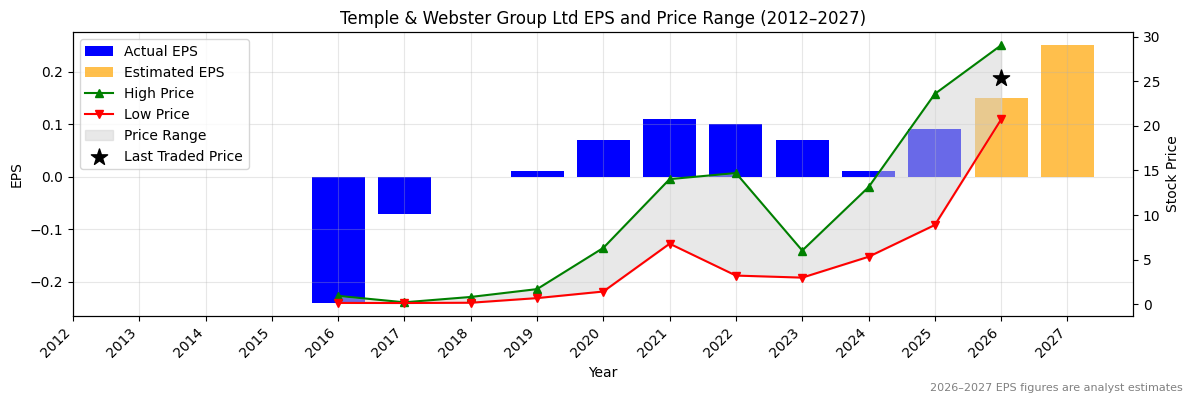
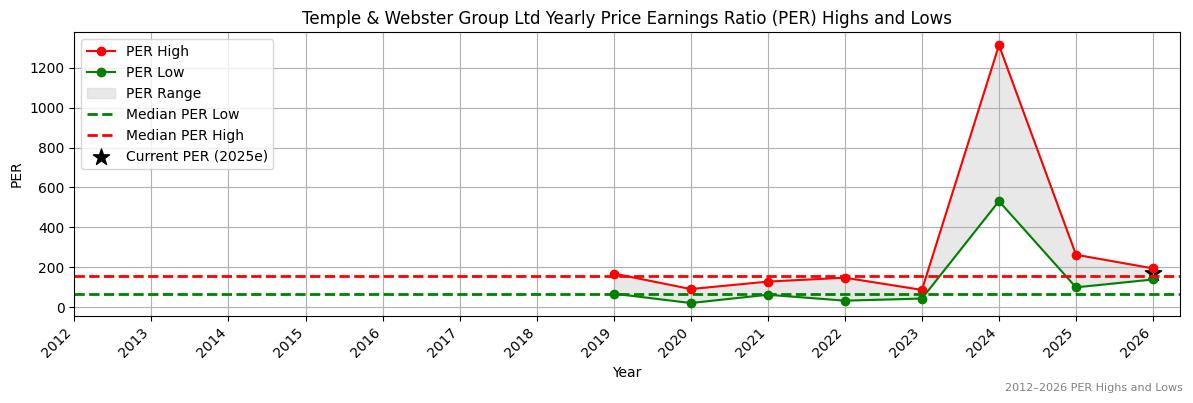
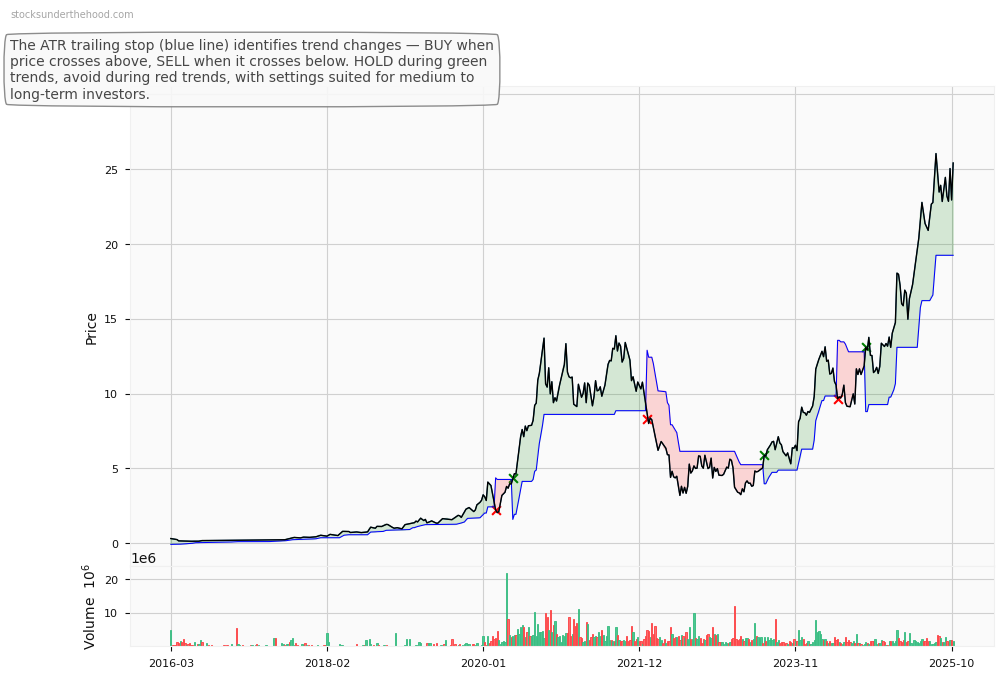
Ticker code: TWE
TWE Red Flags & Risk Indicators
❌
⚠️ RED FLAGS: 3 identified
- Highly Shorted
- Increasing Shorts
- Falling Revenues
Income Statement
| Revenue 2024 Per Share |
Revenue 2025e Per Share |
Revenue 2026e Per Share |
Revenue 24 to 25e [%] |
Revenue 25e to 26e [%] |
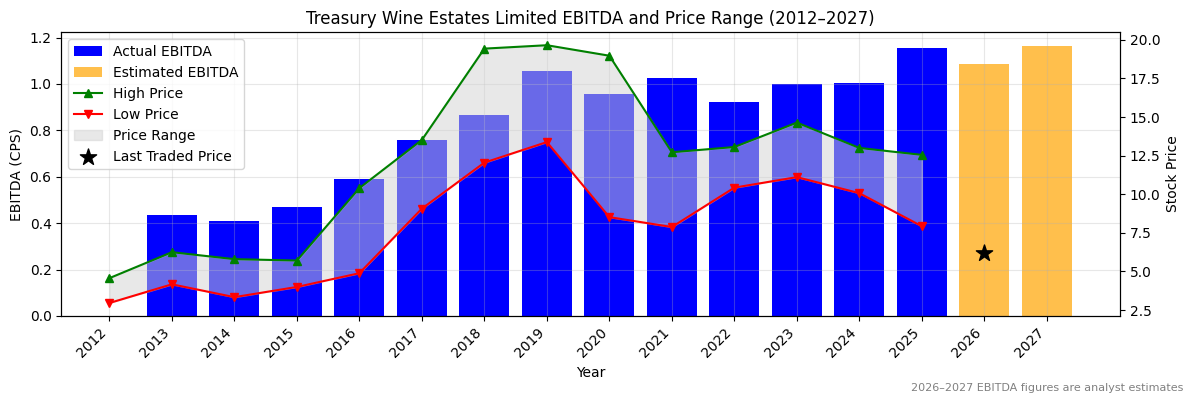
EBITDA 2024 Per Share |
EBITDA 2025e Per Share |
EBITDA 2026e Per Share |
EBITDA 24 to 25e [%] |
EBITDA 25e to 26e [%] |
| 3.46106 |
3.72847 |
3.91007 |
7.7 |
4.9 |
1.00234 |
1.15455 |
1.08665 |
15.2 |
-5.9 |
TWE Revenue Per Share (2012–2027)
✅
TWE Earnings before Interest, Tax, Depreciation and Amortisation (EBITDA) Per Share (2012–2027)
✅
TWE Normalised Earnings Per Share (EPS) (2012–2027)
✅
Valuation
| Price To Sales |
Price To Book |
PER 2023 |
PER 2024 |
13Y Median PER Low |
PER 2025e |
13Y Median PER High |
PER 2026e |
Last Updated |
| 1.6 |
1.0 |
11.5 |
11.5 |
19.4 |
10.3 |
29.7 |
9.2 |
23/6/25 |
TWE Yearly Price Earnings Ratio (PER) Highs and Lows
✅✅
TWE Weekly Price Chart with Average True Range (ATR) Trailing Stop (10-Year View)
Ticker code: TUA
TUA Red Flags & Risk Indicators
⚠️
⚠️ RED FLAGS: 2 identified
- Increasing Shorts
- High Price to Book vs ROE
Income Statement
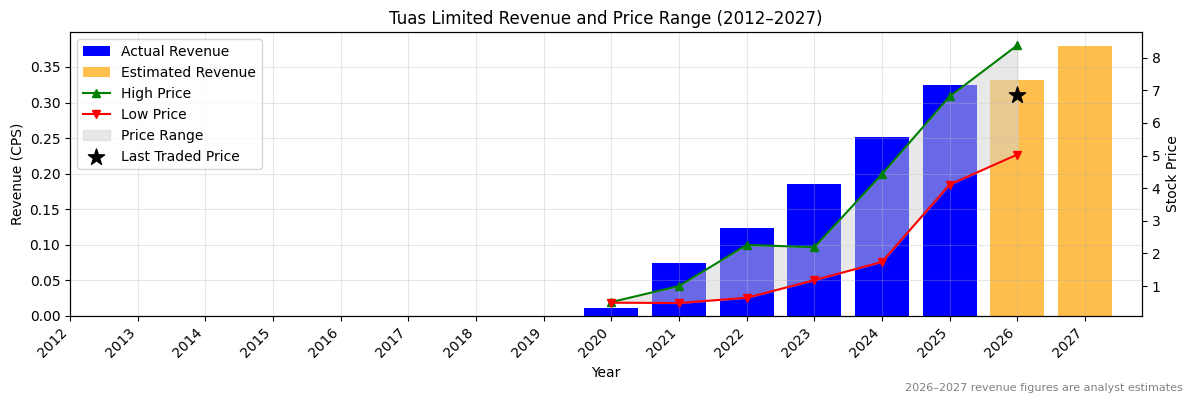
| Revenue 2024 Per Share |
Revenue 2025e Per Share |
Revenue 2026e Per Share |
Revenue 24 to 25e [%] |
Revenue 25e to 26e [%] |
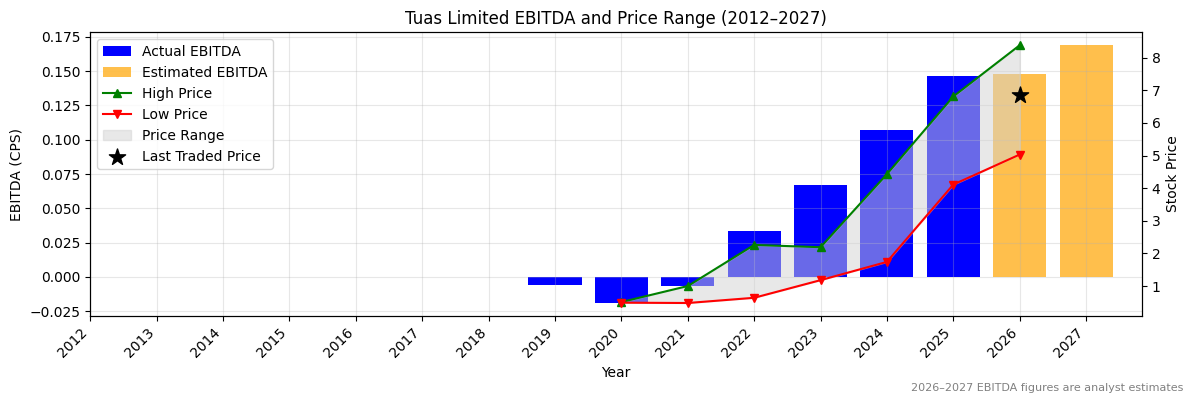
EBITDA 2024 Per Share |
EBITDA 2025e Per Share |
EBITDA 2026e Per Share |
EBITDA 24 to 25e [%] |
EBITDA 25e to 26e [%] |
| 0.25132 |
0.32439 |
0.33216 |
29.1 |
2.4 |
0.10678 |
0.14625 |
0.14807 |
37.0 |
1.2 |
TUA Revenue Per Share (2012–2027)
✅✅
TUA Earnings before Interest, Tax, Depreciation and Amortisation (EBITDA) Per Share (2012–2027)
✅✅
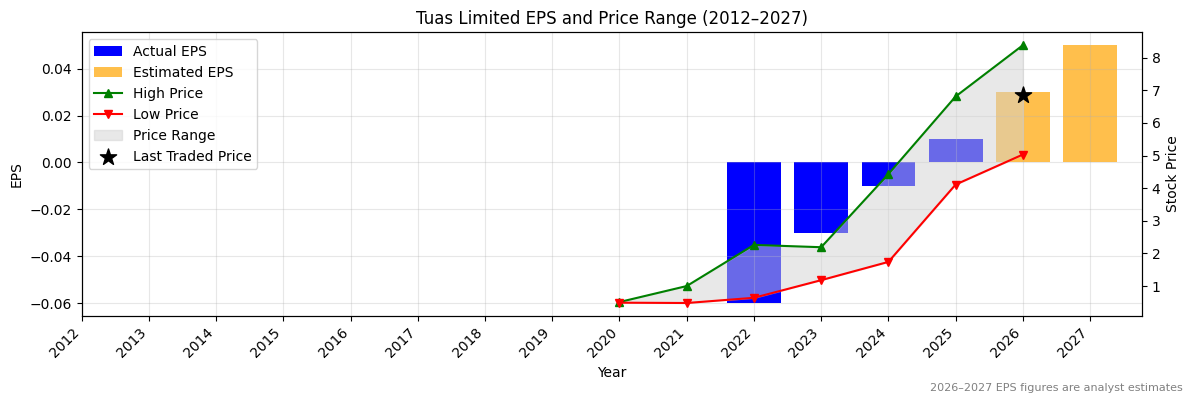
TUA Normalised Earnings Per Share (EPS) (2012–2027)
✅✅
Valuation
| Price To Sales |
Price To Book |
PER 2023 |
PER 2024 |
13Y Median PER Low |
PER 2025e |
13Y Median PER High |
PER 2026e |
Last Updated |
| 25.4 |
7.4 |
-234.3 |
-703.0 |
289.3 |
703.0 |
480.1 |
234.3 |
4/10/25 |
TUA Yearly Price Earnings Ratio (PER) Highs and Lows
❌
TUA Weekly Price Chart with Average True Range (ATR) Trailing Stop (10-Year View)
Ticker code: TTT
TTT Red Flags & Risk Indicators
❌
⚠️ RED FLAGS: 8 identified
- Negative Operating Cash Flow
- Large Share Issuance
- Low Operating Margin
- Falling Earnings
- Falling Revenues
- High Price to Book vs ROE
- Risk Of Capital Raise
- Falling EBITDA Margins
Income Statement
| Revenue 2024 Per Share |
Revenue 2025e Per Share |
Revenue 2026e Per Share |
Revenue 24 to 25e [%] |
Revenue 25e to 26e [%] |
EBITDA 2024 Per Share |
EBITDA 2025e Per Share |
EBITDA 2026e Per Share |
EBITDA 24 to 25e [%] |
EBITDA 25e to 26e [%] |
| 0.00736 |
0.00553 |
0.01496 |
-24.9 |
170.6 |
-0.00475 |
-0.01109 |
-0.00078 |
-133.4 |
93.0 |
TTT Revenue Per Share (2012–2027)
❌
TTT Earnings before Interest, Tax, Depreciation and Amortisation (EBITDA) Per Share (2012–2027)
❌
TTT Normalised Earnings Per Share (EPS) (2012–2027)
Valuation
| Price To Sales |
Price To Book |
PER 2023 |
PER 2024 |
13Y Median PER Low |
PER 2025e |
13Y Median PER High |
PER 2026e |
Last Updated |
| 45.7 |
25.5 |
-4.7 |
None |
None |
-28.0 |
None |
None |
19/4/25 |
TTT Yearly Price Earnings Ratio (PER) Highs and Lows
TTT Weekly Price Chart with Average True Range (ATR) Trailing Stop (10-Year View)
Ticker code: ASX:TTT
ASX:TTT Red Flags & Risk Indicators
❌
⚠️ RED FLAGS: 7 identified
- Negative Operating Cash Flow
- Large Share Issuance
- Low Operating Margin
- Falling Revenues
- High Price to Book vs ROE
- Risk Of Capital Raise
- Falling EBITDA Margins
Income Statement
| Revenue 2024 Per Share |
Revenue 2025e Per Share |
Revenue 2026e Per Share |
Revenue 24 to 25e [%] |
Revenue 25e to 26e [%] |
EBITDA 2024 Per Share |
EBITDA 2025e Per Share |
EBITDA 2026e Per Share |
EBITDA 24 to 25e [%] |
EBITDA 25e to 26e [%] |
| 0.00736 |
0.00557 |
0.01507 |
-24.3 |
170.6 |
-0.00475 |
-0.01109 |
-0.00079 |
-133.4 |
92.9 |
ASX:TTT Revenue Per Share (2012–2027)
❌
ASX:TTT Earnings before Interest, Tax, Depreciation and Amortisation (EBITDA) Per Share (2012–2027)
❌
ASX:TTT Normalised Earnings Per Share (EPS) (2012–2027)
Valuation
| Price To Sales |
Price To Book |
PER 2023 |
PER 2024 |
13Y Median PER Low |
PER 2025e |
13Y Median PER High |
PER 2026e |
Last Updated |
| 40.5 |
22.7 |
-4.2 |
None |
None |
-25.0 |
None |
None |
19/4/25 |
ASX:TTT Yearly Price Earnings Ratio (PER) Highs and Lows
ASX:TTT Weekly Price Chart with Average True Range (ATR) Trailing Stop (10-Year View)
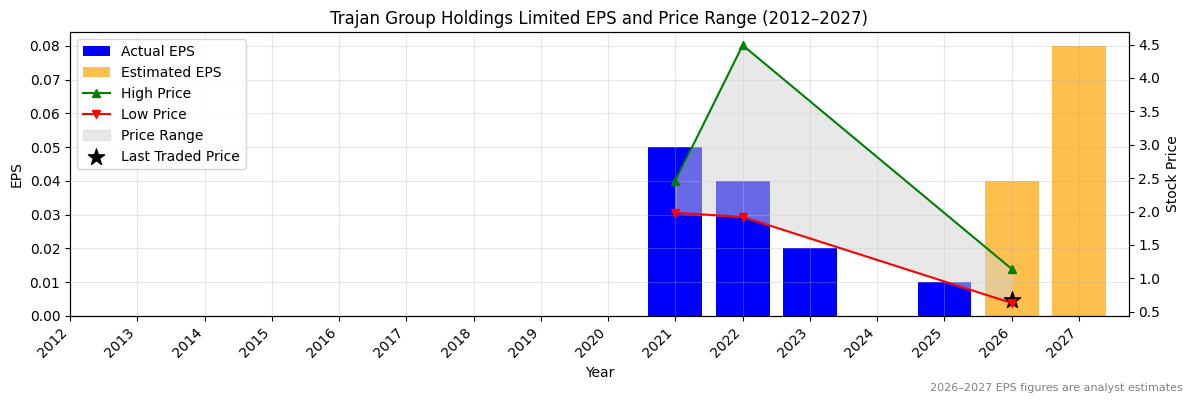
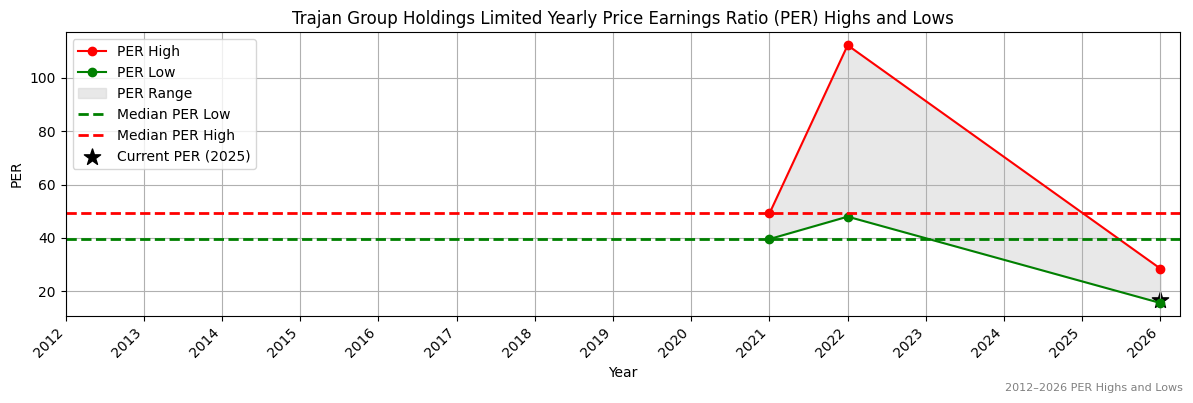
Ticker code: TRJ
TRJ Red Flags & Risk Indicators
✅
⚠️ RED FLAGS: 0 identified
No red flags detected.
Income Statement
| Revenue 2024 Per Share |
Revenue 2025e Per Share |
Revenue 2026e Per Share |
Revenue 24 to 25e [%] |
Revenue 25e to 26e [%] |
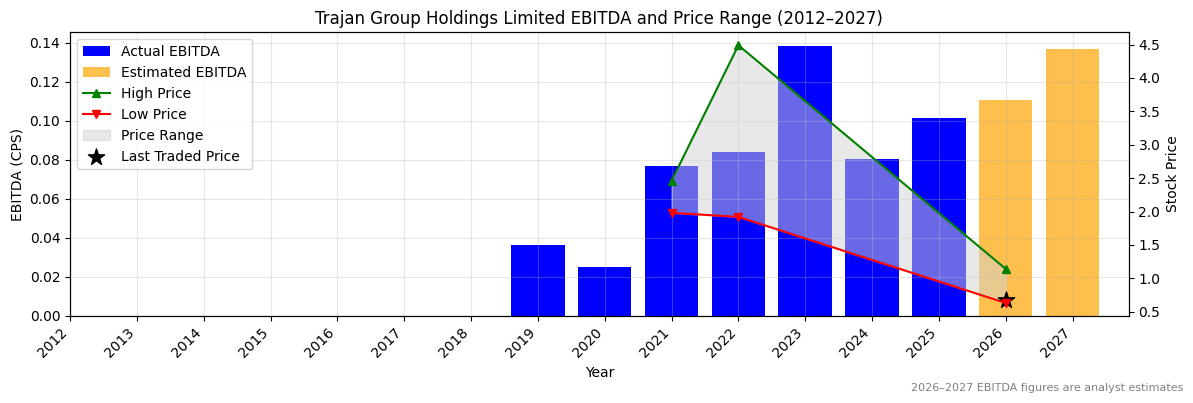
EBITDA 2024 Per Share |
EBITDA 2025e Per Share |
EBITDA 2026e Per Share |
EBITDA 24 to 25e [%] |
EBITDA 25e to 26e [%] |
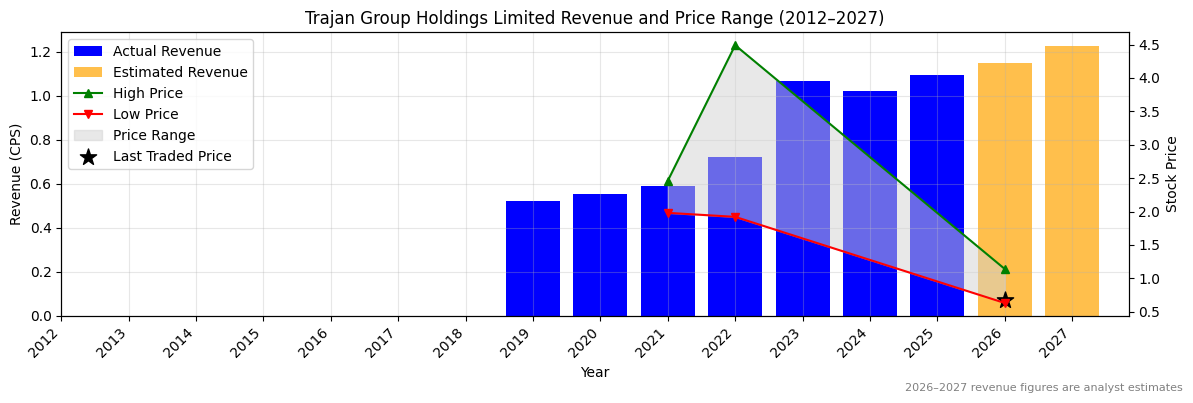
| 1.01853 |
1.09286 |
1.14927 |
7.3 |
5.2 |
0.08055 |
0.10144 |
0.11079 |
25.9 |
9.2 |
TRJ Revenue Per Share (2012–2027)
✅
TRJ Earnings before Interest, Tax, Depreciation and Amortisation (EBITDA) Per Share (2012–2027)
✅✅
TRJ Normalised Earnings Per Share (EPS) (2012–2027)
✅✅
Valuation
| Price To Sales |
Price To Book |
PER 2023 |
PER 2024 |
13Y Median PER Low |
PER 2025e |
13Y Median PER High |
PER 2026e |
Last Updated |
| 0.7 |
1.1 |
39.3 |
None |
39.6 |
78.5 |
49.2 |
19.6 |
20/10/25 |
TRJ Yearly Price Earnings Ratio (PER) Highs and Lows
❌
TRJ Weekly Price Chart with Average True Range (ATR) Trailing Stop (10-Year View)
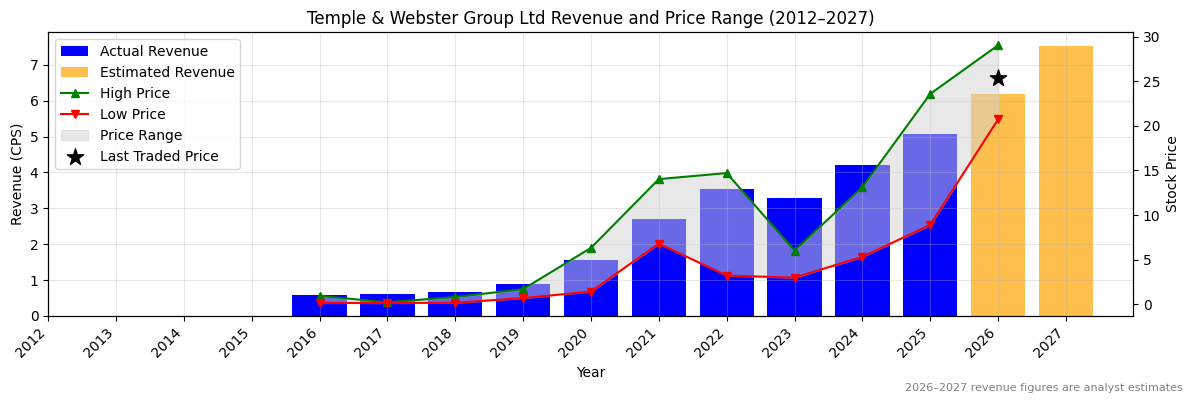
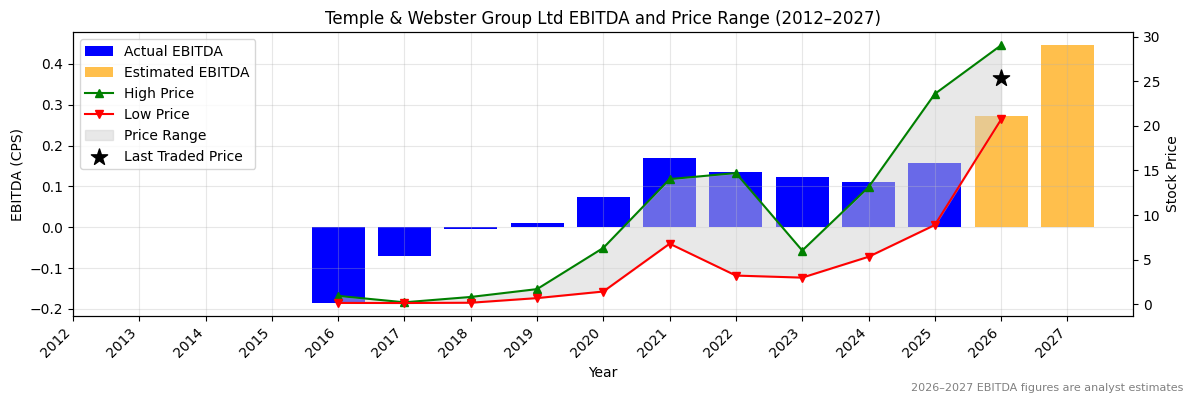
Ticker code: TPW
TPW Red Flags & Risk Indicators
⚠️
⚠️ RED FLAGS: 2 identified
- Falling Earnings
- High Relative Valuation
Income Statement
| Revenue 2024 Per Share |
Revenue 2025e Per Share |
Revenue 2026e Per Share |
Revenue 24 to 25e [%] |
Revenue 25e to 26e [%] |
EBITDA 2024 Per Share |
EBITDA 2025e Per Share |
EBITDA 2026e Per Share |
EBITDA 24 to 25e [%] |
EBITDA 25e to 26e [%] |
| 4.19765 |
5.06509 |
6.19739 |
20.7 |
22.4 |
0.11062 |
0.15843 |
0.27329 |
43.2 |
72.5 |
TPW Revenue Per Share (2012–2027)
✅✅
TPW Earnings before Interest, Tax, Depreciation and Amortisation (EBITDA) Per Share (2012–2027)
✅✅
TPW Normalised Earnings Per Share (EPS) (2012–2027)
✅✅
Valuation
| Price To Sales |
Price To Book |
PER 2023 |
PER 2024 |
13Y Median PER Low |
PER 2025e |
13Y Median PER High |
PER 2026e |
Last Updated |
| 4.8 |
19.1 |
340.1 |
2,381.0 |
64.3 |
264.6 |
157.6 |
158.7 |
4/10/25 |
TPW Yearly Price Earnings Ratio (PER) Highs and Lows
❌
TPW Weekly Price Chart with Average True Range (ATR) Trailing Stop (10-Year View)
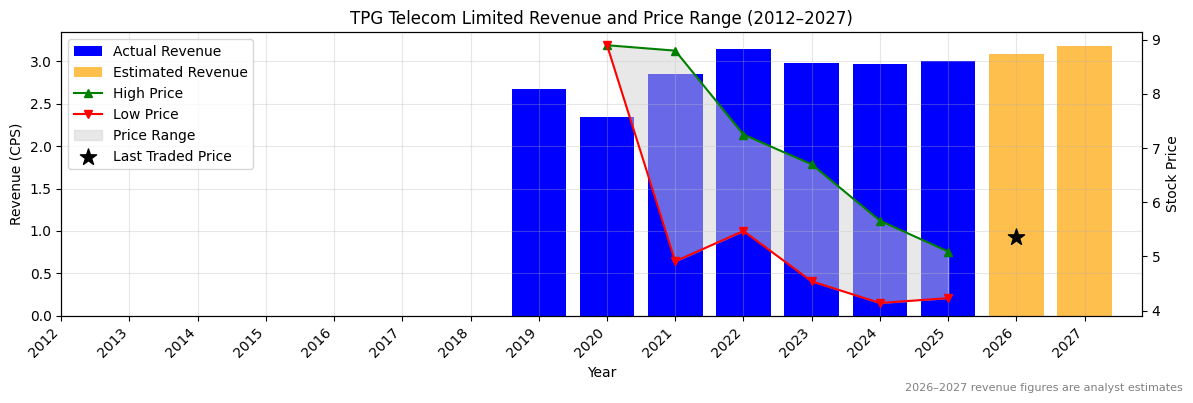
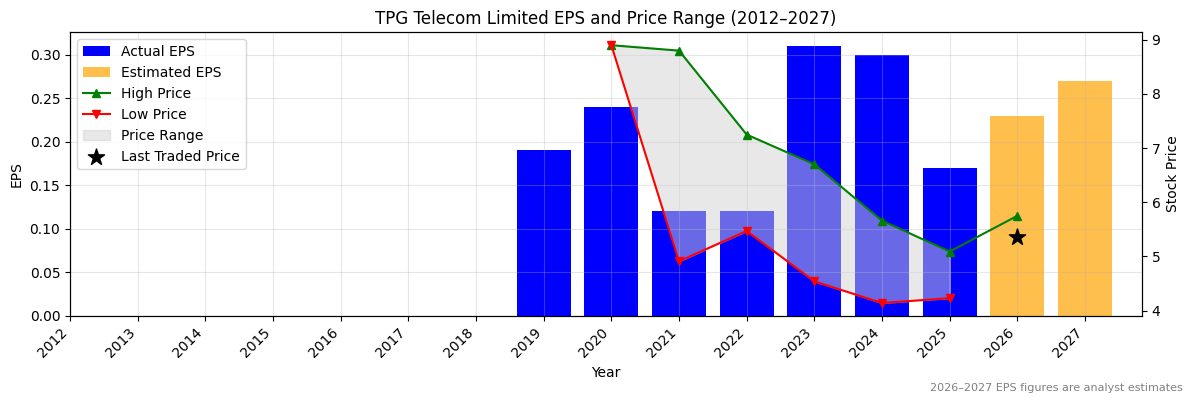
Ticker code: TPG
TPG Red Flags & Risk Indicators
⚠️
⚠️ RED FLAGS: 2 identified
- Falling Earnings
- Falling Revenues
Income Statement
| Revenue 2024 Per Share |
Revenue 2025e Per Share |
Revenue 2026e Per Share |
Revenue 24 to 25e [%] |
Revenue 25e to 26e [%] |
EBITDA 2024 Per Share |
EBITDA 2025e Per Share |
EBITDA 2026e Per Share |
EBITDA 24 to 25e [%] |
EBITDA 25e to 26e [%] |
| 2.96886 |
3.00011 |
3.08555 |
1.1 |
2.8 |
0.92078 |
1.06914 |
1.14013 |
16.1 |
6.6 |
TPG Revenue Per Share (2012–2027)
✅
TPG Earnings before Interest, Tax, Depreciation and Amortisation (EBITDA) Per Share (2012–2027)
✅
TPG Normalised Earnings Per Share (EPS) (2012–2027)
❌
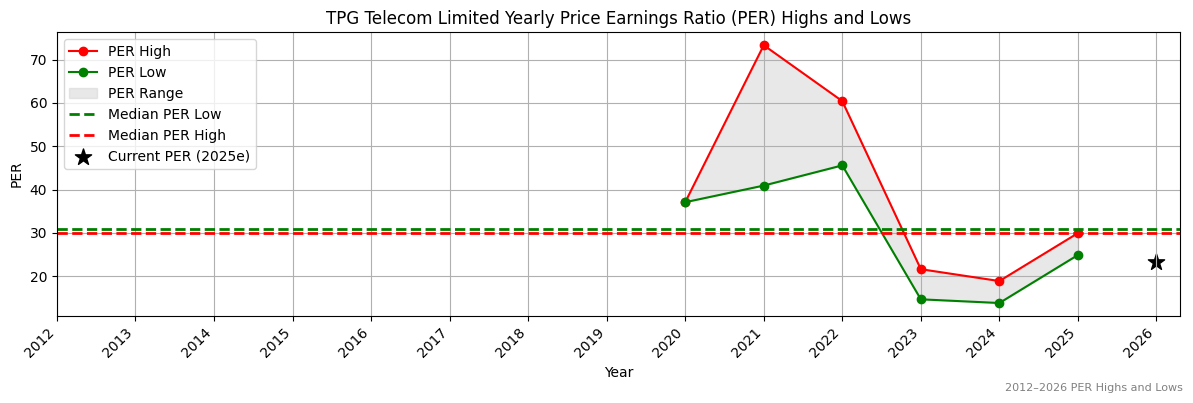
Valuation
| Price To Sales |
Price To Book |
PER 2023 |
PER 2024 |
13Y Median PER Low |
PER 2025e |
13Y Median PER High |
PER 2026e |
Last Updated |
| 1.8 |
0.9 |
17.8 |
18.4 |
31.0 |
32.5 |
29.9 |
24.0 |
21/3/25 |
TPG Yearly Price Earnings Ratio (PER) Highs and Lows
❌
TPG Weekly Price Chart with Average True Range (ATR) Trailing Stop (10-Year View)
Ticker code: TOT
TOT Red Flags & Risk Indicators
✅
⚠️ RED FLAGS: 0 identified
No red flags detected.
Income Statement
| Revenue 2024 Per Share |
Revenue 2025e Per Share |
Revenue 2026e Per Share |
Revenue 24 to 25e [%] |
Revenue 25e to 26e [%] |
EBITDA 2024 Per Share |
EBITDA 2025e Per Share |
EBITDA 2026e Per Share |
EBITDA 24 to 25e [%] |
EBITDA 25e to 26e [%] |
| None |
None |
None |
None |
None |
None |
None |
None |
None |
None |
TOT Revenue Per Share (2012–2027)
TOT Earnings before Interest, Tax, Depreciation and Amortisation (EBITDA) Per Share (2012–2027)
TOT Normalised Earnings Per Share (EPS) (2012–2027)
Valuation
| Price To Sales |
Price To Book |
PER 2023 |
PER 2024 |
13Y Median PER Low |
PER 2025e |
13Y Median PER High |
PER 2026e |
Last Updated |
| 6.0 |
0.7 |
None |
None |
None |
None |
None |
None |
None |
TOT Yearly Price Earnings Ratio (PER) Highs and Lows
TOT Weekly Price Chart with Average True Range (ATR) Trailing Stop (10-Year View)
Ticker code: TNE
TNE Red Flags & Risk Indicators
⚠️
⚠️ RED FLAGS: 1 identified
Income Statement
| Revenue 2024 Per Share |
Revenue 2025e Per Share |
Revenue 2026e Per Share |
Revenue 24 to 25e [%] |
Revenue 25e to 26e [%] |
EBITDA 2024 Per Share |
EBITDA 2025e Per Share |
EBITDA 2026e Per Share |
EBITDA 24 to 25e [%] |
EBITDA 25e to 26e [%] |
| 1.55468 |
1.82058 |
2.0918 |
17.1 |
14.9 |
0.66191 |
0.78571 |
0.92648 |
18.7 |
17.9 |
TNE Revenue Per Share (2012–2027)
✅
TNE Earnings before Interest, Tax, Depreciation and Amortisation (EBITDA) Per Share (2012–2027)
✅
TNE Normalised Earnings Per Share (EPS) (2012–2027)
✅
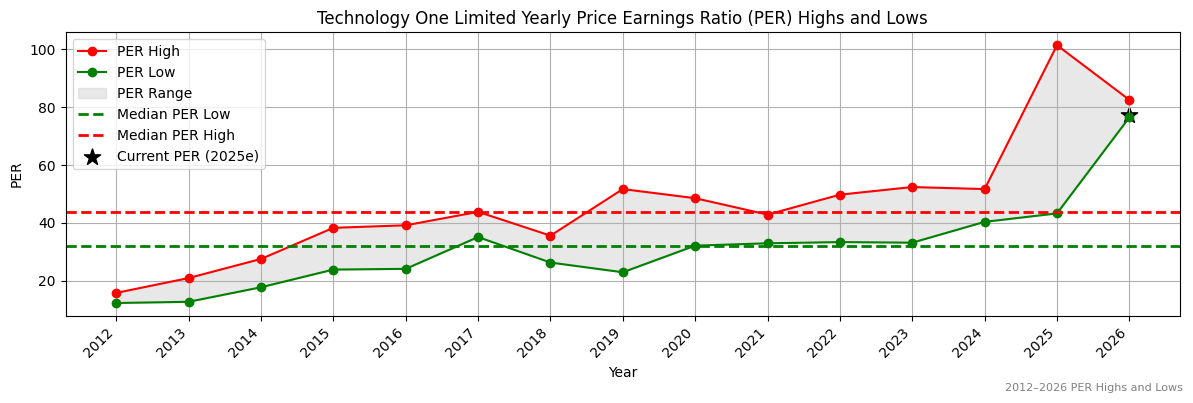
Valuation
| Price To Sales |
Price To Book |
PER 2023 |
PER 2024 |
13Y Median PER Low |
PER 2025e |
13Y Median PER High |
PER 2026e |
Last Updated |
| 21.9 |
29.0 |
115.3 |
102.5 |
32.1 |
87.9 |
43.8 |
73.8 |
11/10/25 |
TNE Yearly Price Earnings Ratio (PER) Highs and Lows
❌
TNE Weekly Price Chart with Average True Range (ATR) Trailing Stop (10-Year View)
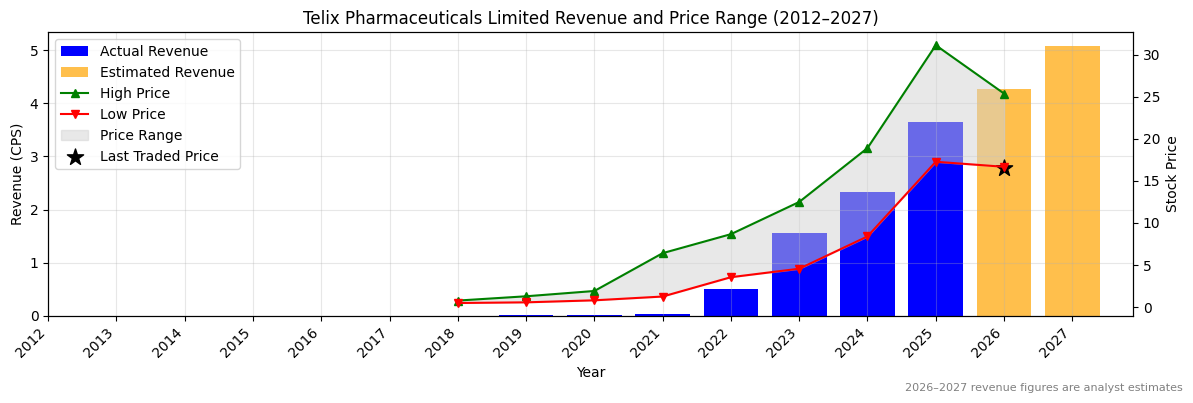
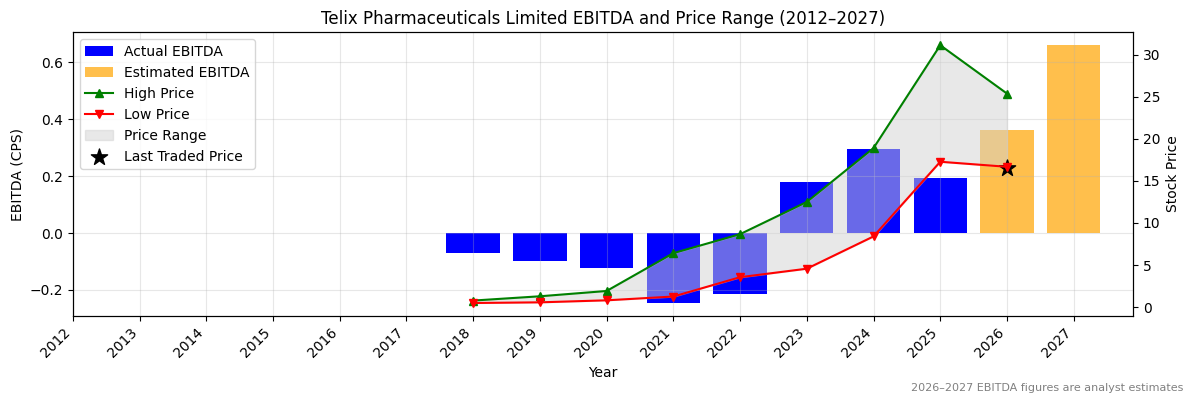
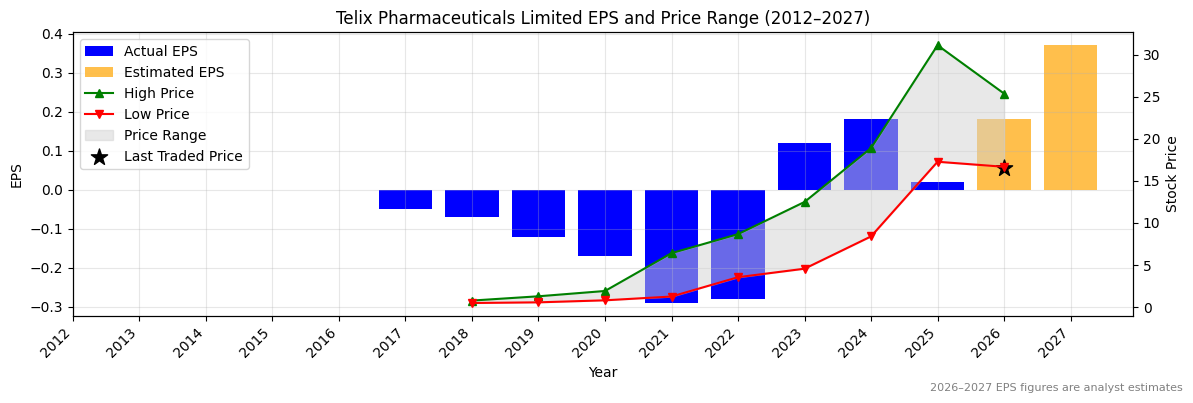
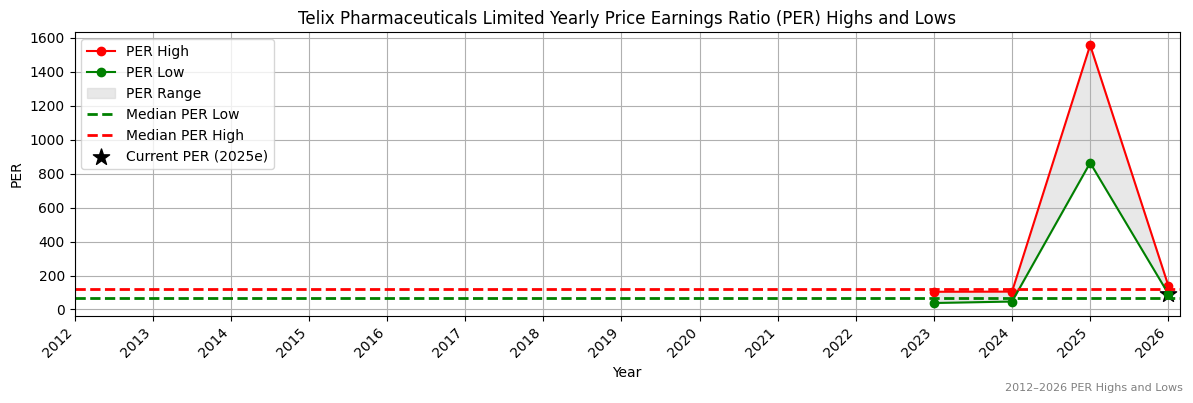
Ticker code: TLX
TLX Red Flags & Risk Indicators
❌
⚠️ RED FLAGS: 6 identified
- Low Operating Margin
- Highly Shorted
- Increasing Shorts
- Falling Earnings
- High Price to Book vs ROE
- Falling EBITDA Margins
Income Statement
| Revenue 2024 Per Share |
Revenue 2025e Per Share |
Revenue 2026e Per Share |
Revenue 24 to 25e [%] |
Revenue 25e to 26e [%] |
EBITDA 2024 Per Share |
EBITDA 2025e Per Share |
EBITDA 2026e Per Share |
EBITDA 24 to 25e [%] |
EBITDA 25e to 26e [%] |
| 2.34004 |
3.65545 |
4.27444 |
56.2 |
16.9 |
0.29662 |
0.19301 |
0.3611 |
-34.9 |
87.1 |
TLX Revenue Per Share (2012–2027)
✅✅
TLX Earnings before Interest, Tax, Depreciation and Amortisation (EBITDA) Per Share (2012–2027)
❌
TLX Normalised Earnings Per Share (EPS) (2012–2027)
❌
Valuation
| Price To Sales |
Price To Book |
PER 2023 |
PER 2024 |
13Y Median PER Low |
PER 2025e |
13Y Median PER High |
PER 2026e |
Last Updated |
| 8.1 |
12.9 |
134.0 |
89.3 |
69.7 |
804.0 |
123.1 |
89.3 |
11/10/25 |
TLX Yearly Price Earnings Ratio (PER) Highs and Lows
❌
TLX Weekly Price Chart with Average True Range (ATR) Trailing Stop (10-Year View)
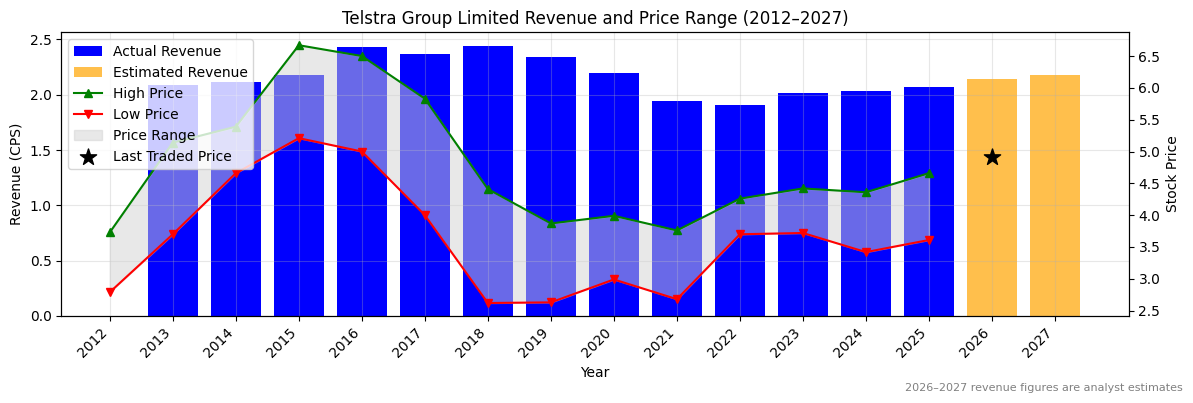
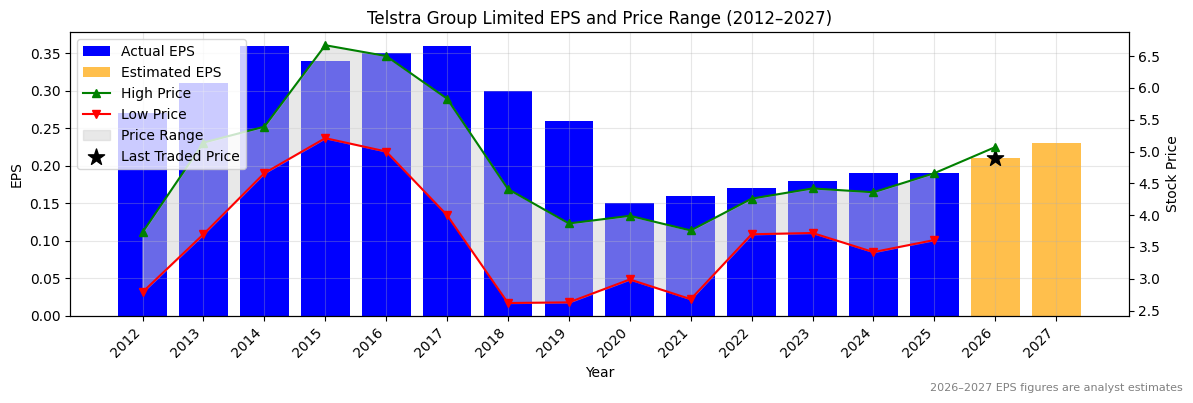
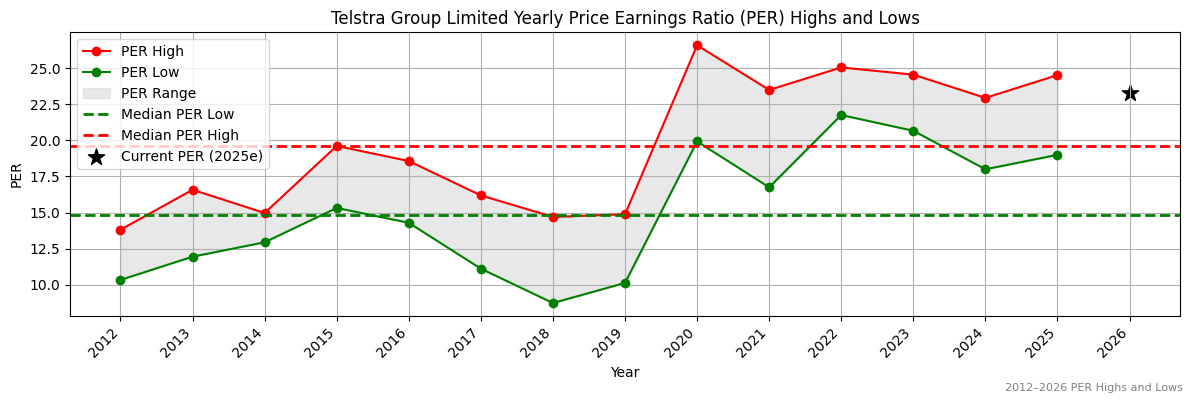
Ticker code: TLS
TLS Red Flags & Risk Indicators
⚠️
⚠️ RED FLAGS: 2 identified
- More Net Debt Than Equity
- High Relative Valuation
Income Statement
| Revenue 2024 Per Share |
Revenue 2025e Per Share |
Revenue 2026e Per Share |
Revenue 24 to 25e [%] |
Revenue 25e to 26e [%] |
EBITDA 2024 Per Share |
EBITDA 2025e Per Share |
EBITDA 2026e Per Share |
EBITDA 24 to 25e [%] |
EBITDA 25e to 26e [%] |
| 2.03229 |
2.06856 |
2.14226 |
1.8 |
3.6 |
0.65153 |
0.7517 |
0.79212 |
15.4 |
5.4 |
TLS Revenue Per Share (2012–2027)
✅
TLS Earnings before Interest, Tax, Depreciation and Amortisation (EBITDA) Per Share (2012–2027)
✅
TLS Normalised Earnings Per Share (EPS) (2012–2027)
❌
Valuation
| Price To Sales |
Price To Book |
PER 2023 |
PER 2024 |
13Y Median PER Low |
PER 2025e |
13Y Median PER High |
PER 2026e |
Last Updated |
| 2.4 |
4.0 |
27.1 |
25.7 |
14.8 |
25.7 |
19.6 |
23.2 |
22/7/25 |
TLS Yearly Price Earnings Ratio (PER) Highs and Lows
❌
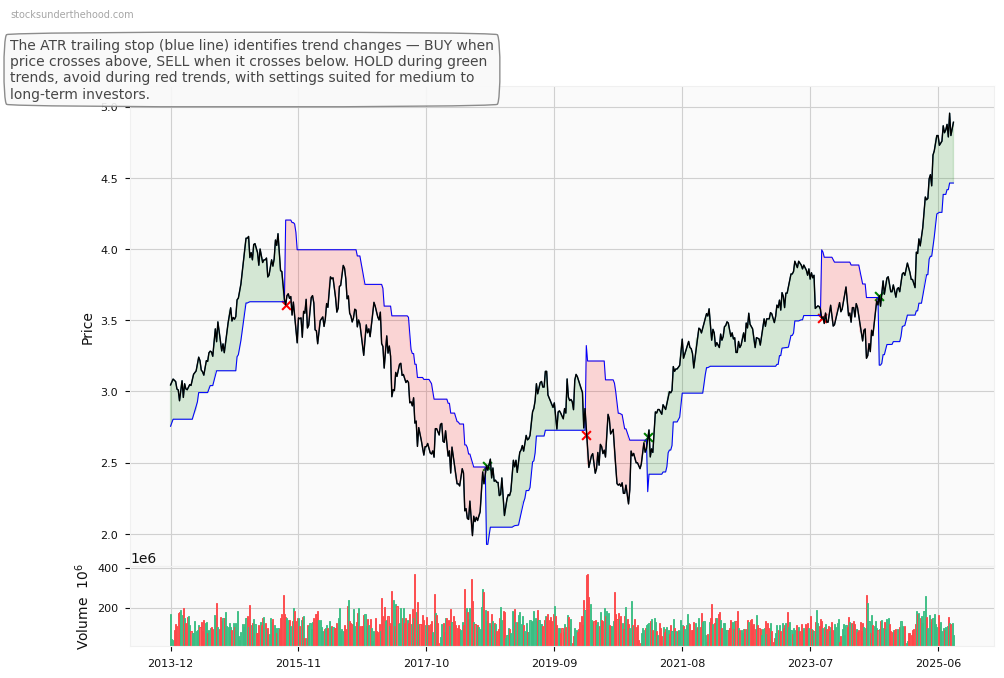
TLS Weekly Price Chart with Average True Range (ATR) Trailing Stop (10-Year View)
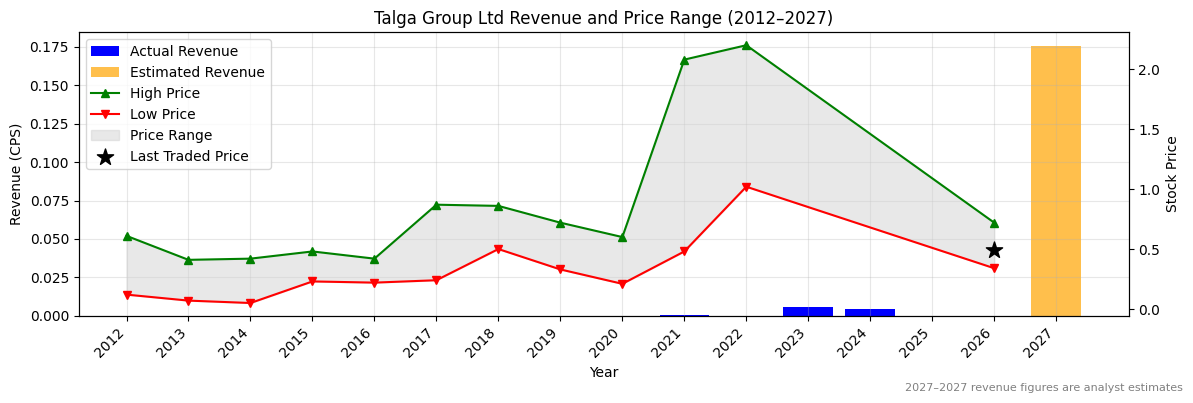
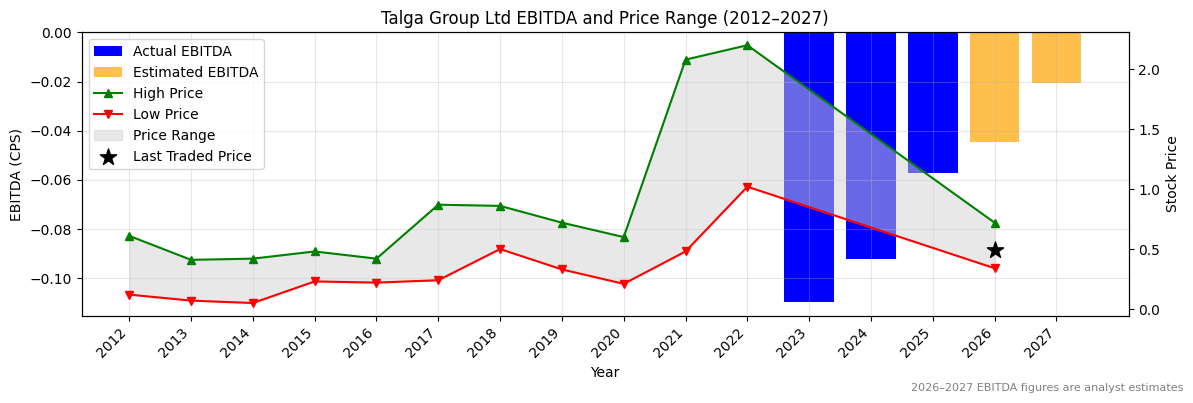
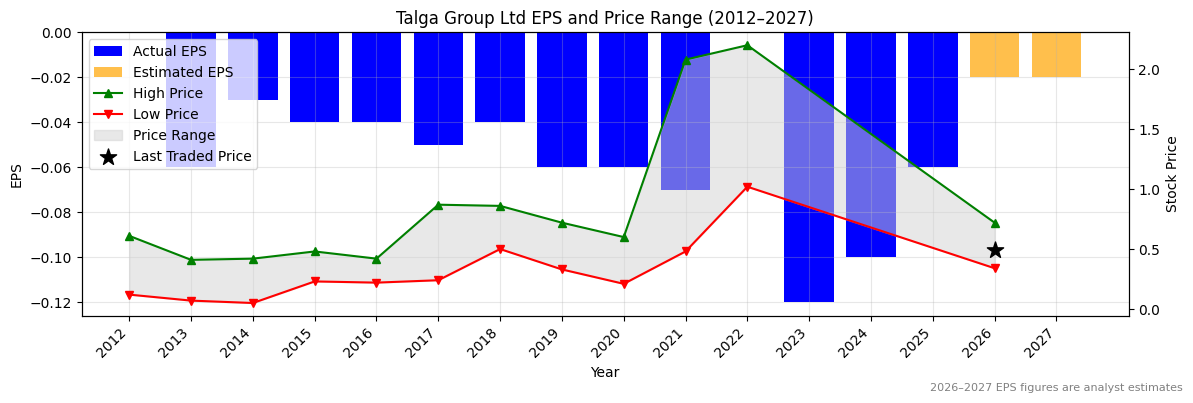
Ticker code: TLG
TLG Red Flags & Risk Indicators
❌
⚠️ RED FLAGS: 6 identified
- Negative Operating Cash Flow
- Low Operating Margin
- Falling Earnings
- Falling Revenues
- High Price to Book vs ROE
- Risk Of Capital Raise
Income Statement
| Revenue 2024 Per Share |
Revenue 2025e Per Share |
Revenue 2026e Per Share |
Revenue 24 to 25e [%] |
Revenue 25e to 26e [%] |
EBITDA 2024 Per Share |
EBITDA 2025e Per Share |
EBITDA 2026e Per Share |
EBITDA 24 to 25e [%] |
EBITDA 25e to 26e [%] |
| 0.00416 |
None |
None |
None |
None |
-0.09203 |
-0.05697 |
-0.04464 |
38.1 |
21.6 |
TLG Revenue Per Share (2012–2027)
TLG Earnings before Interest, Tax, Depreciation and Amortisation (EBITDA) Per Share (2012–2027)
✅✅
TLG Normalised Earnings Per Share (EPS) (2012–2027)
✅✅
Valuation
| Price To Sales |
Price To Book |
PER 2023 |
PER 2024 |
13Y Median PER Low |
PER 2025e |
13Y Median PER High |
PER 2026e |
Last Updated |
| 2062.9 |
4.9 |
-4.0 |
-4.8 |
None |
-8.0 |
None |
-24.0 |
18/7/25 |
TLG Yearly Price Earnings Ratio (PER) Highs and Lows
TLG Weekly Price Chart with Average True Range (ATR) Trailing Stop (10-Year View)
Ticker code: TLC
TLC Red Flags & Risk Indicators
❌
⚠️ RED FLAGS: 4 identified
- Increasing Shorts
- Falling Earnings
- Falling Revenues
- More Net Debt Than Equity
Income Statement
| Revenue 2024 Per Share |
Revenue 2025e Per Share |
Revenue 2026e Per Share |
Revenue 24 to 25e [%] |
Revenue 25e to 26e [%] |
EBITDA 2024 Per Share |
EBITDA 2025e Per Share |
EBITDA 2026e Per Share |
EBITDA 24 to 25e [%] |
EBITDA 25e to 26e [%] |
| 1.79558 |
1.68089 |
1.80369 |
-6.4 |
7.3 |
0.3716 |
0.33956 |
0.37394 |
-8.6 |
10.1 |
TLC Revenue Per Share (2012–2027)
❌
TLC Earnings before Interest, Tax, Depreciation and Amortisation (EBITDA) Per Share (2012–2027)
❌
TLC Normalised Earnings Per Share (EPS) (2012–2027)
❌
Valuation
| Price To Sales |
Price To Book |
PER 2023 |
PER 2024 |
13Y Median PER Low |
PER 2025e |
13Y Median PER High |
PER 2026e |
Last Updated |
| 3.3 |
37.9 |
36.7 |
28.9 |
26.1 |
34.4 |
31.6 |
28.9 |
29/3/25 |
TLC Yearly Price Earnings Ratio (PER) Highs and Lows
❌
TLC Weekly Price Chart with Average True Range (ATR) Trailing Stop (10-Year View)
Ticker code: TEA
TEA Red Flags & Risk Indicators
⚠️
⚠️ RED FLAGS: 1 identified
Income Statement
| Revenue 2024 Per Share |
Revenue 2025e Per Share |
Revenue 2026e Per Share |
Revenue 24 to 25e [%] |
Revenue 25e to 26e [%] |
EBITDA 2024 Per Share |
EBITDA 2025e Per Share |
EBITDA 2026e Per Share |
EBITDA 24 to 25e [%] |
EBITDA 25e to 26e [%] |
| 1.81823 |
2.25385 |
2.82515 |
24.0 |
25.3 |
0.297 |
0.44718 |
0.51497 |
50.6 |
15.2 |
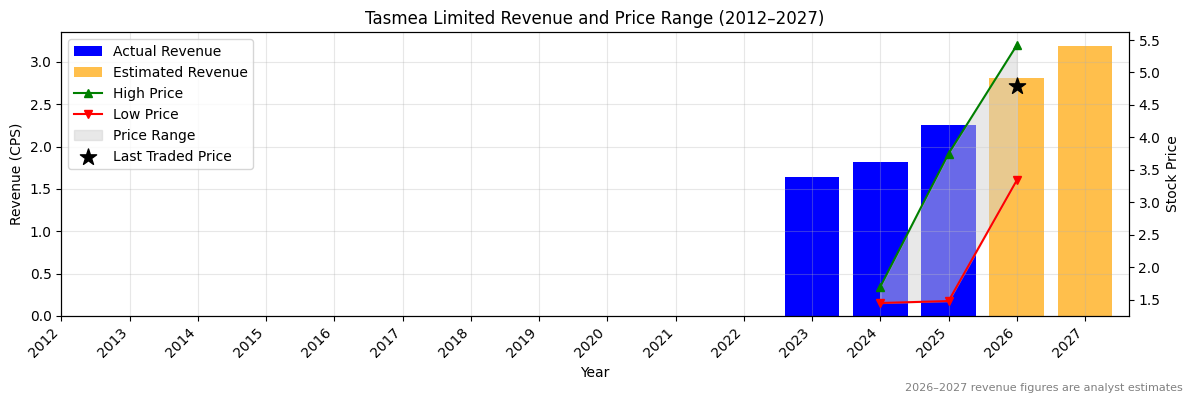
TEA Revenue Per Share (2012–2027)
✅✅
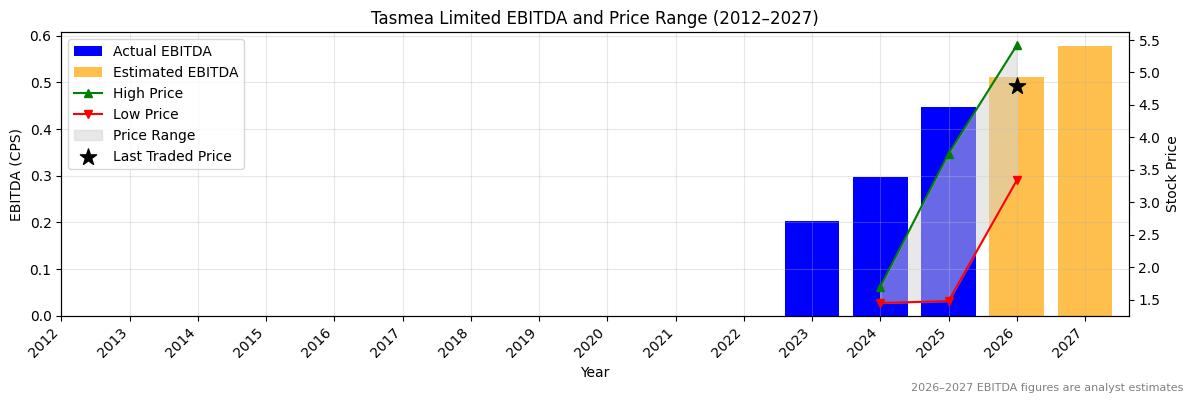
TEA Earnings before Interest, Tax, Depreciation and Amortisation (EBITDA) Per Share (2012–2027)
✅✅
TEA Normalised Earnings Per Share (EPS) (2012–2027)
✅✅
Valuation
| Price To Sales |
Price To Book |
PER 2023 |
PER 2024 |
13Y Median PER Low |
PER 2025e |
13Y Median PER High |
PER 2026e |
Last Updated |
| 2.3 |
6.6 |
50.6 |
28.1 |
8.1 |
18.7 |
13.9 |
17.4 |
4/10/25 |
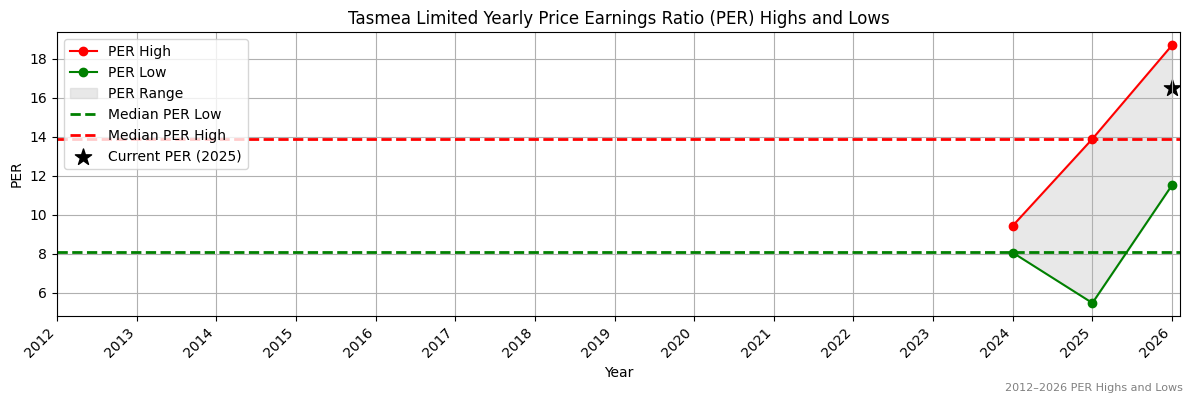
TEA Yearly Price Earnings Ratio (PER) Highs and Lows
❌
TEA Weekly Price Chart with Average True Range (ATR) Trailing Stop (10-Year View)
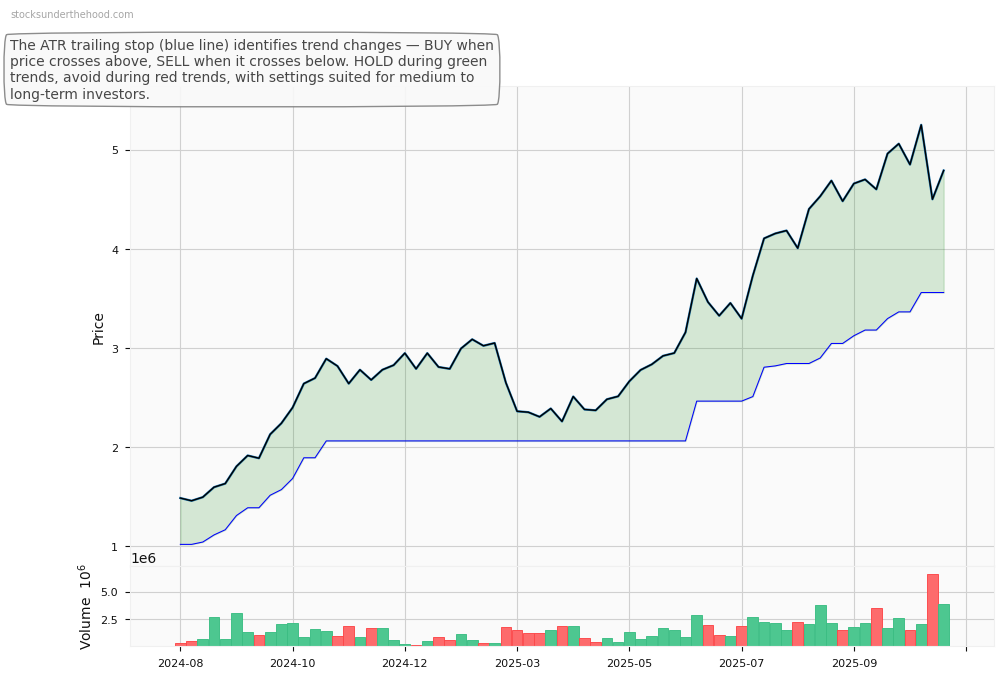
Ticker code: TCL
TCL Red Flags & Risk Indicators
❌
⚠️ RED FLAGS: 4 identified
- Increasing Shorts
- Falling Earnings
- More Net Debt Than Equity
- High Price to Book vs ROE
Income Statement
| Revenue 2024 Per Share |
Revenue 2025e Per Share |
Revenue 2026e Per Share |
Revenue 24 to 25e [%] |
Revenue 25e to 26e [%] |
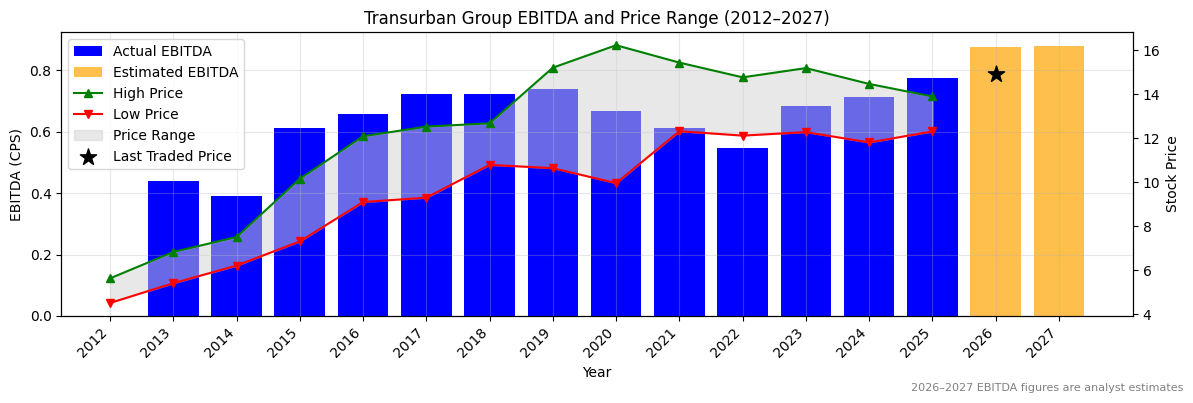
EBITDA 2024 Per Share |
EBITDA 2025e Per Share |
EBITDA 2026e Per Share |
EBITDA 24 to 25e [%] |
EBITDA 25e to 26e [%] |
| 1.34436 |
1.33207 |
1.325 |
-0.9 |
-0.5 |
0.7118 |
0.77629 |
0.87569 |
9.1 |
12.8 |
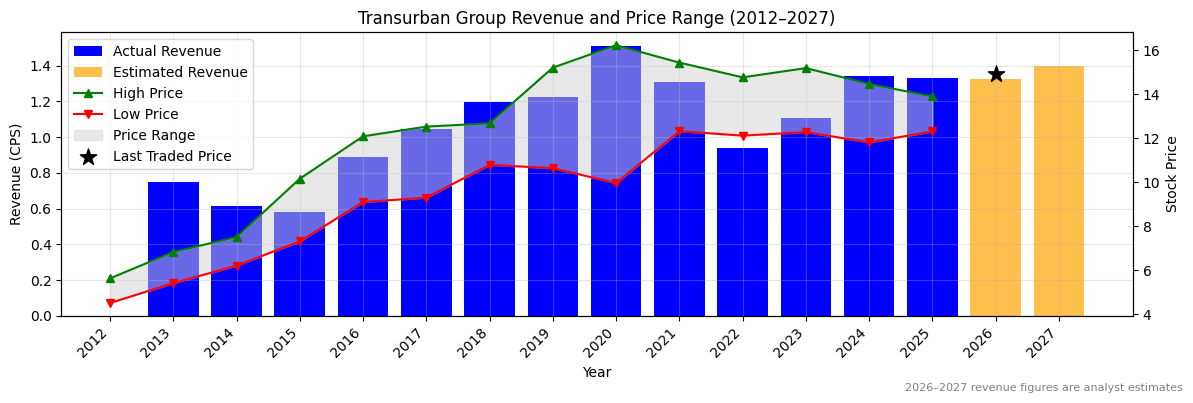
TCL Revenue Per Share (2012–2027)
❌
TCL Earnings before Interest, Tax, Depreciation and Amortisation (EBITDA) Per Share (2012–2027)
✅
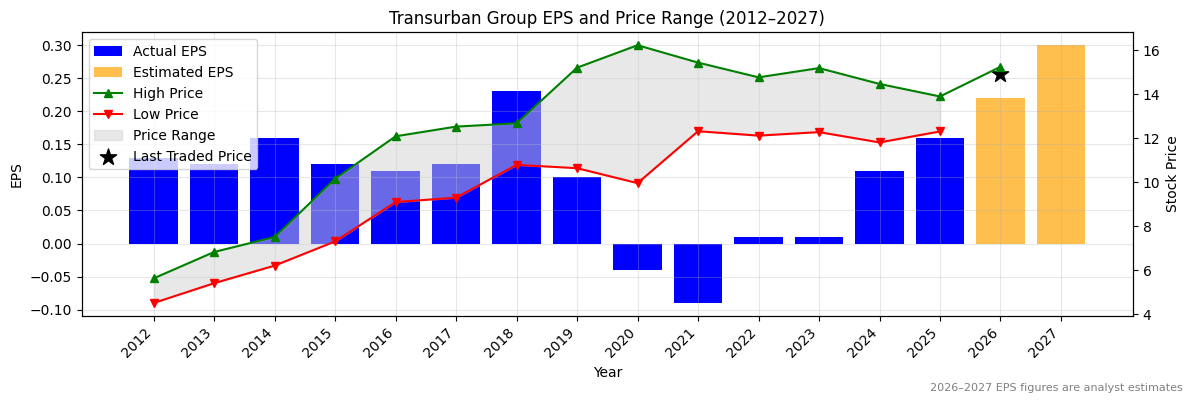
TCL Normalised Earnings Per Share (EPS) (2012–2027)
✅✅
Valuation
| Price To Sales |
Price To Book |
PER 2023 |
PER 2024 |
13Y Median PER Low |
PER 2025e |
13Y Median PER High |
PER 2026e |
Last Updated |
| 12.0 |
4.9 |
1,448.0 |
131.6 |
77.2 |
90.5 |
86.9 |
65.8 |
9/11/24 |
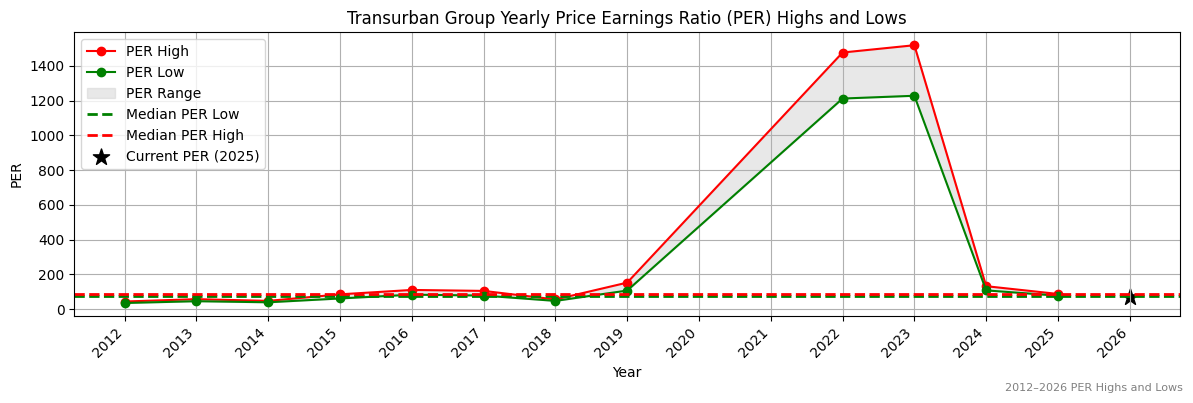
TCL Yearly Price Earnings Ratio (PER) Highs and Lows
❌
TCL Weekly Price Chart with Average True Range (ATR) Trailing Stop (10-Year View)
Ticker code: TAH
TAH Red Flags & Risk Indicators
⚠️
⚠️ RED FLAGS: 1 identified
Income Statement
| Revenue 2024 Per Share |
Revenue 2025e Per Share |
Revenue 2026e Per Share |
Revenue 24 to 25e [%] |
Revenue 25e to 26e [%] |
EBITDA 2024 Per Share |
EBITDA 2025e Per Share |
EBITDA 2026e Per Share |
EBITDA 24 to 25e [%] |
EBITDA 25e to 26e [%] |
| 1.02419 |
1.14492 |
1.17371 |
11.8 |
2.5 |
0.13912 |
0.17144 |
0.18193 |
23.2 |
6.1 |
TAH Revenue Per Share (2012–2027)
✅
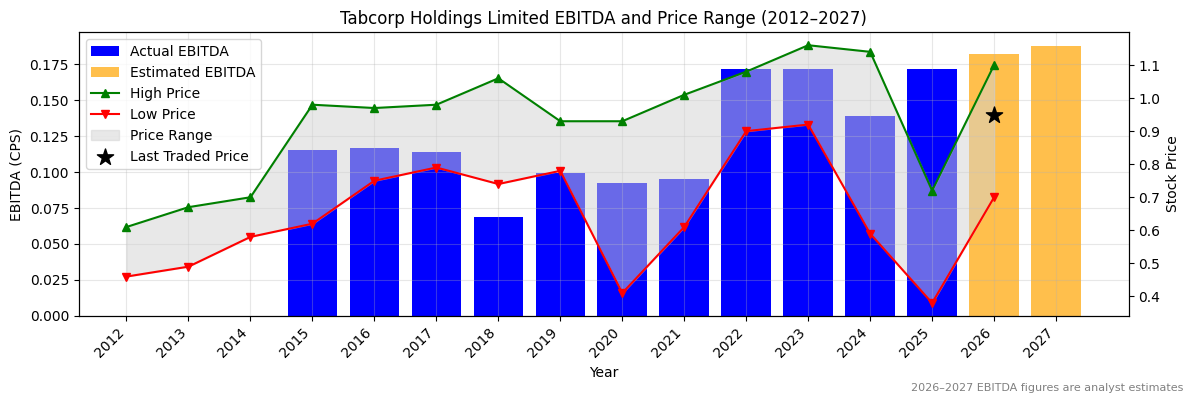
TAH Earnings before Interest, Tax, Depreciation and Amortisation (EBITDA) Per Share (2012–2027)
✅✅
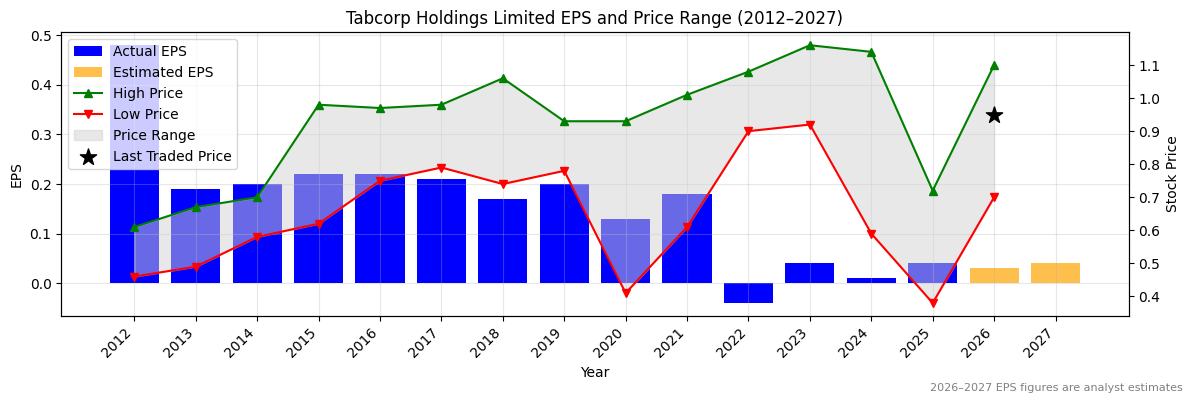
TAH Normalised Earnings Per Share (EPS) (2012–2027)
✅✅
Valuation
| Price To Sales |
Price To Book |
PER 2023 |
PER 2024 |
13Y Median PER Low |
PER 2025e |
13Y Median PER High |
PER 2026e |
Last Updated |
| 0.9 |
1.9 |
26.6 |
106.5 |
3.6 |
26.6 |
5.1 |
35.5 |
14/9/25 |
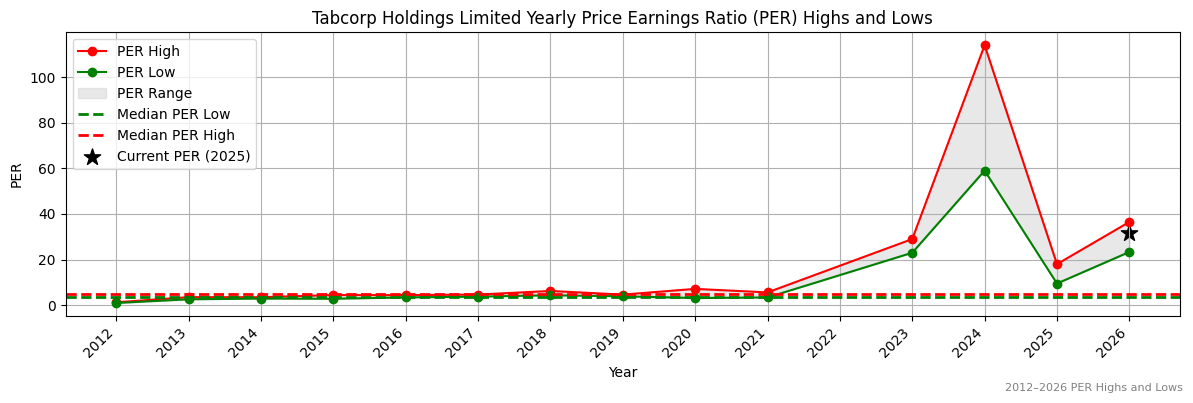
TAH Yearly Price Earnings Ratio (PER) Highs and Lows
❌
TAH Weekly Price Chart with Average True Range (ATR) Trailing Stop (10-Year View)