Ticker code: SYR
SYR Red Flags & Risk Indicators
❌
⚠️ RED FLAGS: 5 identified
- Negative Operating Cash Flow
- Low Operating Margin
- Falling Earnings
- Falling Revenues
- Risk Of Capital Raise
Income Statement
| Revenue 2024 Per Share |
Revenue 2025e Per Share |
Revenue 2026e Per Share |
Revenue 24 to 25e [%] |
Revenue 25e to 26e [%] |
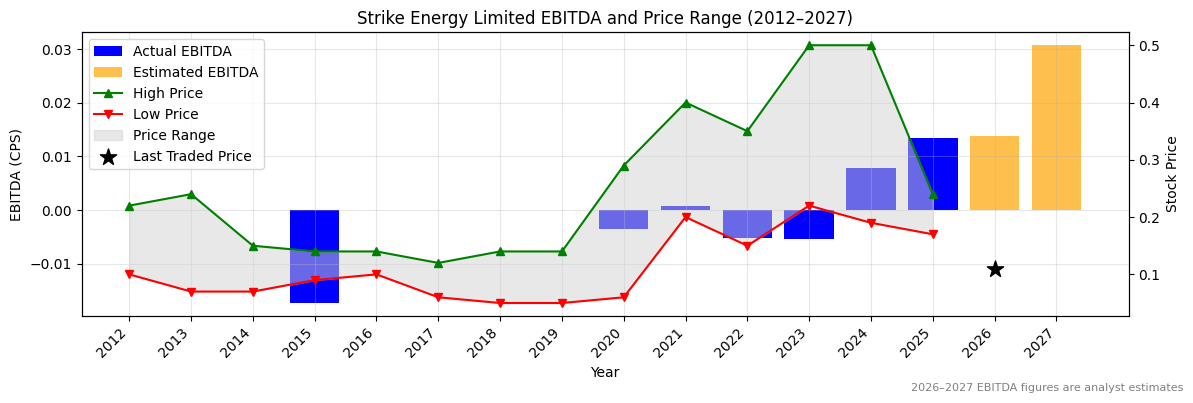
EBITDA 2024 Per Share |
EBITDA 2025e Per Share |
EBITDA 2026e Per Share |
EBITDA 24 to 25e [%] |
EBITDA 25e to 26e [%] |
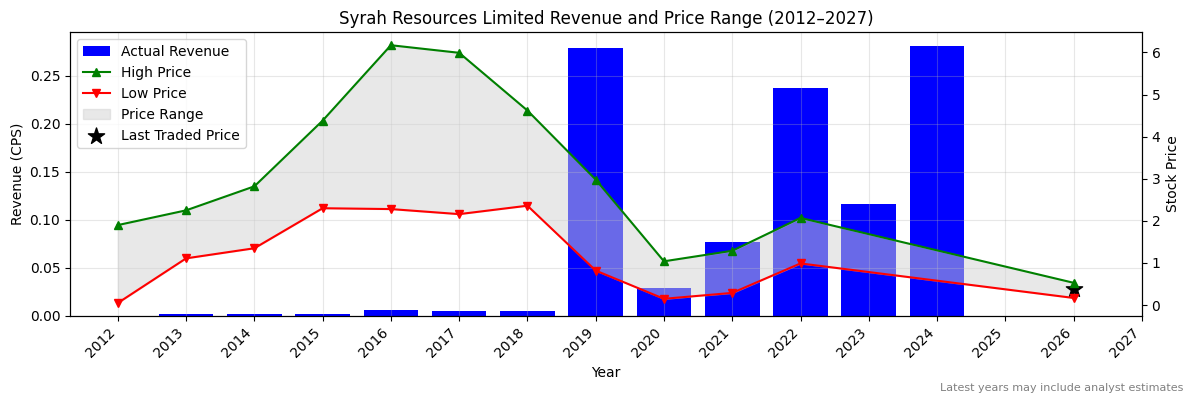
| 0.28106 |
None |
None |
None |
None |
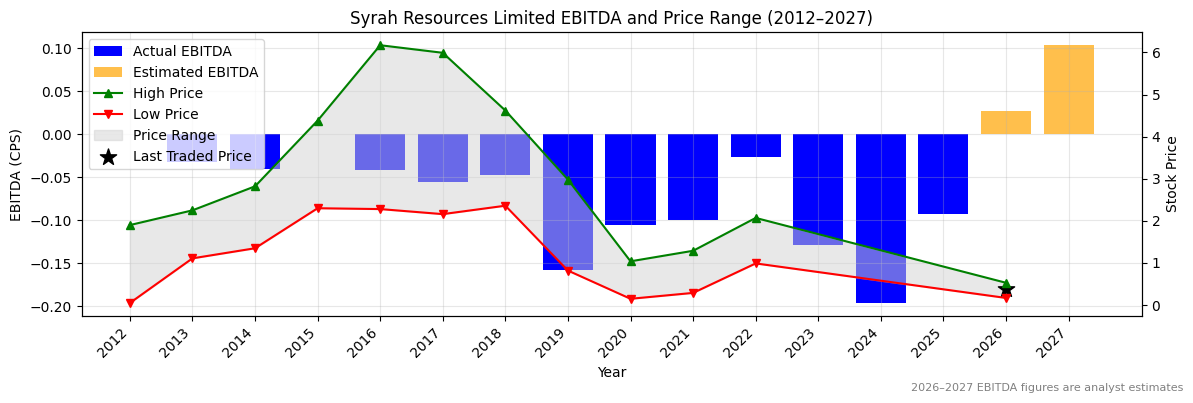
-0.19626 |
-0.09315 |
0.02701 |
52.5 |
129.0 |
SYR Revenue Per Share (2012–2027)
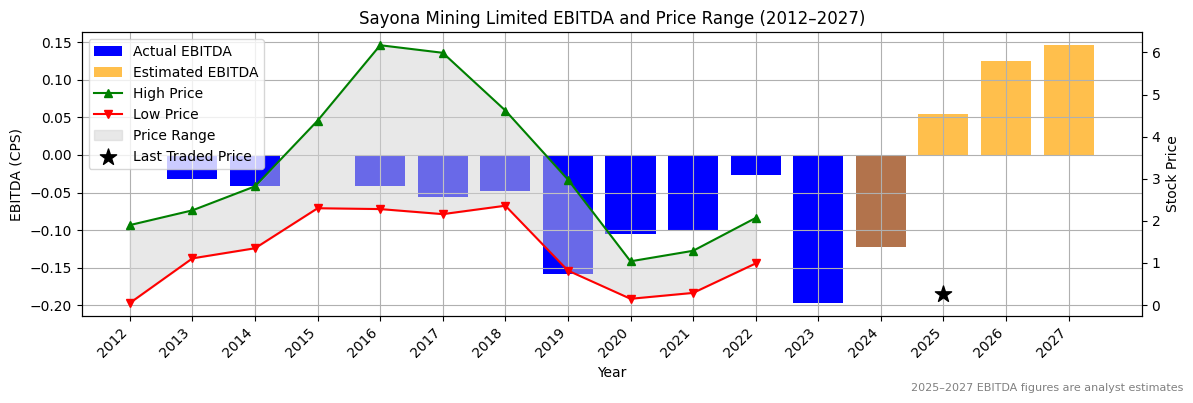
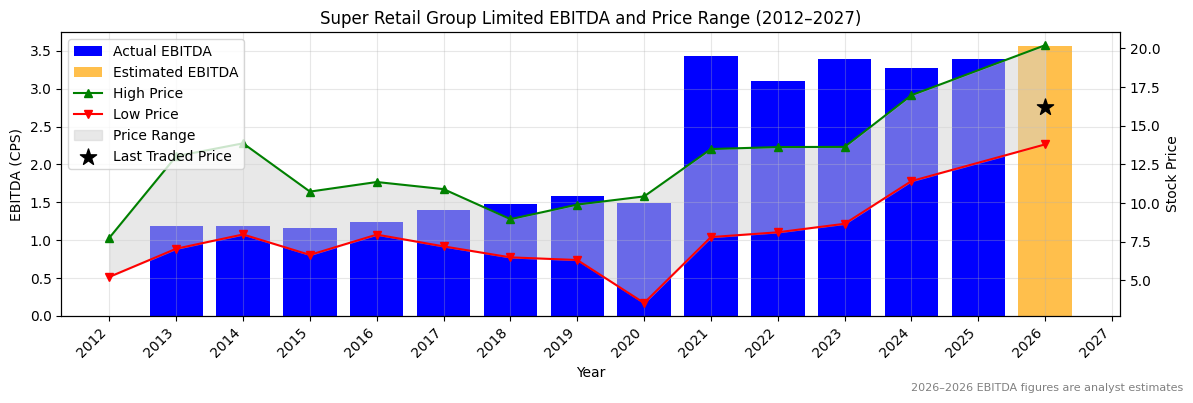
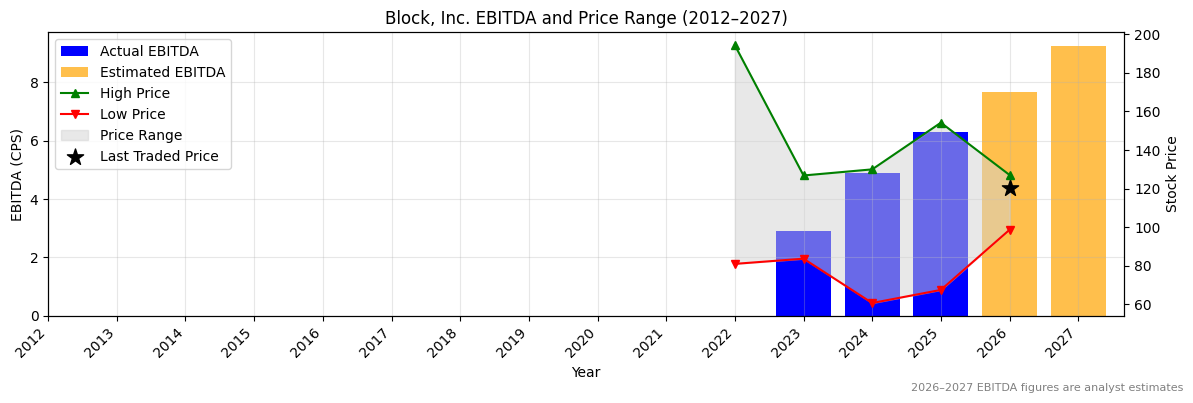
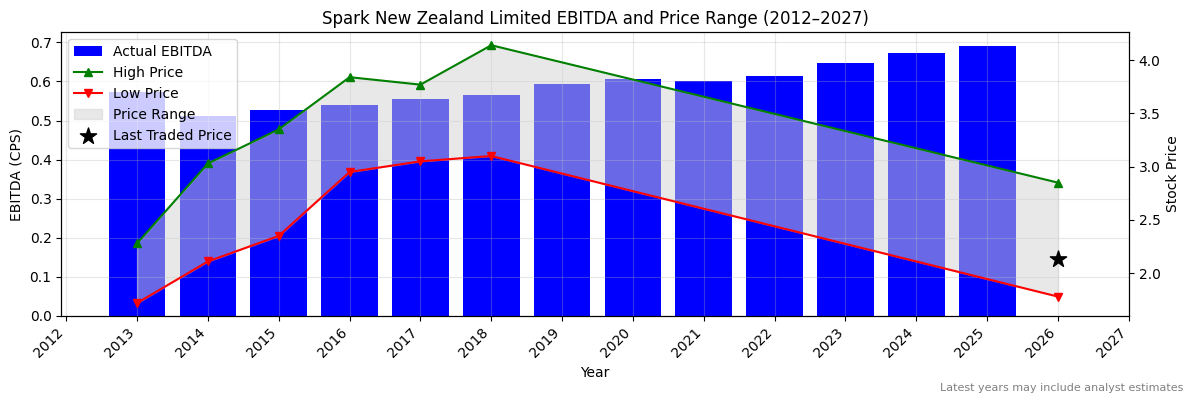
SYR Earnings before Interest, Tax, Depreciation and Amortisation (EBITDA) Per Share (2012–2027)
✅✅
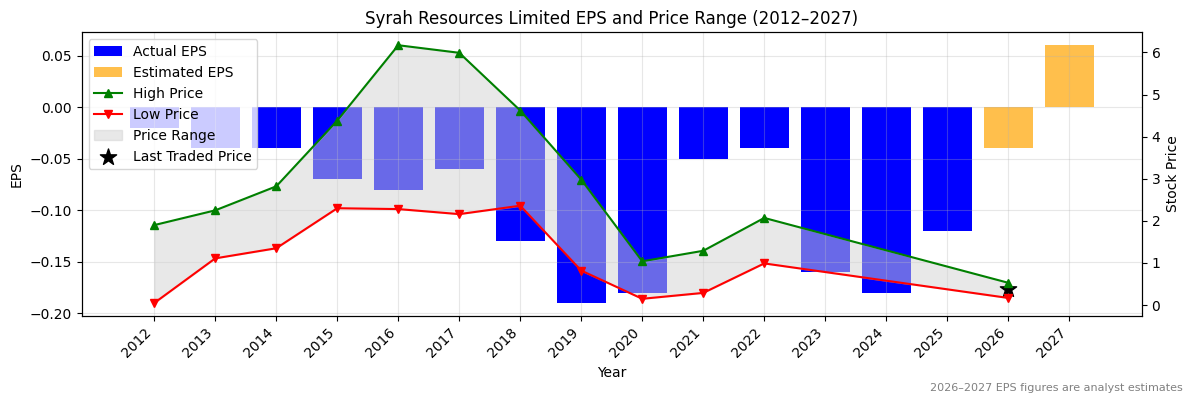
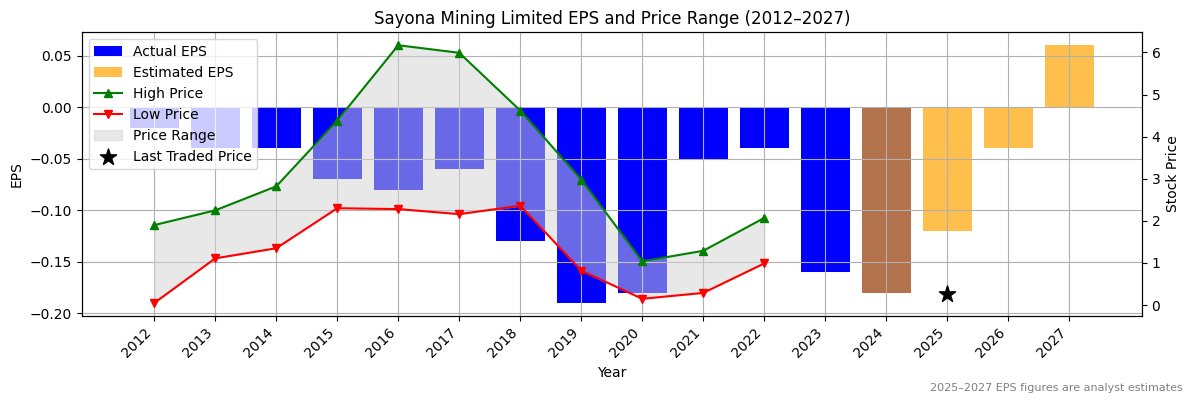
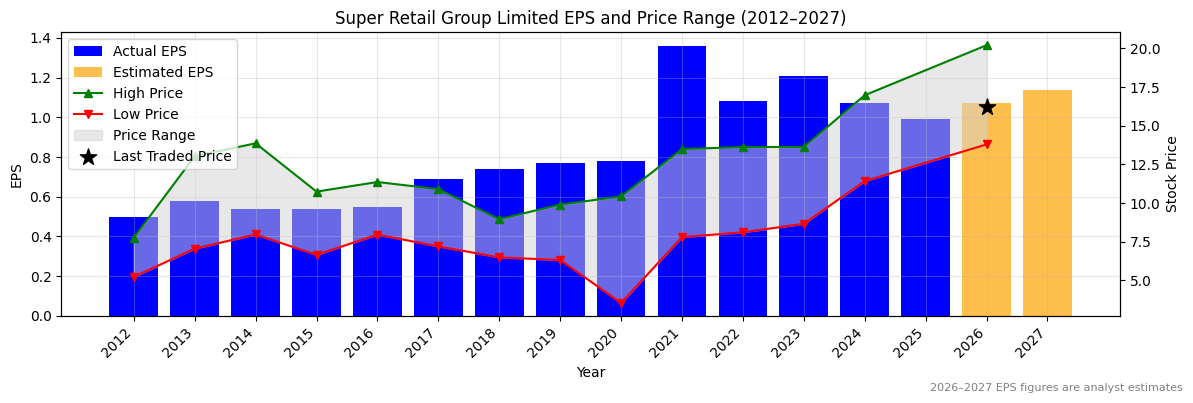
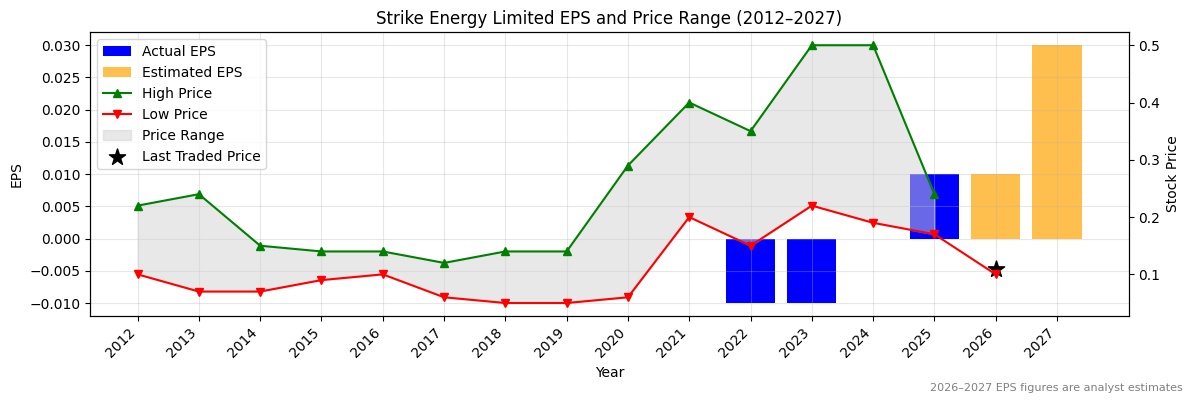
SYR Normalised Earnings Per Share (EPS) (2012–2027)
✅✅
Valuation
| Price To Sales |
Price To Book |
PER 2023 |
PER 2024 |
13Y Median PER Low |
PER 2025e |
13Y Median PER High |
PER 2026e |
Last Updated |
| 30.8 |
1.1 |
-2.1 |
-1.9 |
None |
-2.8 |
None |
-8.5 |
4/3/24 |
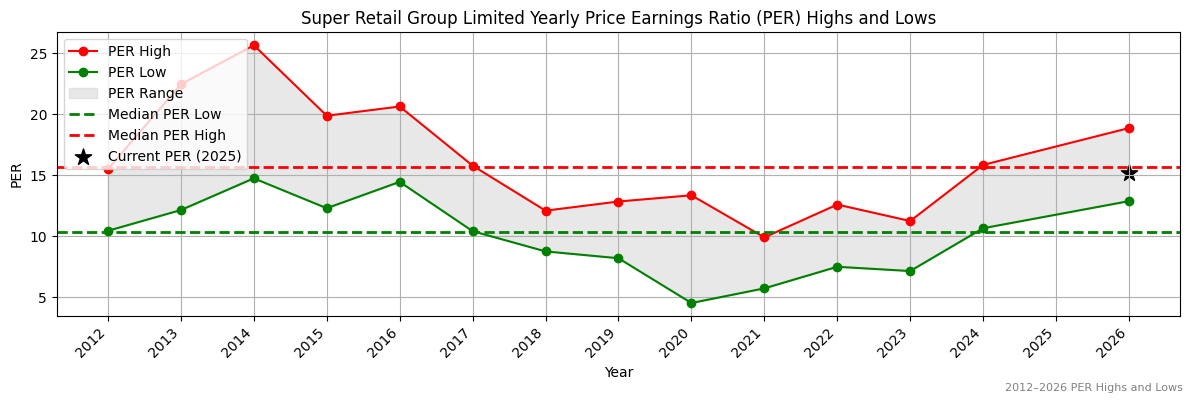
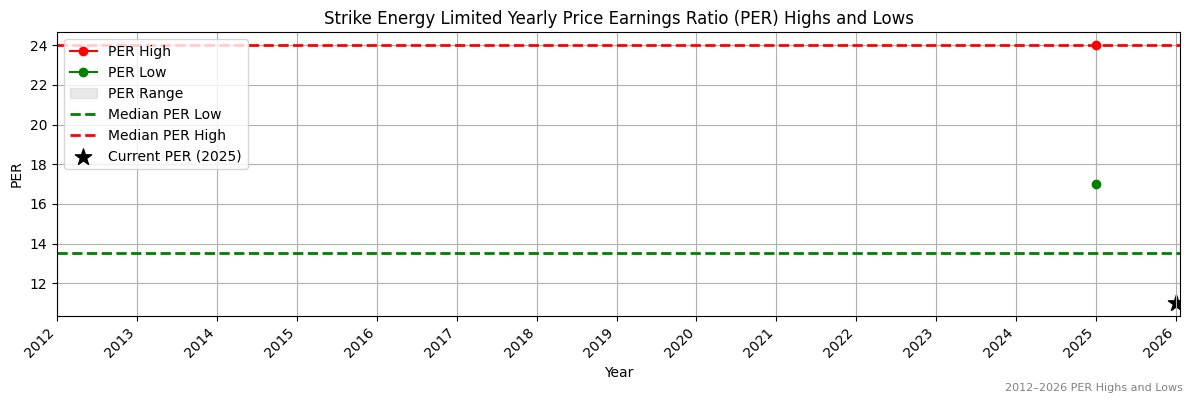
SYR Yearly Price Earnings Ratio (PER) Highs and Lows
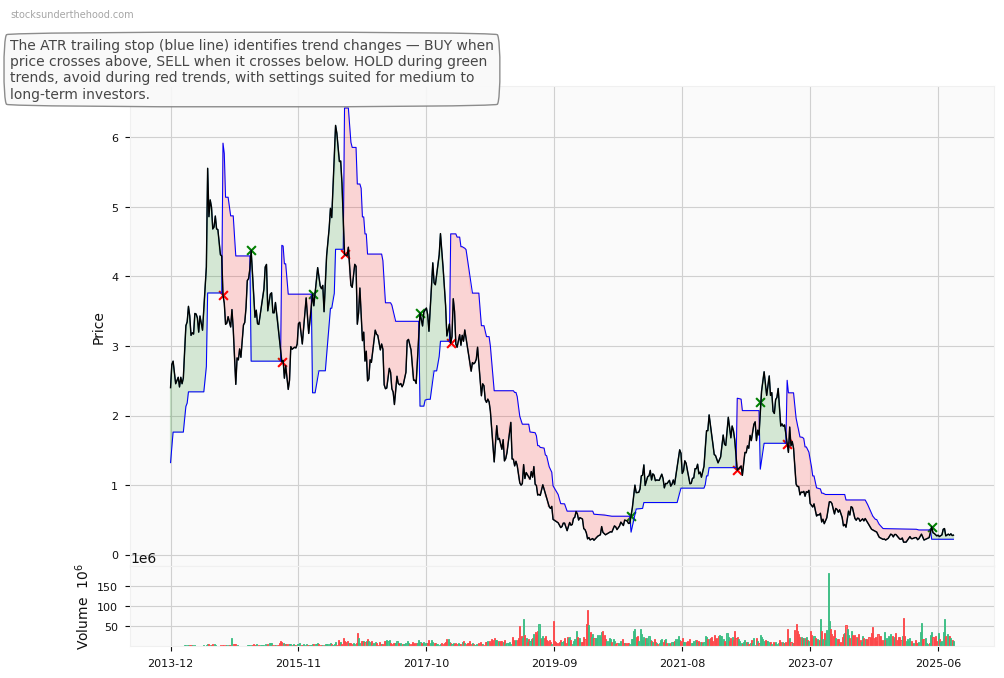
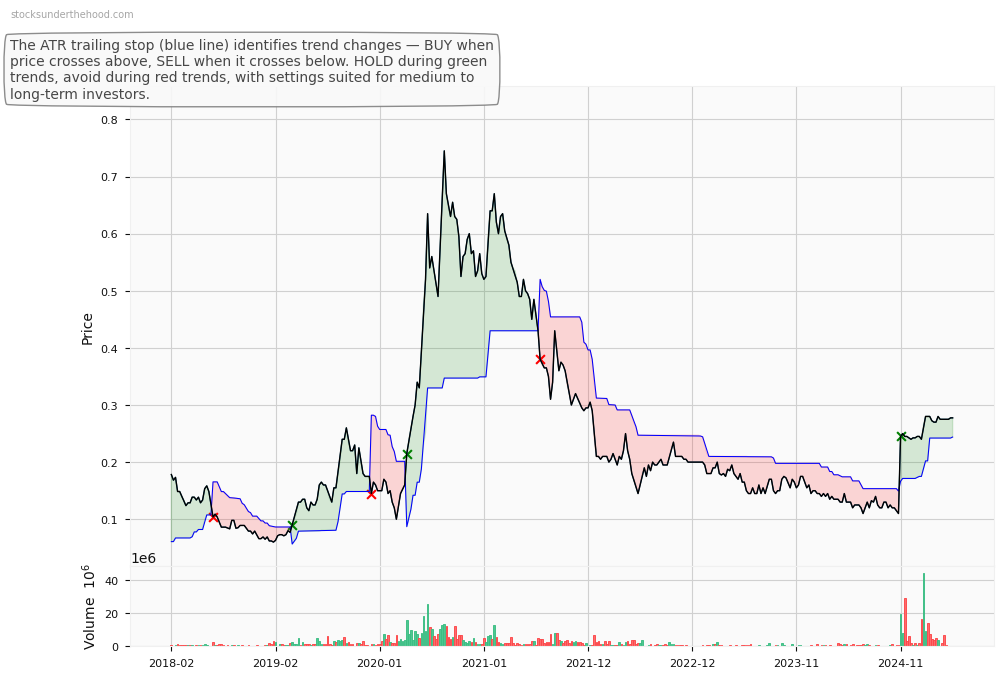
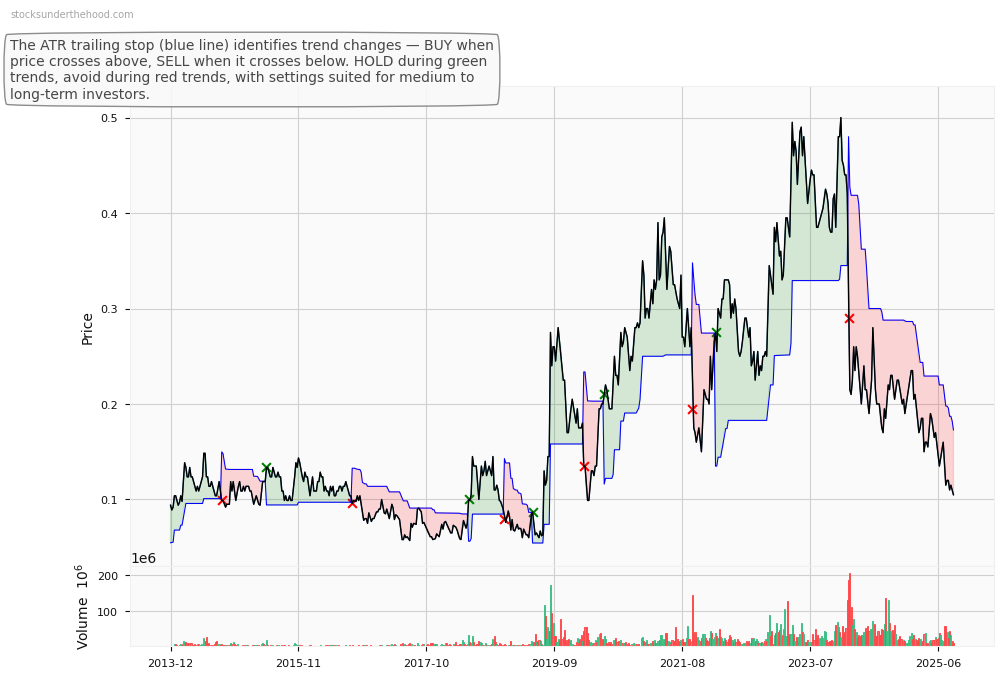
SYR Weekly Price Chart with Average True Range (ATR) Trailing Stop (10-Year View)
Ticker code: ASX:SYR
ASX:SYR Red Flags & Risk Indicators
❌
⚠️ RED FLAGS: 3 identified
- Negative Operating Cash Flow
- Falling Earnings
- Risk Of Capital Raise
Income Statement
| Revenue 2024 Per Share |
Revenue 2025e Per Share |
Revenue 2026e Per Share |
Revenue 24 to 25e [%] |
Revenue 25e to 26e [%] |
EBITDA 2024 Per Share |
EBITDA 2025e Per Share |
EBITDA 2026e Per Share |
EBITDA 24 to 25e [%] |
EBITDA 25e to 26e [%] |
| 0.28106 |
None |
None |
None |
None |
-0.1221 |
0.05447 |
0.12565 |
144.6 |
130.7 |
ASX:SYR Revenue Per Share (2012–2027)
ASX:SYR Earnings before Interest, Tax, Depreciation and Amortisation (EBITDA) Per Share (2012–2027)
✅✅
ASX:SYR Normalised Earnings Per Share (EPS) (2012–2027)
✅✅
Valuation
| Price To Sales |
Price To Book |
PER 2023 |
PER 2024 |
13Y Median PER Low |
PER 2025e |
13Y Median PER High |
PER 2026e |
Last Updated |
| 24.0 |
0.9 |
-1.7 |
-1.5 |
None |
-2.2 |
None |
-6.6 |
4/3/24 |
ASX:SYR Yearly Price Earnings Ratio (PER) Highs and Lows
ASX:SYR Weekly Price Chart with Average True Range (ATR) Trailing Stop (10-Year View)
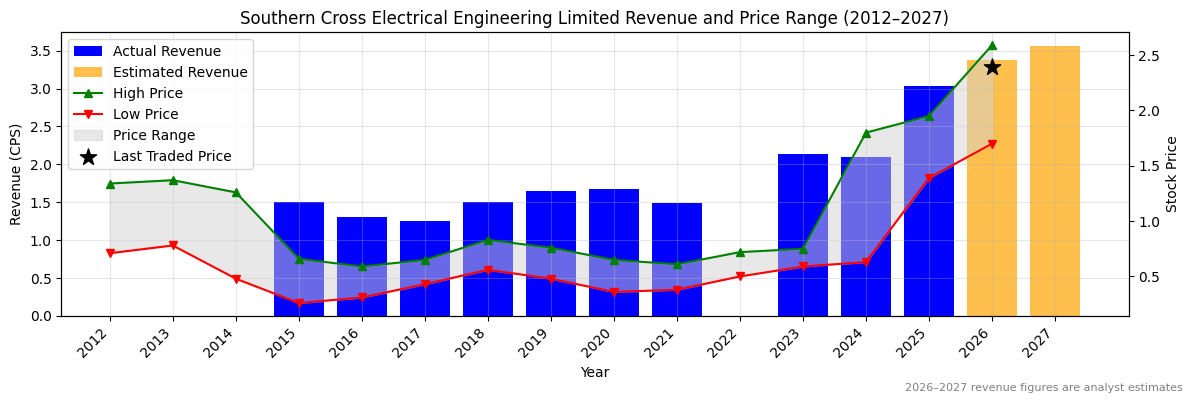
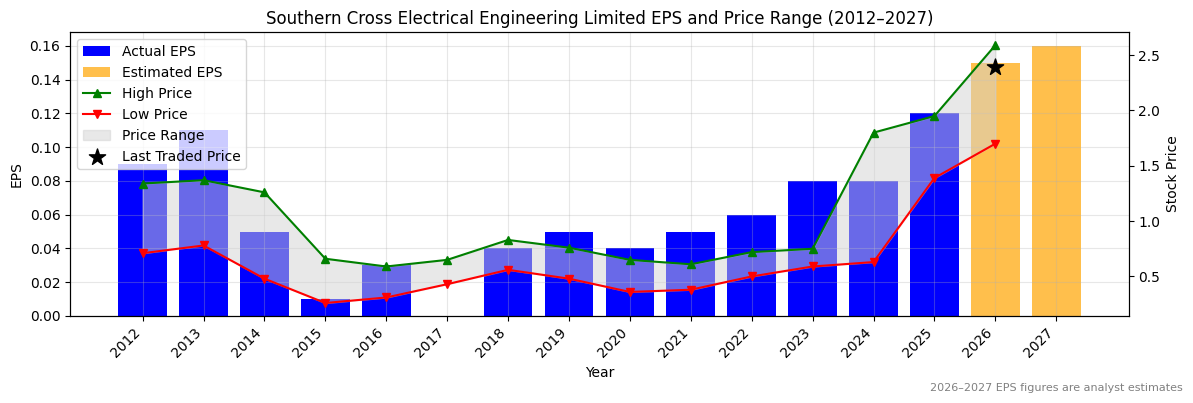
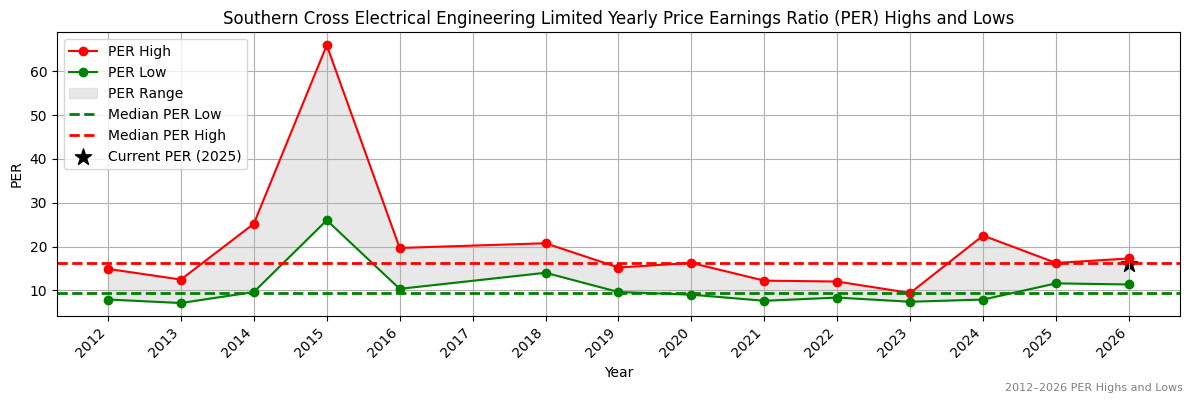
Ticker code: SXE
SXE Red Flags & Risk Indicators
⚠️
⚠️ RED FLAGS: 1 identified
Income Statement
| Revenue 2024 Per Share |
Revenue 2025e Per Share |
Revenue 2026e Per Share |
Revenue 24 to 25e [%] |
Revenue 25e to 26e [%] |
EBITDA 2024 Per Share |
EBITDA 2025e Per Share |
EBITDA 2026e Per Share |
EBITDA 24 to 25e [%] |
EBITDA 25e to 26e [%] |
| 2.09677 |
3.03801 |
3.37056 |
44.9 |
10.9 |
0.15235 |
0.20741 |
0.25284 |
36.1 |
21.9 |
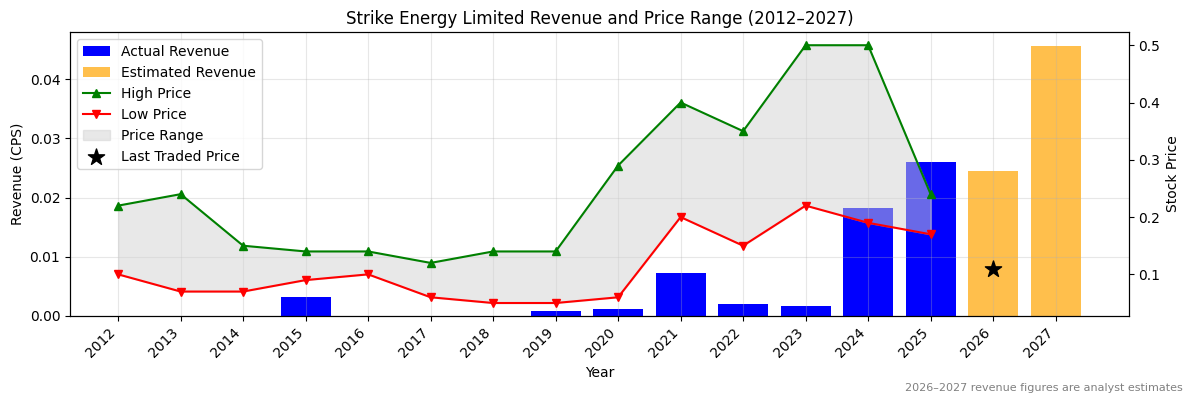
SXE Revenue Per Share (2012–2027)
✅✅
SXE Earnings before Interest, Tax, Depreciation and Amortisation (EBITDA) Per Share (2012–2027)
✅✅
SXE Normalised Earnings Per Share (EPS) (2012–2027)
✅✅
Valuation
| Price To Sales |
Price To Book |
PER 2023 |
PER 2024 |
13Y Median PER Low |
PER 2025e |
13Y Median PER High |
PER 2026e |
Last Updated |
| 0.8 |
3.2 |
30.8 |
30.8 |
9.3 |
20.5 |
16.3 |
16.4 |
31/10/25 |
SXE Yearly Price Earnings Ratio (PER) Highs and Lows
❌
SXE Weekly Price Chart with Average True Range (ATR) Trailing Stop (10-Year View)
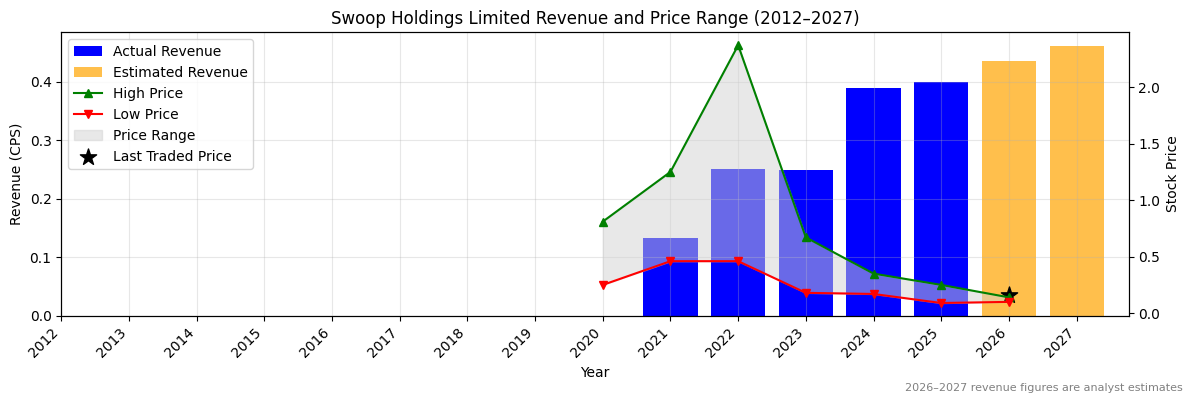
Ticker code: SWP
SWP Red Flags & Risk Indicators
⚠️
⚠️ RED FLAGS: 1 identified
Income Statement
| Revenue 2024 Per Share |
Revenue 2025e Per Share |
Revenue 2026e Per Share |
Revenue 24 to 25e [%] |
Revenue 25e to 26e [%] |
EBITDA 2024 Per Share |
EBITDA 2025e Per Share |
EBITDA 2026e Per Share |
EBITDA 24 to 25e [%] |
EBITDA 25e to 26e [%] |
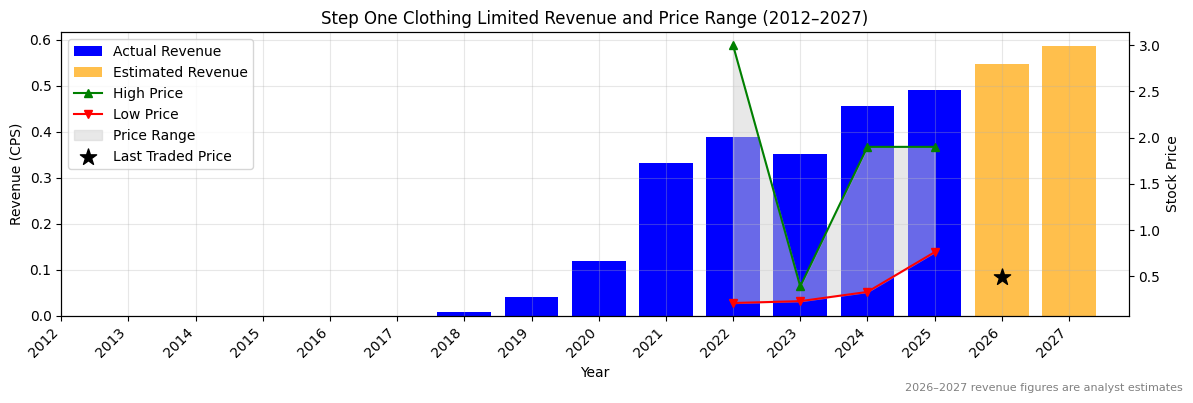
| 0.3898 |
0.39911 |
0.43501 |
2.4 |
9.0 |
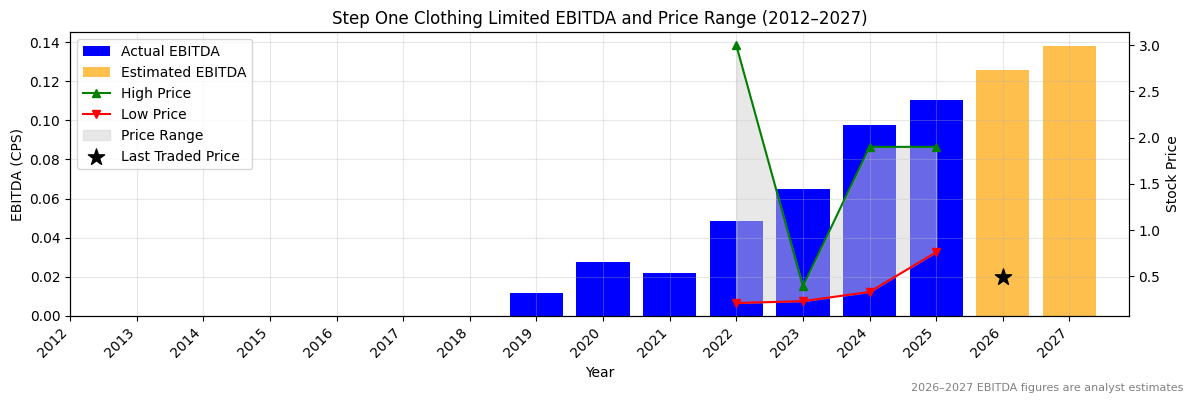
0.08597 |
0.09558 |
0.10584 |
11.2 |
10.7 |
SWP Revenue Per Share (2012–2027)
✅
SWP Earnings before Interest, Tax, Depreciation and Amortisation (EBITDA) Per Share (2012–2027)
✅
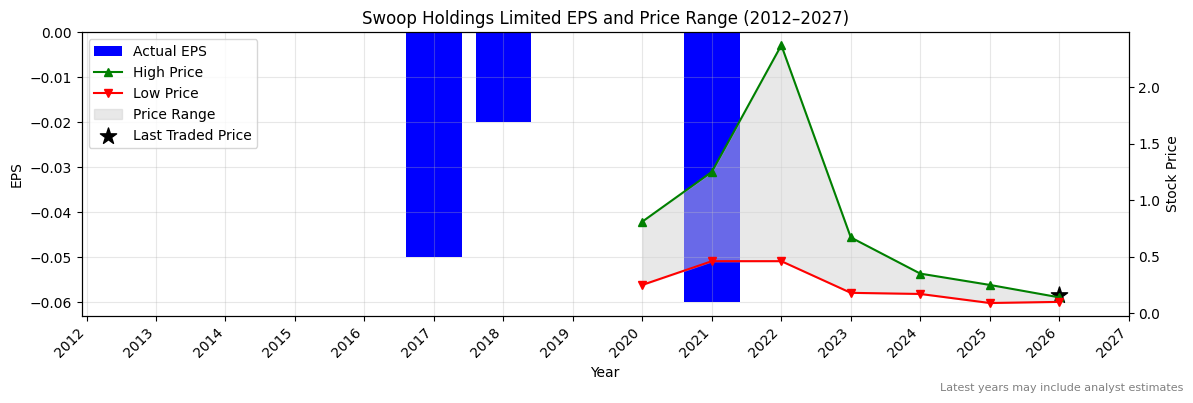
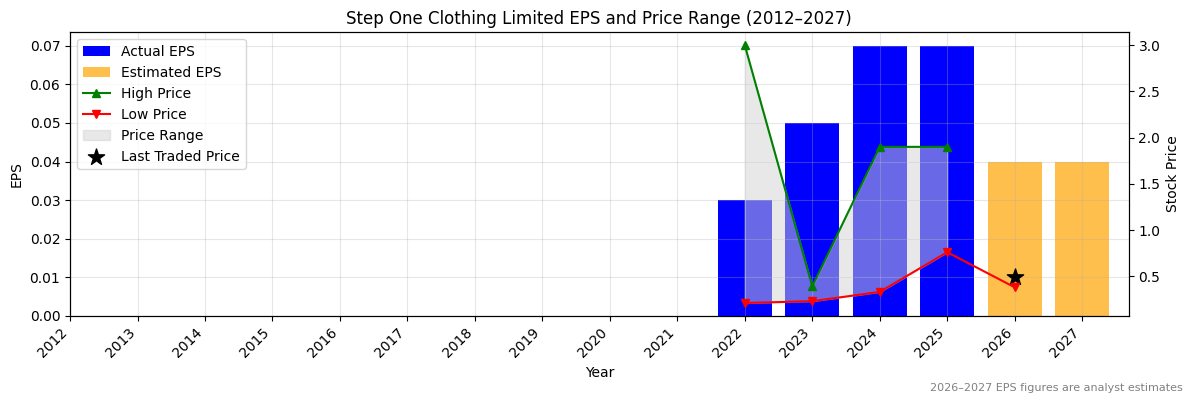
SWP Normalised Earnings Per Share (EPS) (2012–2027)
Valuation
| Price To Sales |
Price To Book |
PER 2023 |
PER 2024 |
13Y Median PER Low |
PER 2025e |
13Y Median PER High |
PER 2026e |
Last Updated |
| 0.3 |
0.6 |
None |
None |
None |
None |
None |
None |
20/8/25 |
SWP Yearly Price Earnings Ratio (PER) Highs and Lows
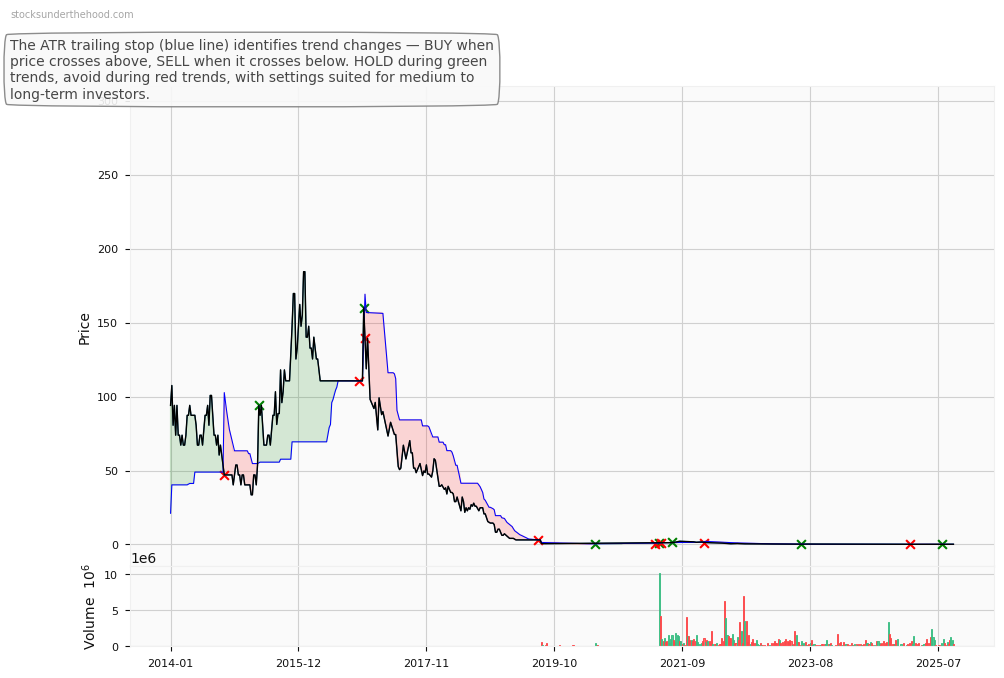
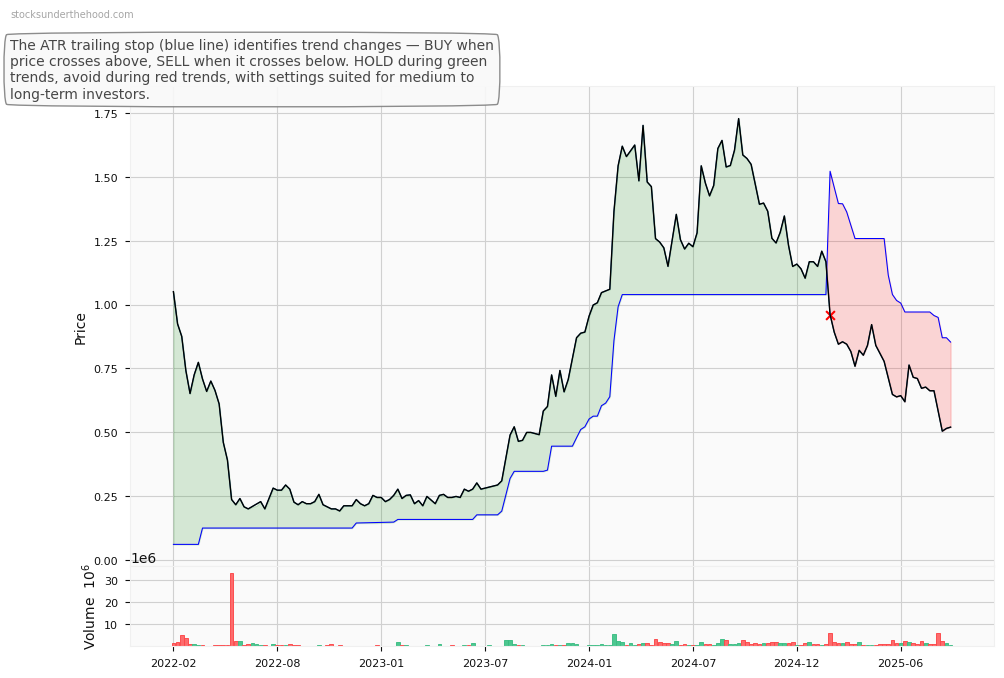
SWP Weekly Price Chart with Average True Range (ATR) Trailing Stop (10-Year View)
Ticker code: None
None Red Flags & Risk Indicators
⚠️
⚠️ RED FLAGS: 2 identified
- Falling Earnings
- High Price to Book vs ROE
Income Statement
| Revenue 2024 Per Share |
Revenue 2025e Per Share |
Revenue 2026e Per Share |
Revenue 24 to 25e [%] |
Revenue 25e to 26e [%] |
EBITDA 2024 Per Share |
EBITDA 2025e Per Share |
EBITDA 2026e Per Share |
EBITDA 24 to 25e [%] |
EBITDA 25e to 26e [%] |
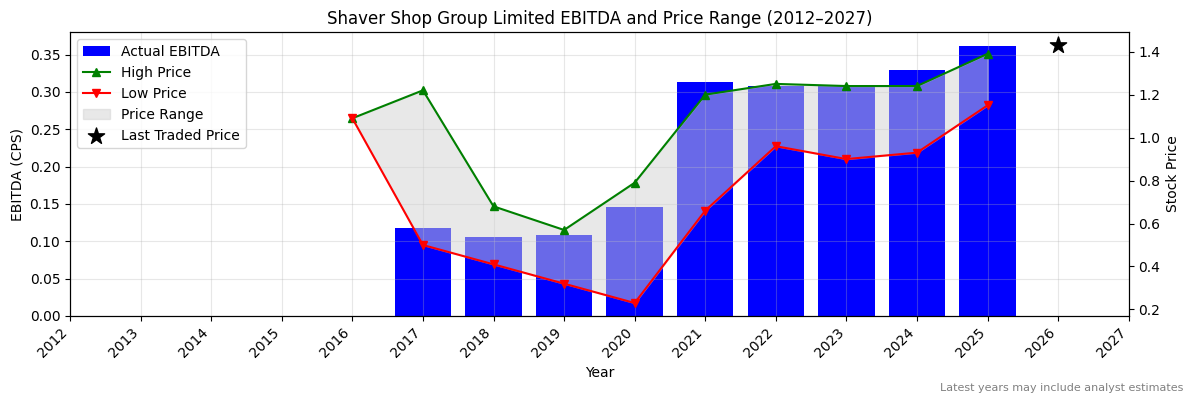
| 0.11626 |
None |
None |
None |
None |
None |
None |
None |
None |
None |
None Revenue Per Share (2012–2027)
None Earnings before Interest, Tax, Depreciation and Amortisation (EBITDA) Per Share (2012–2027)
None Normalised Earnings Per Share (EPS) (2012–2027)
Valuation
| Price To Sales |
Price To Book |
PER 2023 |
PER 2024 |
13Y Median PER Low |
PER 2025e |
13Y Median PER High |
PER 2026e |
Last Updated |
| 0.2 |
0.3 |
None |
None |
None |
None |
None |
None |
6/3/24 |
None Yearly Price Earnings Ratio (PER) Highs and Lows
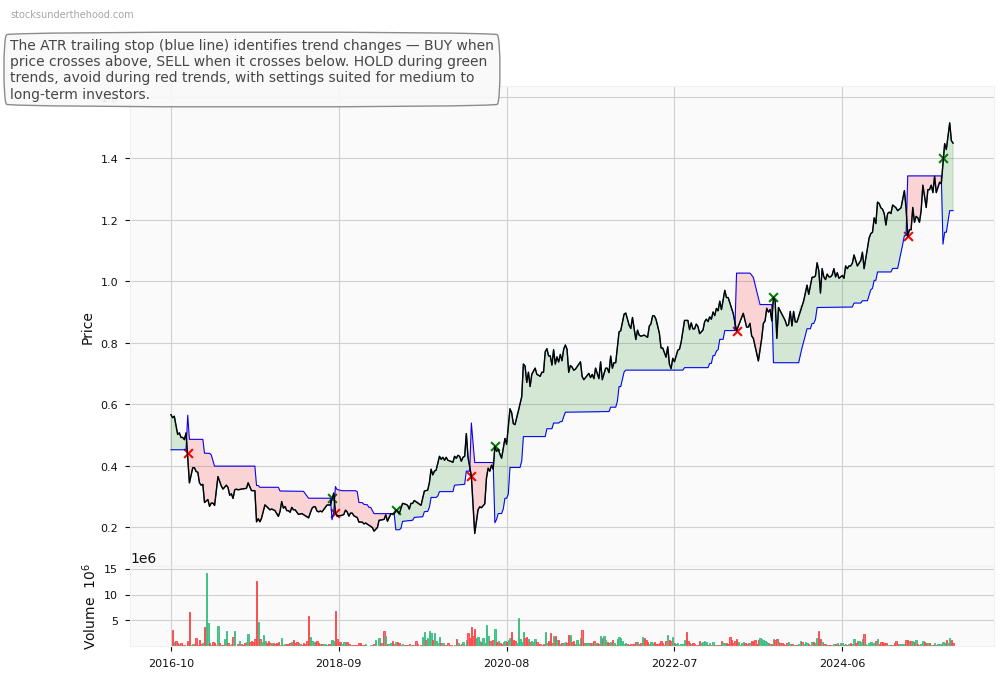
None Weekly Price Chart with Average True Range (ATR) Trailing Stop (10-Year View)
Ticker code: SGH
SGH Red Flags & Risk Indicators
❌
⚠️ RED FLAGS: 4 identified
- Increasing Shorts
- Falling Earnings
- Market Cap < Liabilities
- High Relative Valuation
Income Statement
| Revenue 2024 Per Share |
Revenue 2025e Per Share |
Revenue 2026e Per Share |
Revenue 24 to 25e [%] |
Revenue 25e to 26e [%] |
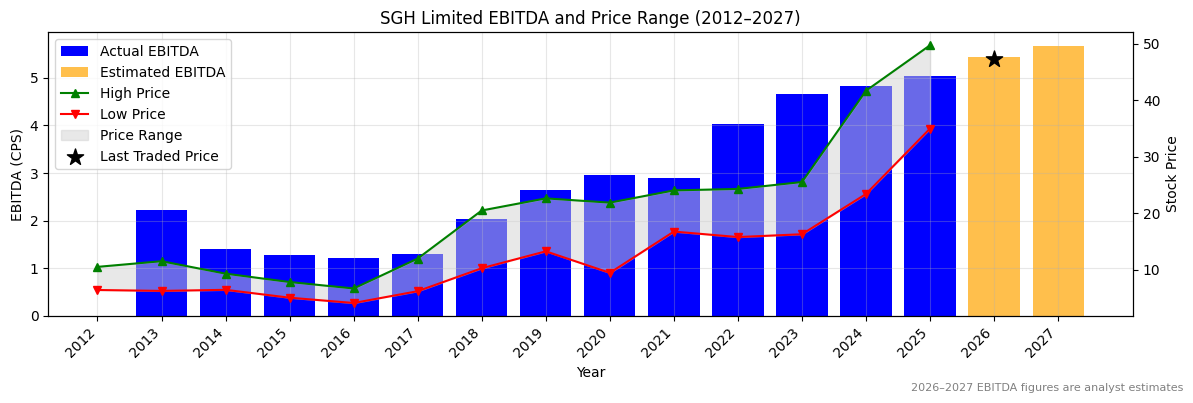
EBITDA 2024 Per Share |
EBITDA 2025e Per Share |
EBITDA 2026e Per Share |
EBITDA 24 to 25e [%] |
EBITDA 25e to 26e [%] |
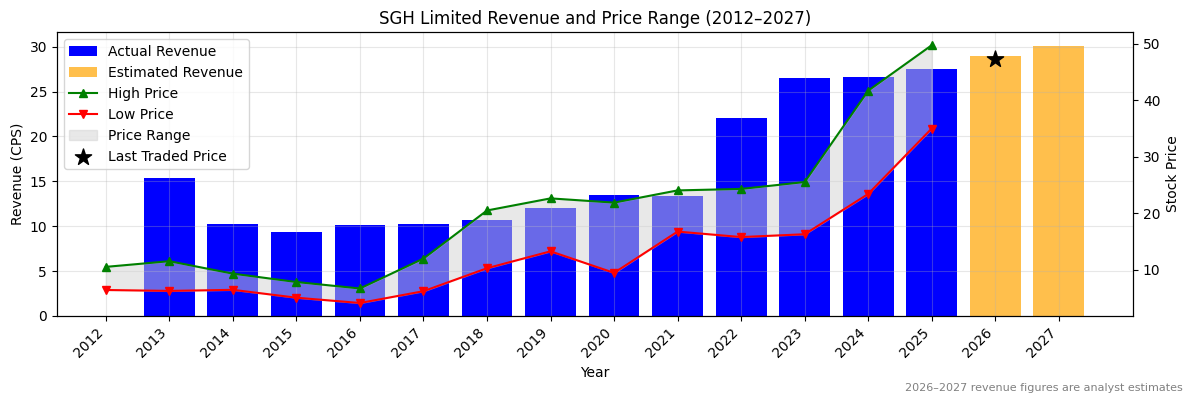
| 26.59028 |
27.50332 |
28.96679 |
3.4 |
5.3 |
4.83321 |
5.03855 |
5.44899 |
4.2 |
8.1 |
SGH Revenue Per Share (2012–2027)
✅
SGH Earnings before Interest, Tax, Depreciation and Amortisation (EBITDA) Per Share (2012–2027)
✅
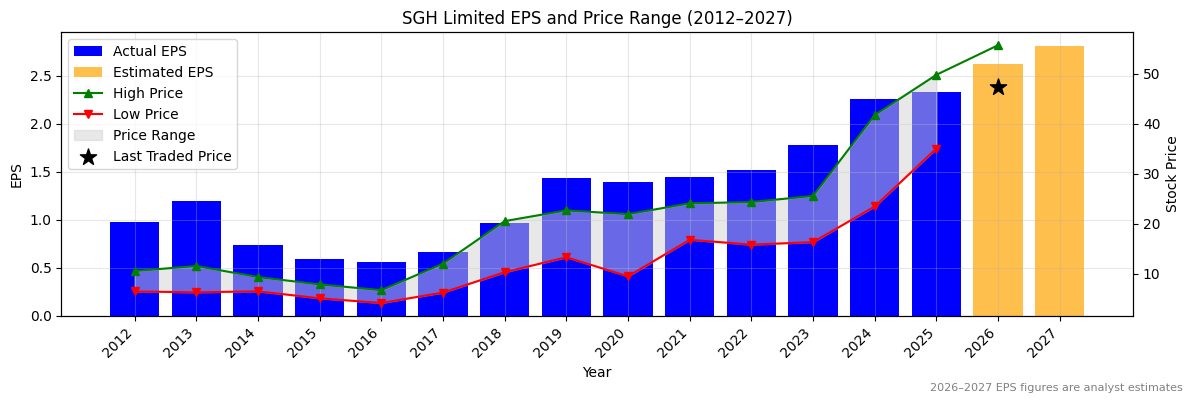
SGH Normalised Earnings Per Share (EPS) (2012–2027)
✅
Valuation
| Price To Sales |
Price To Book |
PER 2023 |
PER 2024 |
13Y Median PER Low |
PER 2025e |
13Y Median PER High |
PER 2026e |
Last Updated |
| None |
4.1 |
27.2 |
21.5 |
9.2 |
20.8 |
15.8 |
18.5 |
16/1/25 |
SGH Yearly Price Earnings Ratio (PER) Highs and Lows
❌
SGH Weekly Price Chart with Average True Range (ATR) Trailing Stop (10-Year View)
Ticker code: SVL
SVL Red Flags & Risk Indicators
❌
⚠️ RED FLAGS: 5 identified
- Negative Operating Cash Flow
- Large Share Issuance
- Low Operating Margin
- Falling Earnings
- Falling Revenues
Income Statement
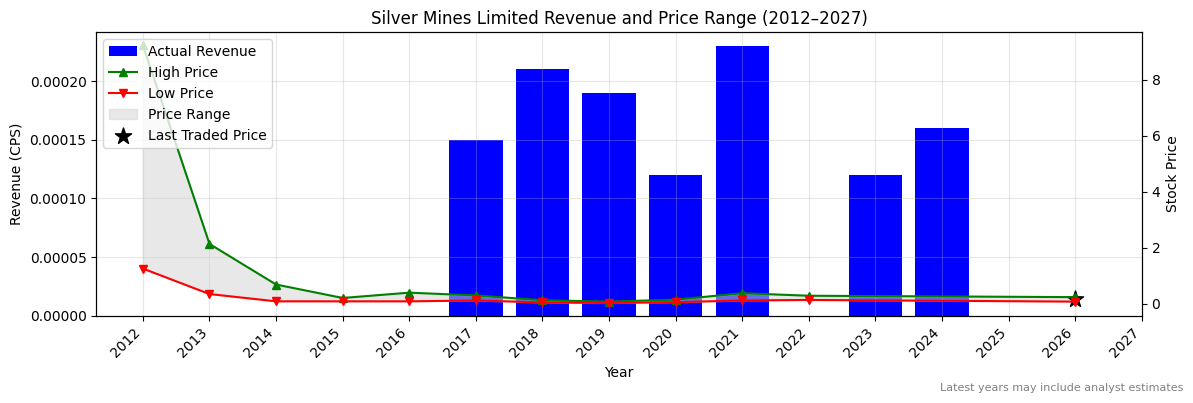
| Revenue 2024 Per Share |
Revenue 2025e Per Share |
Revenue 2026e Per Share |
Revenue 24 to 25e [%] |
Revenue 25e to 26e [%] |
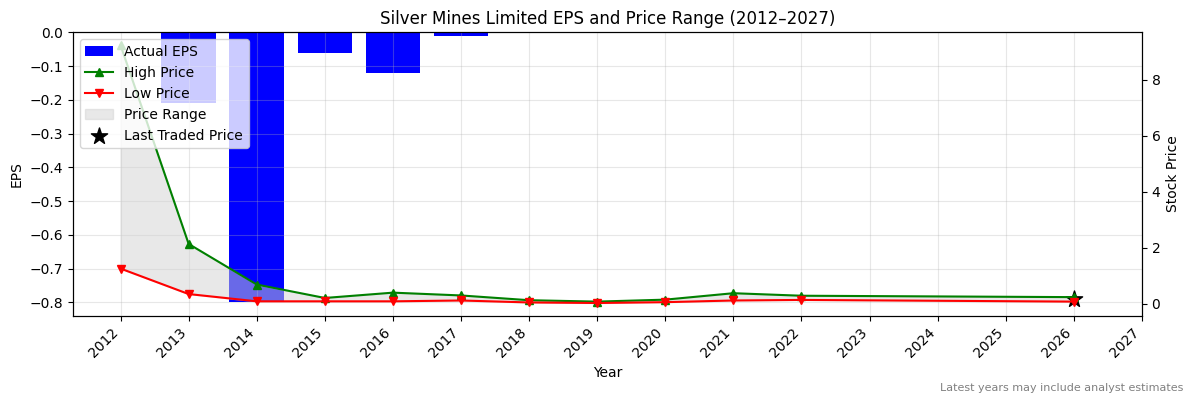
EBITDA 2024 Per Share |
EBITDA 2025e Per Share |
EBITDA 2026e Per Share |
EBITDA 24 to 25e [%] |
EBITDA 25e to 26e [%] |
| 0.00016 |
None |
None |
None |
None |
-0.00179 |
None |
None |
None |
None |
SVL Revenue Per Share (2012–2027)
SVL Earnings before Interest, Tax, Depreciation and Amortisation (EBITDA) Per Share (2012–2027)
SVL Normalised Earnings Per Share (EPS) (2012–2027)
Valuation
| Price To Sales |
Price To Book |
PER 2023 |
PER 2024 |
13Y Median PER Low |
PER 2025e |
13Y Median PER High |
PER 2026e |
Last Updated |
| 1709.3 |
1.9 |
None |
None |
None |
None |
None |
None |
4/4/24 |
SVL Yearly Price Earnings Ratio (PER) Highs and Lows
SVL Weekly Price Chart with Average True Range (ATR) Trailing Stop (10-Year View)
Ticker code: SUN
SUN Red Flags & Risk Indicators
❌
⚠️ RED FLAGS: 3 identified
- Negative Operating Cash Flow
- Falling Earnings
- Risk Of Capital Raise
Income Statement
| Revenue 2024 Per Share |
Revenue 2025e Per Share |
Revenue 2026e Per Share |
Revenue 24 to 25e [%] |
Revenue 25e to 26e [%] |
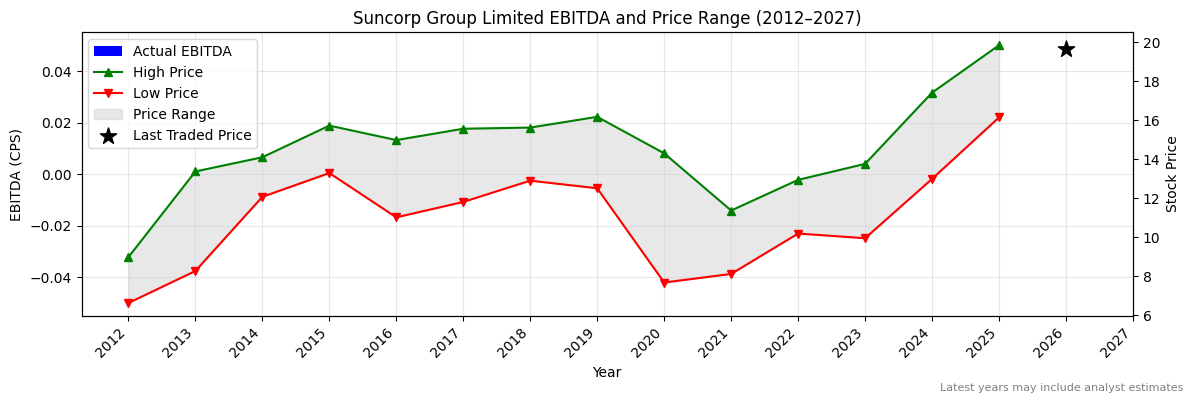
EBITDA 2024 Per Share |
EBITDA 2025e Per Share |
EBITDA 2026e Per Share |
EBITDA 24 to 25e [%] |
EBITDA 25e to 26e [%] |
| 10.33325 |
None |
None |
None |
None |
None |
None |
None |
None |
None |
SUN Revenue Per Share (2012–2027)
SUN Earnings before Interest, Tax, Depreciation and Amortisation (EBITDA) Per Share (2012–2027)
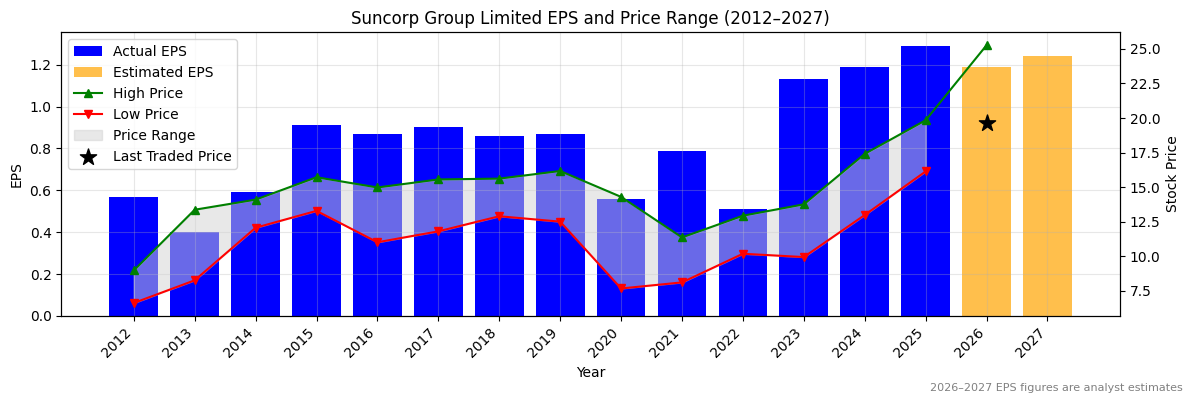
SUN Normalised Earnings Per Share (EPS) (2012–2027)
✅
Valuation
| Price To Sales |
Price To Book |
PER 2023 |
PER 2024 |
13Y Median PER Low |
PER 2025e |
13Y Median PER High |
PER 2026e |
Last Updated |
| 1.4 |
2.0 |
17.4 |
16.5 |
13.4 |
15.2 |
17.3 |
16.5 |
23/7/25 |
SUN Yearly Price Earnings Ratio (PER) Highs and Lows
✅
SUN Weekly Price Chart with Average True Range (ATR) Trailing Stop (10-Year View)
Ticker code: SUL
SUL Red Flags & Risk Indicators
❌
⚠️ RED FLAGS: 3 identified
- Low Operating Margin
- Increasing Shorts
- Falling Earnings
Income Statement
| Revenue 2024 Per Share |
Revenue 2025e Per Share |
Revenue 2026e Per Share |
Revenue 24 to 25e [%] |
Revenue 25e to 26e [%] |
EBITDA 2024 Per Share |
EBITDA 2025e Per Share |
EBITDA 2026e Per Share |
EBITDA 24 to 25e [%] |
EBITDA 25e to 26e [%] |
| 17.19486 |
None |
None |
None |
None |
3.27104 |
3.38857 |
3.5673 |
3.6 |
5.3 |
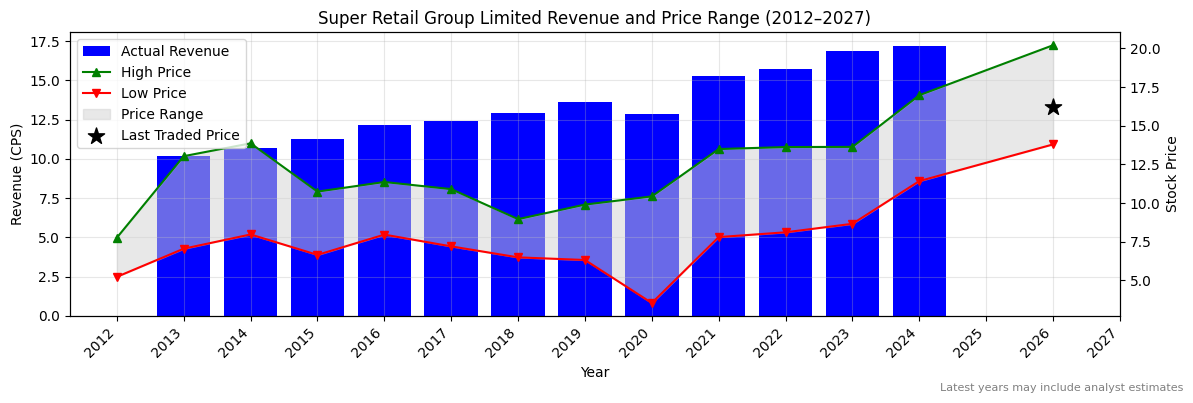
SUL Revenue Per Share (2012–2027)
SUL Earnings before Interest, Tax, Depreciation and Amortisation (EBITDA) Per Share (2012–2027)
✅
SUL Normalised Earnings Per Share (EPS) (2012–2027)
❌
Valuation
| Price To Sales |
Price To Book |
PER 2023 |
PER 2024 |
13Y Median PER Low |
PER 2025e |
13Y Median PER High |
PER 2026e |
Last Updated |
| 0.9 |
2.7 |
13.2 |
15.0 |
10.4 |
16.2 |
15.7 |
15.0 |
12/9/24 |
SUL Yearly Price Earnings Ratio (PER) Highs and Lows
❌
SUL Weekly Price Chart with Average True Range (ATR) Trailing Stop (10-Year View)
Ticker code: STX
STX Red Flags & Risk Indicators
⚠️
⚠️ RED FLAGS: 2 identified
- Highly Shorted
- Falling Revenues
Income Statement
| Revenue 2024 Per Share |
Revenue 2025e Per Share |
Revenue 2026e Per Share |
Revenue 24 to 25e [%] |
Revenue 25e to 26e [%] |
EBITDA 2024 Per Share |
EBITDA 2025e Per Share |
EBITDA 2026e Per Share |
EBITDA 24 to 25e [%] |
EBITDA 25e to 26e [%] |
| 0.01825 |
0.02606 |
0.0244 |
42.8 |
-6.4 |
0.00778 |
0.01352 |
0.01383 |
73.8 |
2.3 |
STX Revenue Per Share (2012–2027)
✅✅
STX Earnings before Interest, Tax, Depreciation and Amortisation (EBITDA) Per Share (2012–2027)
✅✅
STX Normalised Earnings Per Share (EPS) (2012–2027)
✅✅
Valuation
| Price To Sales |
Price To Book |
PER 2023 |
PER 2024 |
13Y Median PER Low |
PER 2025e |
13Y Median PER High |
PER 2026e |
Last Updated |
| 5.4 |
1.1 |
-11.0 |
None |
13.5 |
11.0 |
24.0 |
11.0 |
4/7/25 |
STX Yearly Price Earnings Ratio (PER) Highs and Lows
✅✅
STX Weekly Price Chart with Average True Range (ATR) Trailing Stop (10-Year View)
Ticker code: STP
STP Red Flags & Risk Indicators
⚠️
⚠️ RED FLAGS: 2 identified
- Increasing Shorts
- Falling Revenues
Income Statement
| Revenue 2024 Per Share |
Revenue 2025e Per Share |
Revenue 2026e Per Share |
Revenue 24 to 25e [%] |
Revenue 25e to 26e [%] |
EBITDA 2024 Per Share |
EBITDA 2025e Per Share |
EBITDA 2026e Per Share |
EBITDA 24 to 25e [%] |
EBITDA 25e to 26e [%] |
| 0.45618 |
0.49207 |
0.54763 |
7.9 |
11.3 |
0.09782 |
0.11061 |
0.12553 |
13.1 |
13.5 |
STP Revenue Per Share (2012–2027)
✅
STP Earnings before Interest, Tax, Depreciation and Amortisation (EBITDA) Per Share (2012–2027)
✅
STP Normalised Earnings Per Share (EPS) (2012–2027)
❌
Valuation
| Price To Sales |
Price To Book |
PER 2023 |
PER 2024 |
13Y Median PER Low |
PER 2025e |
13Y Median PER High |
PER 2026e |
Last Updated |
| 1.0 |
1.7 |
9.8 |
7.0 |
7.0 |
7.0 |
27.1 |
12.3 |
21/4/25 |
STP Yearly Price Earnings Ratio (PER) Highs and Lows
✅
STP Weekly Price Chart with Average True Range (ATR) Trailing Stop (10-Year View)
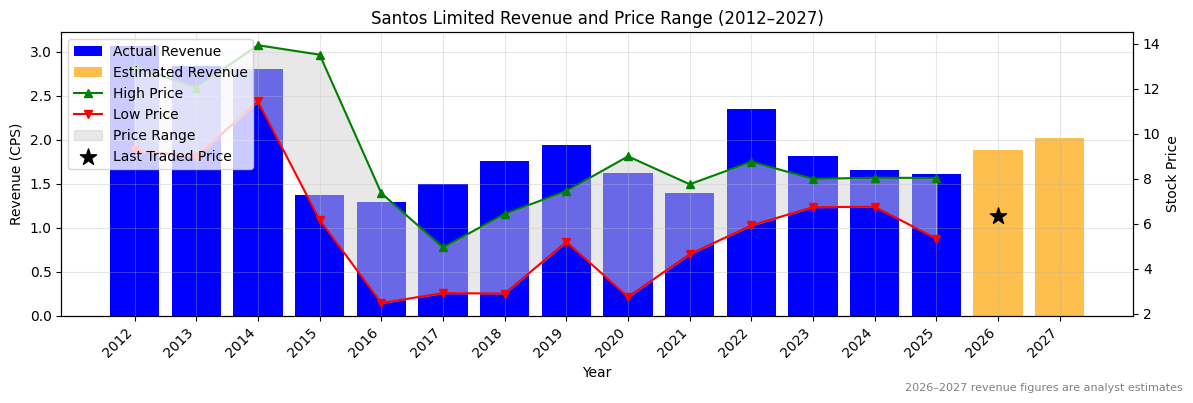
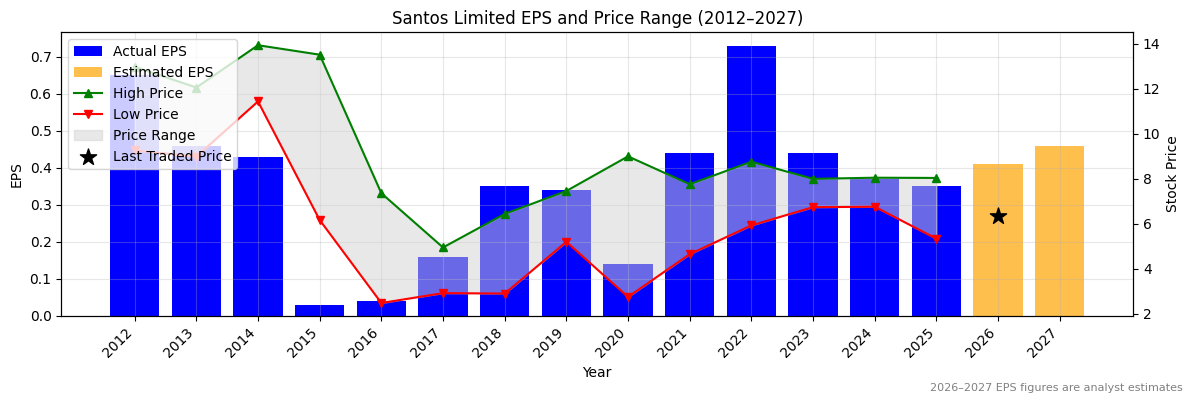
Ticker code: STO
STO Red Flags & Risk Indicators
❌
⚠️ RED FLAGS: 3 identified
- Increasing Shorts
- Falling Earnings
- Falling Revenues
Income Statement
| Revenue 2024 Per Share |
Revenue 2025e Per Share |
Revenue 2026e Per Share |
Revenue 24 to 25e [%] |
Revenue 25e to 26e [%] |
EBITDA 2024 Per Share |
EBITDA 2025e Per Share |
EBITDA 2026e Per Share |
EBITDA 24 to 25e [%] |
EBITDA 25e to 26e [%] |
| 1.65681 |
1.60609 |
1.88345 |
-3.1 |
17.3 |
1.11983 |
1.10692 |
1.31019 |
-1.2 |
18.4 |
STO Revenue Per Share (2012–2027)
❌
STO Earnings before Interest, Tax, Depreciation and Amortisation (EBITDA) Per Share (2012–2027)
❌
STO Normalised Earnings Per Share (EPS) (2012–2027)
❌
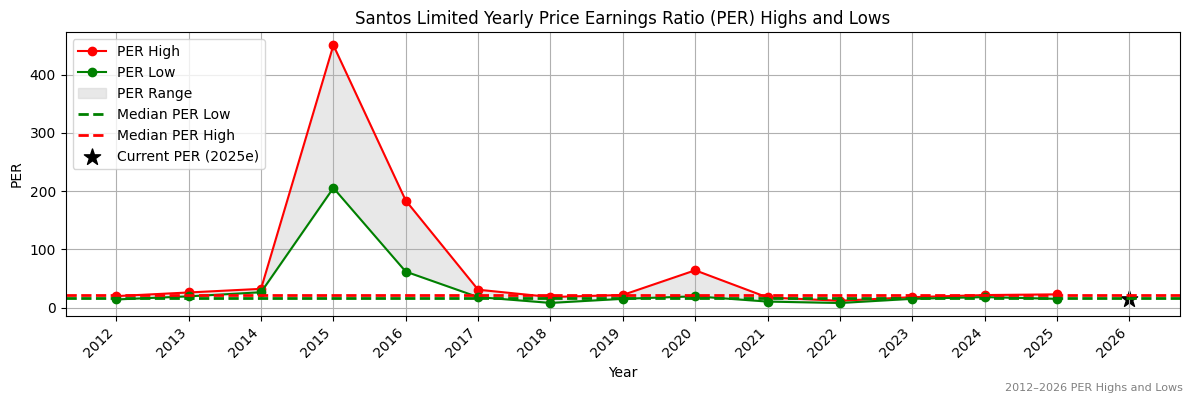
Valuation
| Price To Sales |
Price To Book |
PER 2023 |
PER 2024 |
13Y Median PER Low |
PER 2025e |
13Y Median PER High |
PER 2026e |
Last Updated |
| 3.9 |
1.3 |
14.3 |
17.1 |
16.8 |
18.0 |
22.5 |
15.4 |
16/6/25 |
STO Yearly Price Earnings Ratio (PER) Highs and Lows
✅
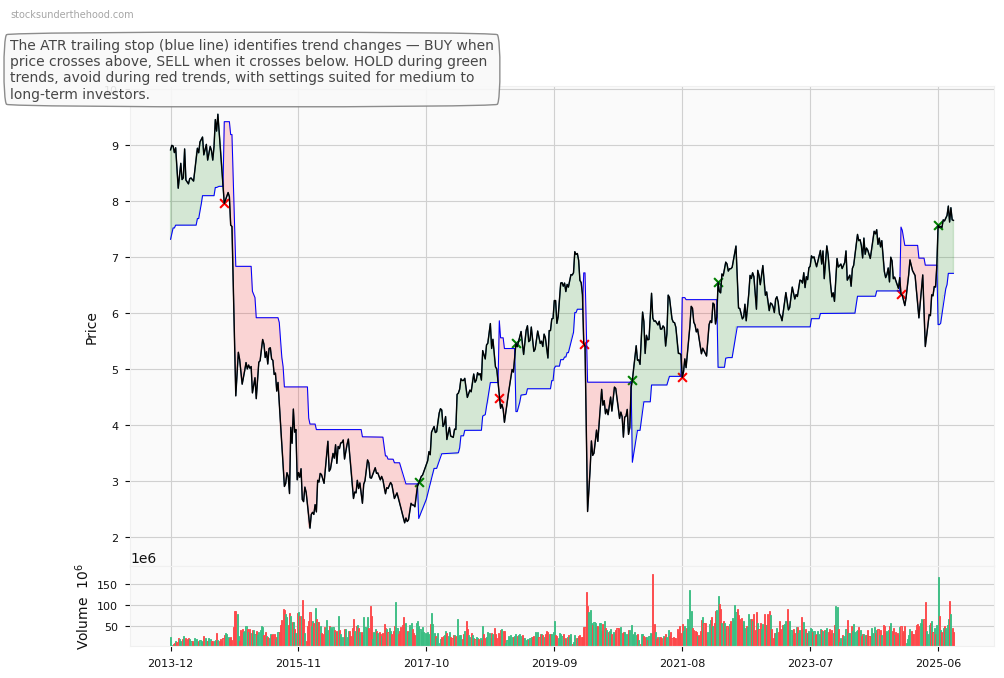
STO Weekly Price Chart with Average True Range (ATR) Trailing Stop (10-Year View)
Ticker code: XYZ
XYZ Red Flags & Risk Indicators
⚠️
⚠️ RED FLAGS: 1 identified
Income Statement
| Revenue 2024 Per Share |
Revenue 2025e Per Share |
Revenue 2026e Per Share |
Revenue 24 to 25e [%] |
Revenue 25e to 26e [%] |
EBITDA 2024 Per Share |
EBITDA 2025e Per Share |
EBITDA 2026e Per Share |
EBITDA 24 to 25e [%] |
EBITDA 25e to 26e [%] |
| 38.92375 |
44.36015 |
49.99703 |
14.0 |
12.7 |
4.8879 |
6.28671 |
7.66619 |
28.6 |
21.9 |
XYZ Revenue Per Share (2012–2027)
✅
XYZ Earnings before Interest, Tax, Depreciation and Amortisation (EBITDA) Per Share (2012–2027)
✅✅
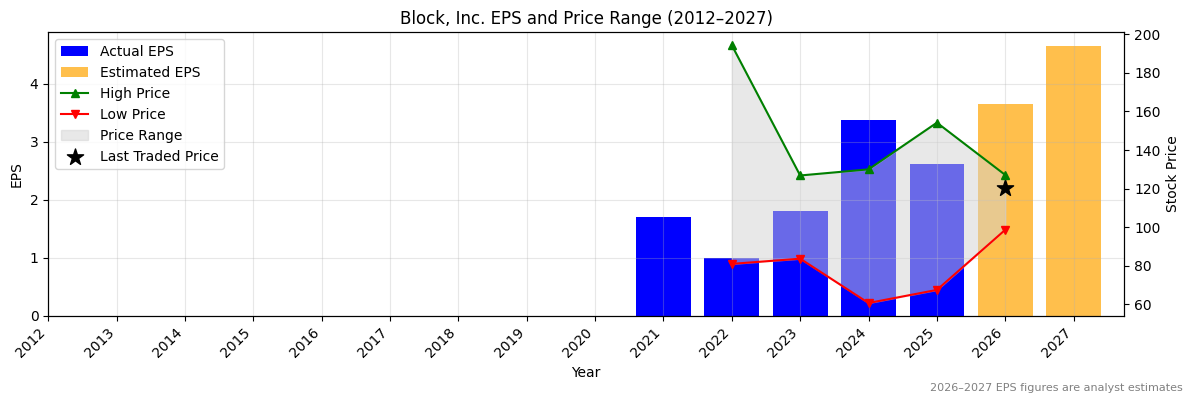
XYZ Normalised Earnings Per Share (EPS) (2012–2027)
❌
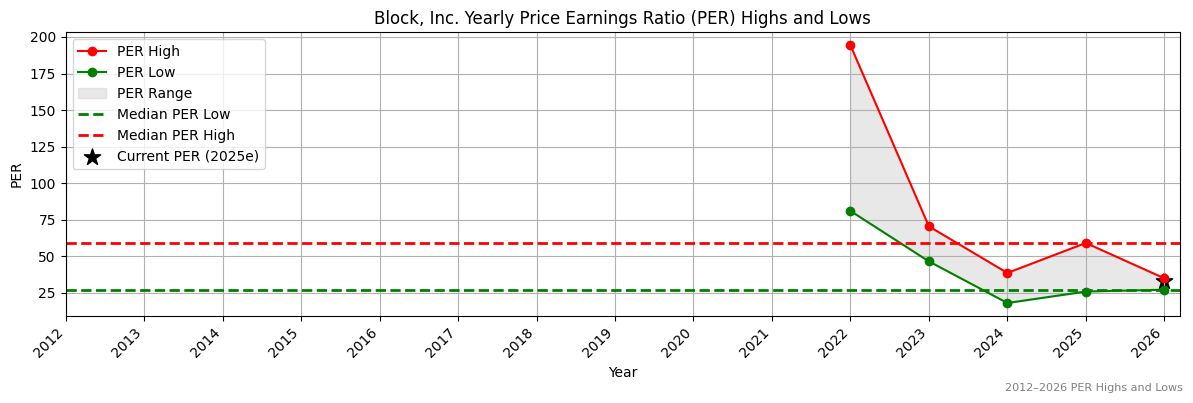
Valuation
| Price To Sales |
Price To Book |
PER 2023 |
PER 2024 |
13Y Median PER Low |
PER 2025e |
13Y Median PER High |
PER 2026e |
Last Updated |
| 2.9 |
3.1 |
62.9 |
33.6 |
27.1 |
43.4 |
59.1 |
31.1 |
29/8/25 |
XYZ Yearly Price Earnings Ratio (PER) Highs and Lows
✅
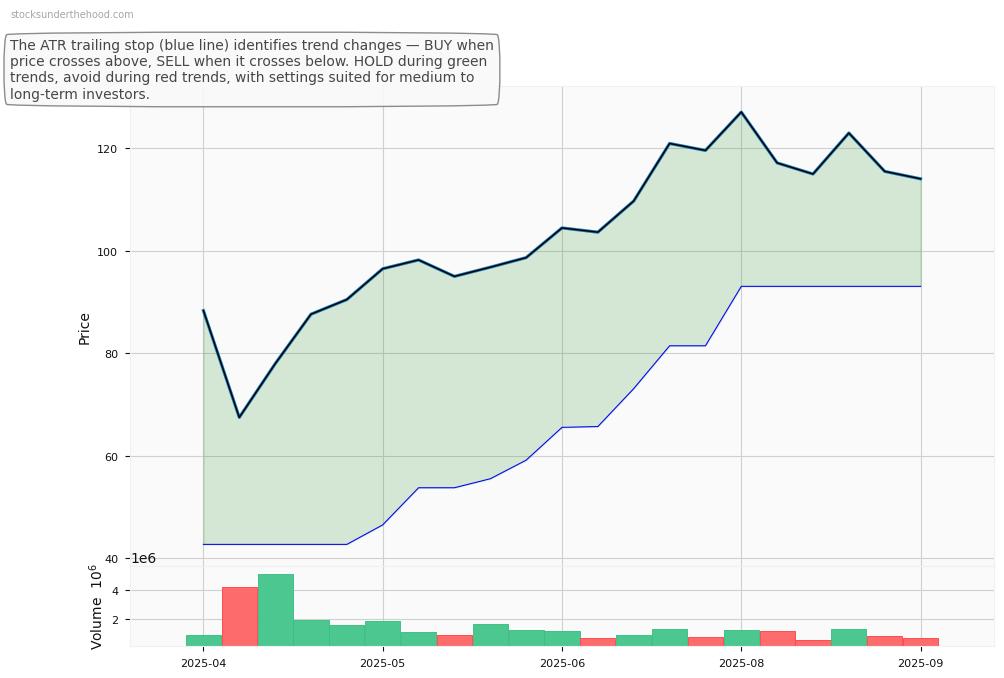
XYZ Weekly Price Chart with Average True Range (ATR) Trailing Stop (10-Year View)
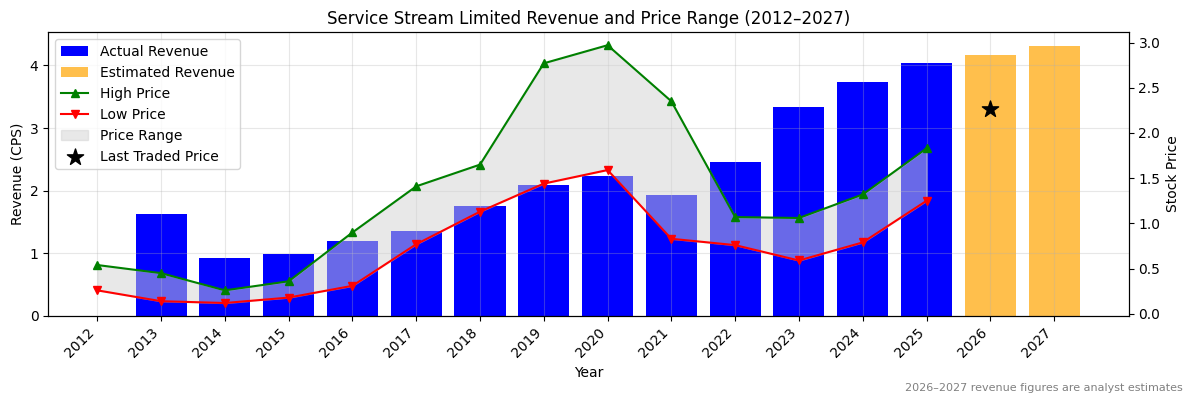
Ticker code: SSM
SSM Red Flags & Risk Indicators
⚠️
⚠️ RED FLAGS: 2 identified
- Falling Revenues
- High Relative Valuation
Income Statement
| Revenue 2024 Per Share |
Revenue 2025e Per Share |
Revenue 2026e Per Share |
Revenue 24 to 25e [%] |
Revenue 25e to 26e [%] |
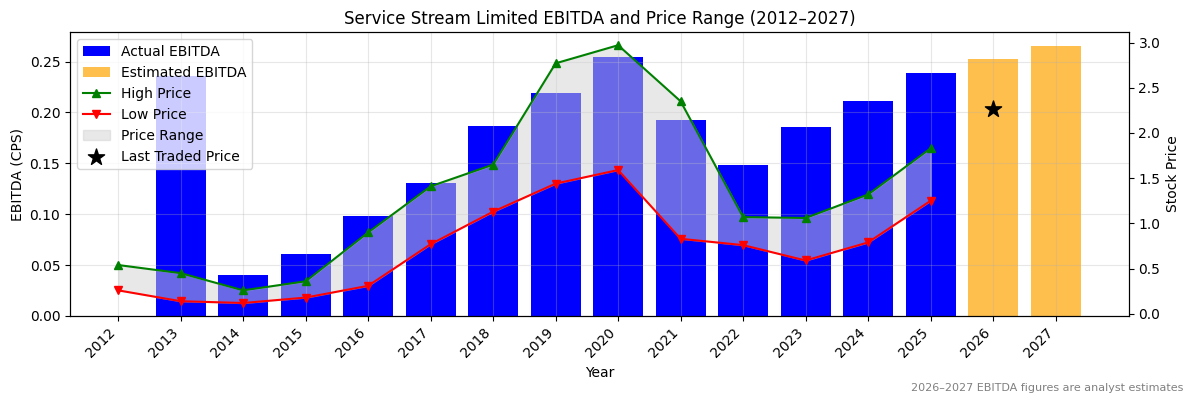
EBITDA 2024 Per Share |
EBITDA 2025e Per Share |
EBITDA 2026e Per Share |
EBITDA 24 to 25e [%] |
EBITDA 25e to 26e [%] |
| 3.73956 |
4.03854 |
4.16403 |
8.0 |
3.1 |
0.21084 |
0.23846 |
0.25278 |
13.1 |
6.0 |
SSM Revenue Per Share (2012–2027)
✅
SSM Earnings before Interest, Tax, Depreciation and Amortisation (EBITDA) Per Share (2012–2027)
✅
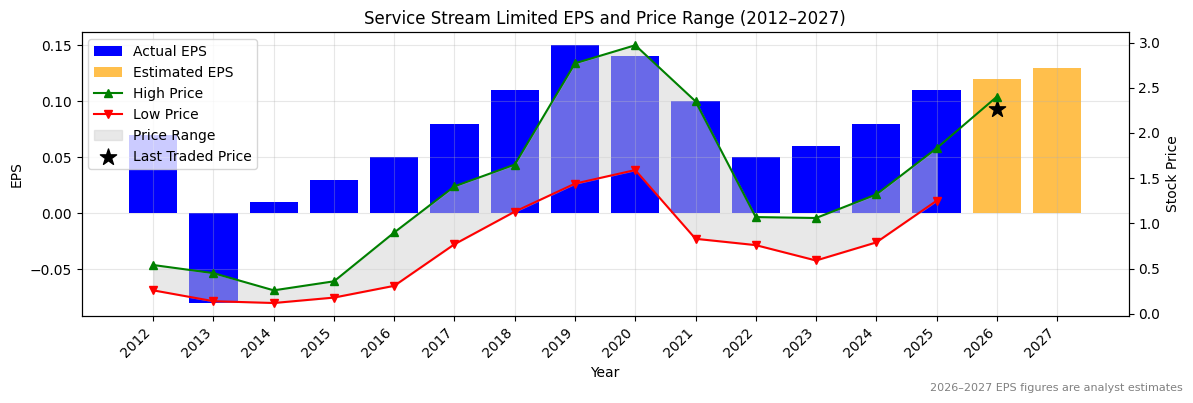
SSM Normalised Earnings Per Share (EPS) (2012–2027)
✅✅
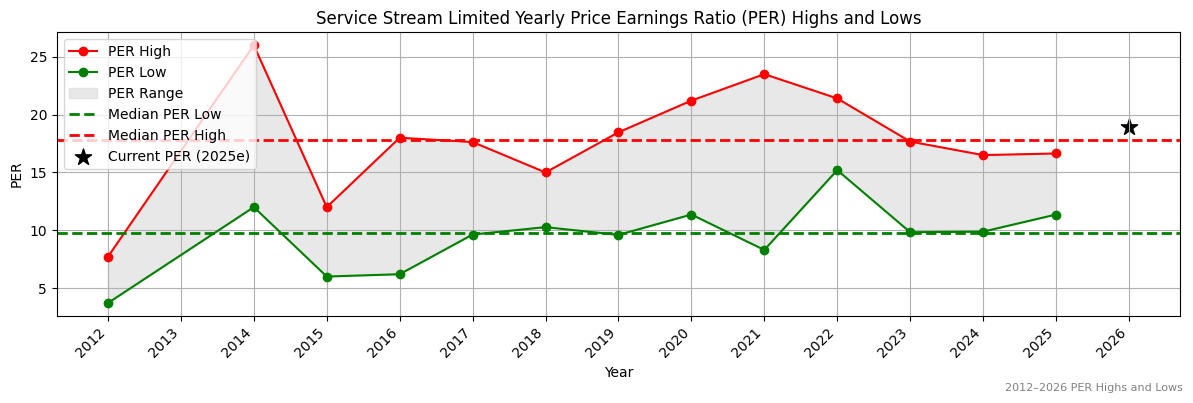
Valuation
| Price To Sales |
Price To Book |
PER 2023 |
PER 2024 |
13Y Median PER Low |
PER 2025e |
13Y Median PER High |
PER 2026e |
Last Updated |
| 0.6 |
2.7 |
37.8 |
28.4 |
9.8 |
20.6 |
17.8 |
18.9 |
21/4/25 |
SSM Yearly Price Earnings Ratio (PER) Highs and Lows
❌
SSM Weekly Price Chart with Average True Range (ATR) Trailing Stop (10-Year View)
Ticker code: SSG
SSG Red Flags & Risk Indicators
❌
⚠️ RED FLAGS: 3 identified
- Low Operating Margin
- Falling Earnings
- High Relative Valuation
Income Statement
| Revenue 2024 Per Share |
Revenue 2025e Per Share |
Revenue 2026e Per Share |
Revenue 24 to 25e [%] |
Revenue 25e to 26e [%] |
EBITDA 2024 Per Share |
EBITDA 2025e Per Share |
EBITDA 2026e Per Share |
EBITDA 24 to 25e [%] |
EBITDA 25e to 26e [%] |
| 1.82401 |
None |
None |
None |
None |
0.3299 |
0.3618 |
None |
9.7 |
None |
SSG Revenue Per Share (2012–2027)
SSG Earnings before Interest, Tax, Depreciation and Amortisation (EBITDA) Per Share (2012–2027)
✅
SSG Normalised Earnings Per Share (EPS) (2012–2027)
❌
Valuation
| Price To Sales |
Price To Book |
PER 2023 |
PER 2024 |
13Y Median PER Low |
PER 2025e |
13Y Median PER High |
PER 2026e |
Last Updated |
| 0.8 |
2.1 |
10.8 |
11.7 |
7.0 |
11.7 |
10.3 |
11.7 |
8/12/22 |
SSG Yearly Price Earnings Ratio (PER) Highs and Lows
❌
SSG Weekly Price Chart with Average True Range (ATR) Trailing Stop (10-Year View)
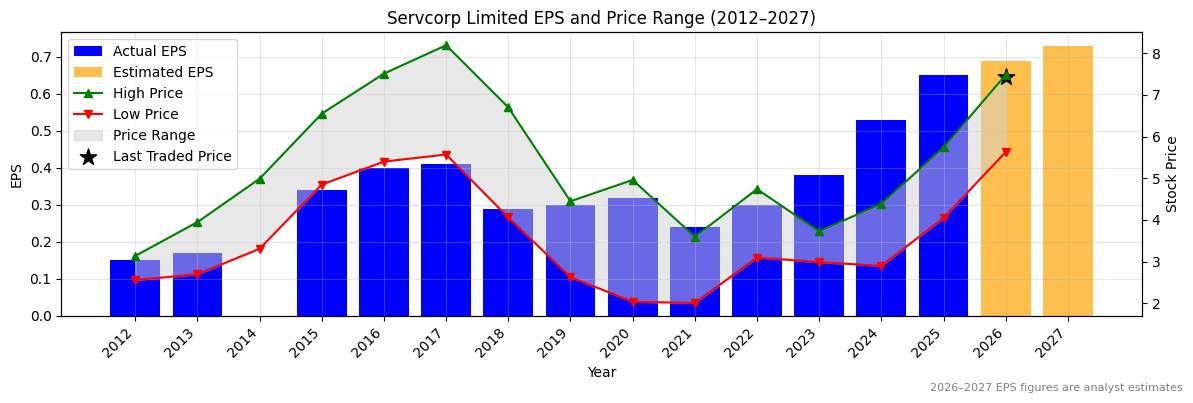
Ticker code: SRV
SRV Red Flags & Risk Indicators
⚠️
⚠️ RED FLAGS: 1 identified
Income Statement
| Revenue 2024 Per Share |
Revenue 2025e Per Share |
Revenue 2026e Per Share |
Revenue 24 to 25e [%] |
Revenue 25e to 26e [%] |
EBITDA 2024 Per Share |
EBITDA 2025e Per Share |
EBITDA 2026e Per Share |
EBITDA 24 to 25e [%] |
EBITDA 25e to 26e [%] |
| 3.19153 |
3.54033 |
3.75398 |
10.9 |
6.0 |
0.74812 |
0.90712 |
2.45733 |
21.3 |
170.9 |
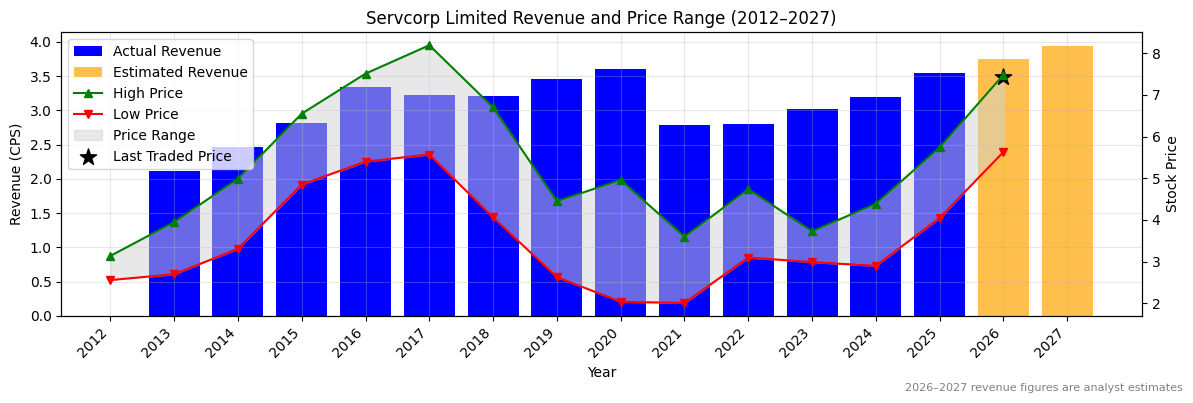
SRV Revenue Per Share (2012–2027)
✅
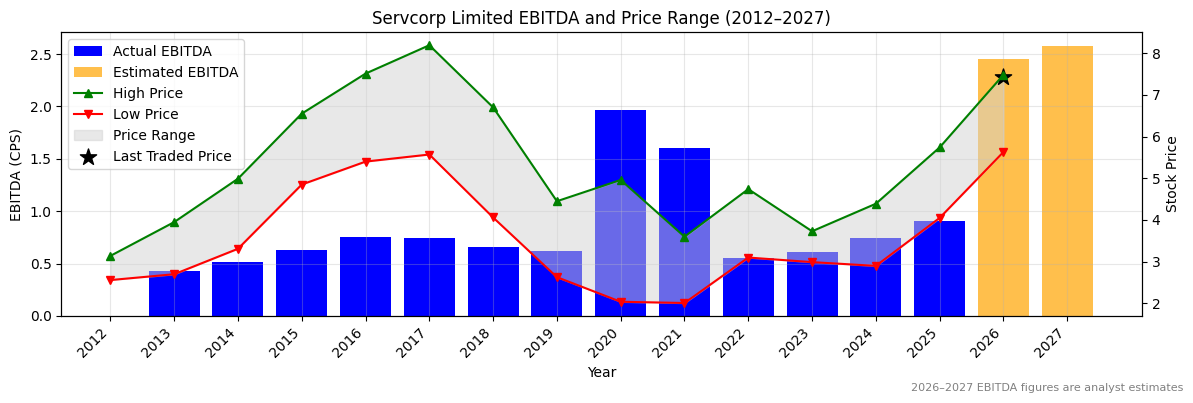
SRV Earnings before Interest, Tax, Depreciation and Amortisation (EBITDA) Per Share (2012–2027)
✅✅
SRV Normalised Earnings Per Share (EPS) (2012–2027)
✅✅
Valuation
| Price To Sales |
Price To Book |
PER 2023 |
PER 2024 |
13Y Median PER Low |
PER 2025e |
13Y Median PER High |
PER 2026e |
Last Updated |
| 2.1 |
3.1 |
19.4 |
13.9 |
9.6 |
11.4 |
15.7 |
10.7 |
20/9/25 |
SRV Yearly Price Earnings Ratio (PER) Highs and Lows
✅
SRV Weekly Price Chart with Average True Range (ATR) Trailing Stop (10-Year View)
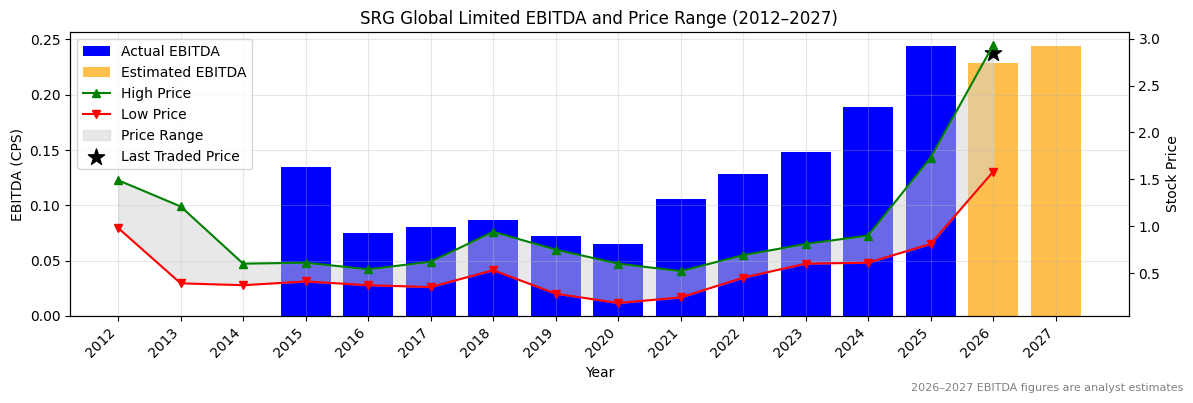
Ticker code: SRG
SRG Red Flags & Risk Indicators
⚠️
⚠️ RED FLAGS: 1 identified
Income Statement
| Revenue 2024 Per Share |
Revenue 2025e Per Share |
Revenue 2026e Per Share |
Revenue 24 to 25e [%] |
Revenue 25e to 26e [%] |
EBITDA 2024 Per Share |
EBITDA 2025e Per Share |
EBITDA 2026e Per Share |
EBITDA 24 to 25e [%] |
EBITDA 25e to 26e [%] |
| 2.05114 |
2.53846 |
2.36059 |
23.8 |
-7.0 |
0.18895 |
0.24381 |
0.22858 |
29.0 |
-6.2 |
SRG Revenue Per Share (2012–2027)
✅✅
SRG Earnings before Interest, Tax, Depreciation and Amortisation (EBITDA) Per Share (2012–2027)
✅✅
SRG Normalised Earnings Per Share (EPS) (2012–2027)
✅
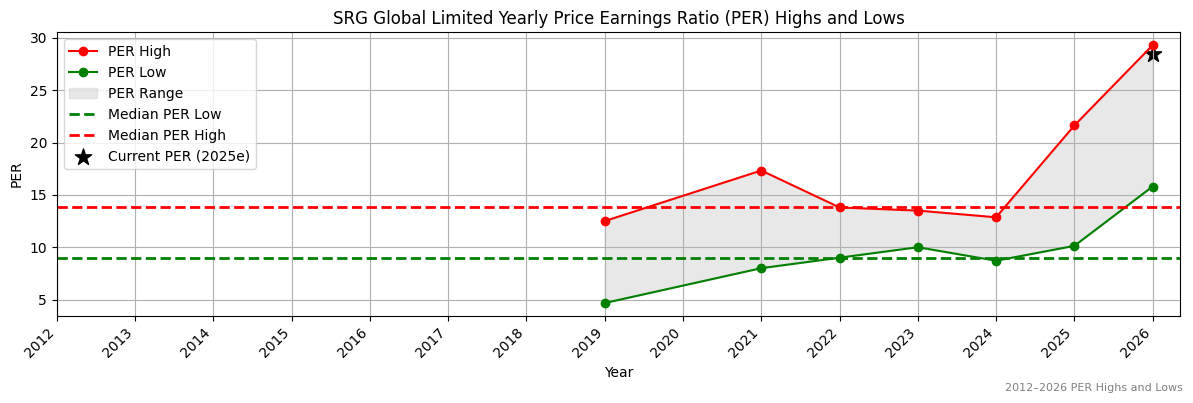
Valuation
| Price To Sales |
Price To Book |
PER 2023 |
PER 2024 |
13Y Median PER Low |
PER 2025e |
13Y Median PER High |
PER 2026e |
Last Updated |
| 1.3 |
4.2 |
45.8 |
39.3 |
9.0 |
34.4 |
13.8 |
27.5 |
4/10/25 |
SRG Yearly Price Earnings Ratio (PER) Highs and Lows
❌
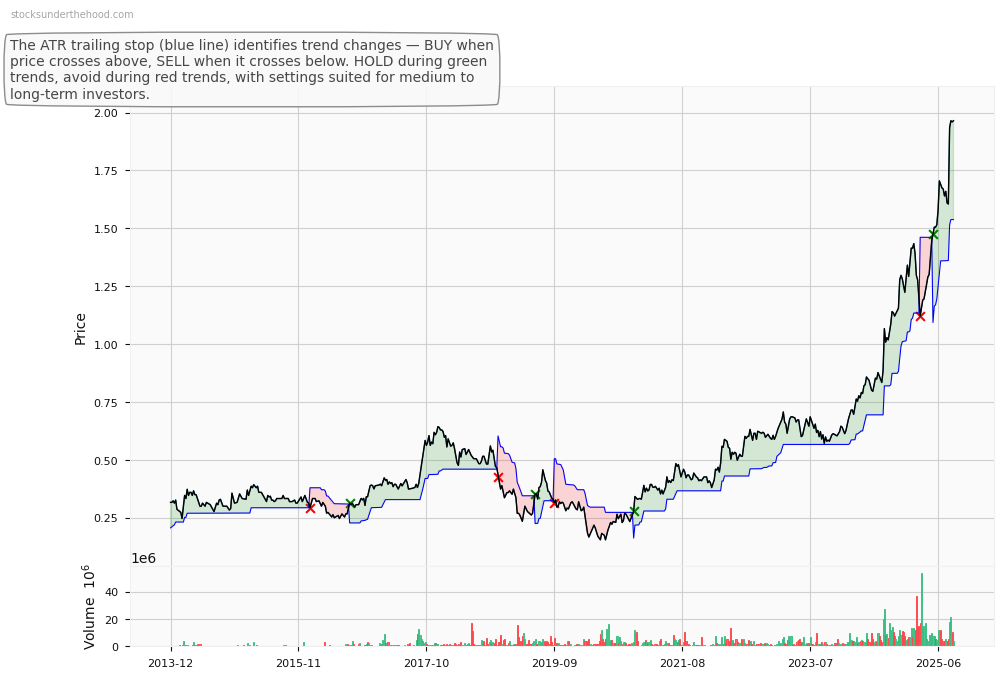
SRG Weekly Price Chart with Average True Range (ATR) Trailing Stop (10-Year View)
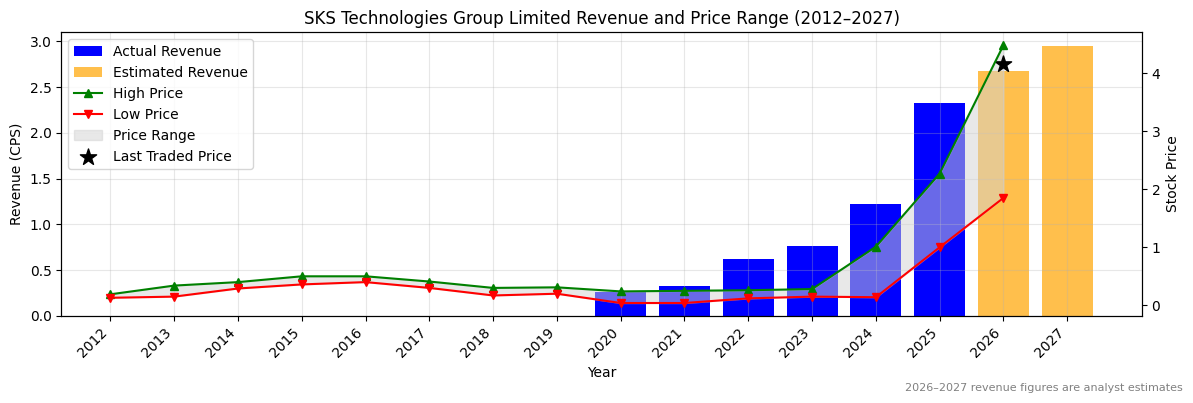
Ticker code: SKS
SKS Red Flags & Risk Indicators
⚠️
⚠️ RED FLAGS: 1 identified
Income Statement
| Revenue 2024 Per Share |
Revenue 2025e Per Share |
Revenue 2026e Per Share |
Revenue 24 to 25e [%] |
Revenue 25e to 26e [%] |
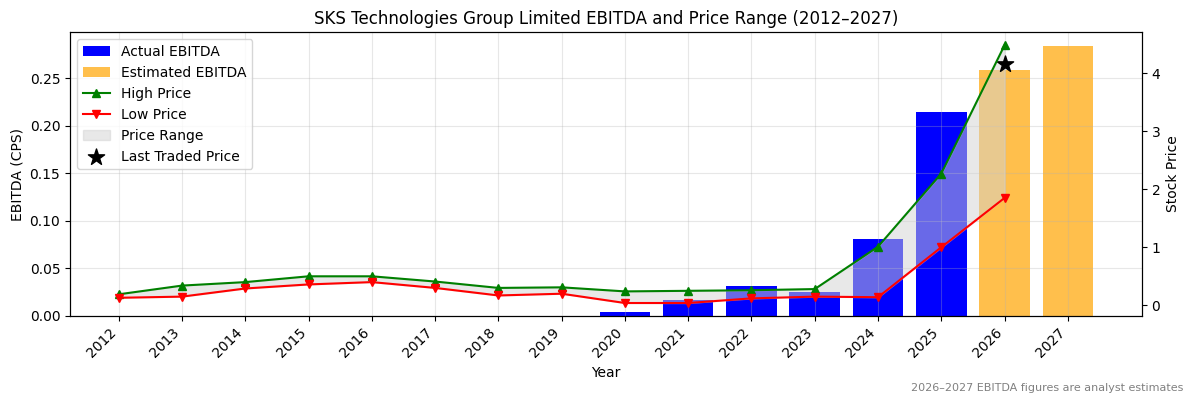
EBITDA 2024 Per Share |
EBITDA 2025e Per Share |
EBITDA 2026e Per Share |
EBITDA 24 to 25e [%] |
EBITDA 25e to 26e [%] |
| 1.21922 |
2.32721 |
2.67871 |
90.9 |
15.1 |
0.08059 |
0.21465 |
0.25805 |
166.3 |
20.2 |
SKS Revenue Per Share (2012–2027)
✅✅
SKS Earnings before Interest, Tax, Depreciation and Amortisation (EBITDA) Per Share (2012–2027)
✅✅
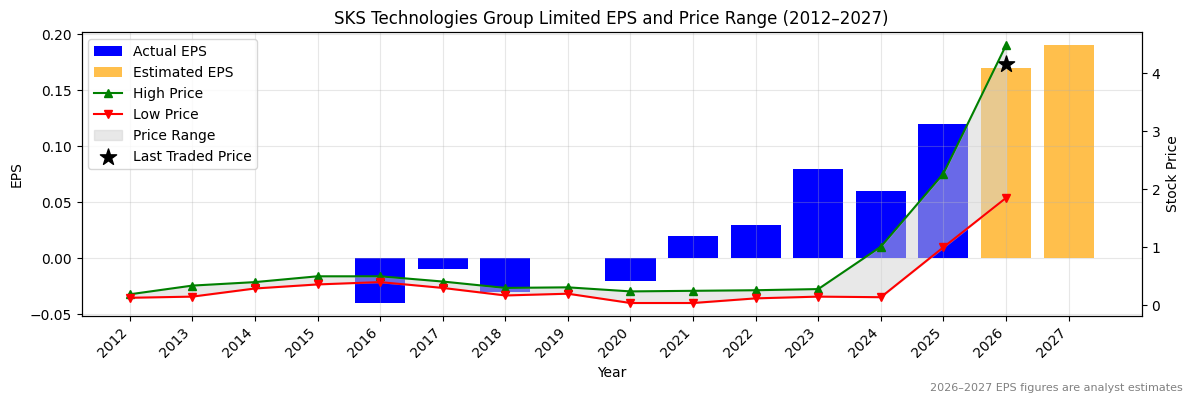
SKS Normalised Earnings Per Share (EPS) (2012–2027)
✅✅
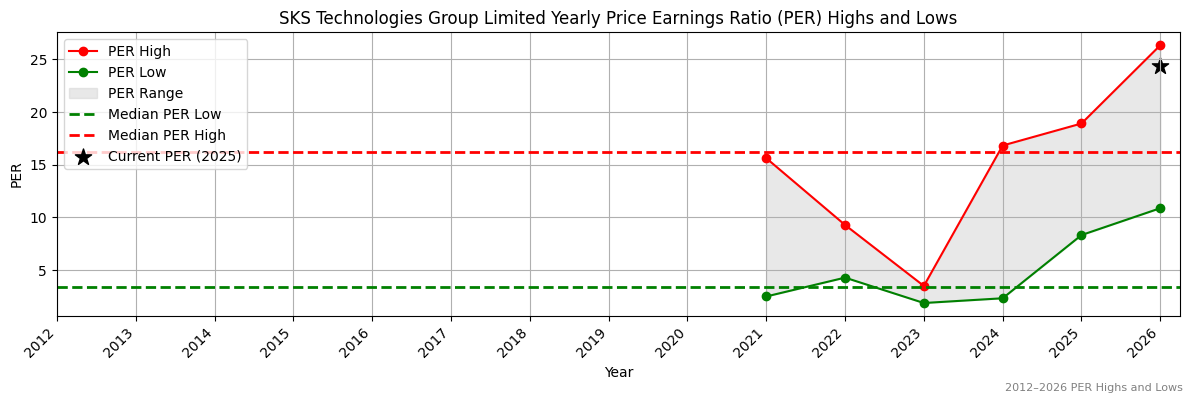
Valuation
| Price To Sales |
Price To Book |
PER 2023 |
PER 2024 |
13Y Median PER Low |
PER 2025e |
13Y Median PER High |
PER 2026e |
Last Updated |
| 1.7 |
17.7 |
47.5 |
63.3 |
3.4 |
31.7 |
16.2 |
22.4 |
20/9/25 |
SKS Yearly Price Earnings Ratio (PER) Highs and Lows
❌
SKS Weekly Price Chart with Average True Range (ATR) Trailing Stop (10-Year View)
Ticker code: SPK
SPK Red Flags & Risk Indicators
❌
⚠️ RED FLAGS: 3 identified
- Increasing Shorts
- Falling Earnings
- More Net Debt Than Equity
Income Statement
| Revenue 2024 Per Share |
Revenue 2025e Per Share |
Revenue 2026e Per Share |
Revenue 24 to 25e [%] |
Revenue 25e to 26e [%] |
EBITDA 2024 Per Share |
EBITDA 2025e Per Share |
EBITDA 2026e Per Share |
EBITDA 24 to 25e [%] |
EBITDA 25e to 26e [%] |
| 2.17702 |
None |
None |
None |
None |
0.67241 |
0.69107 |
None |
2.8 |
None |
SPK Revenue Per Share (2012–2027)
SPK Earnings before Interest, Tax, Depreciation and Amortisation (EBITDA) Per Share (2012–2027)
✅
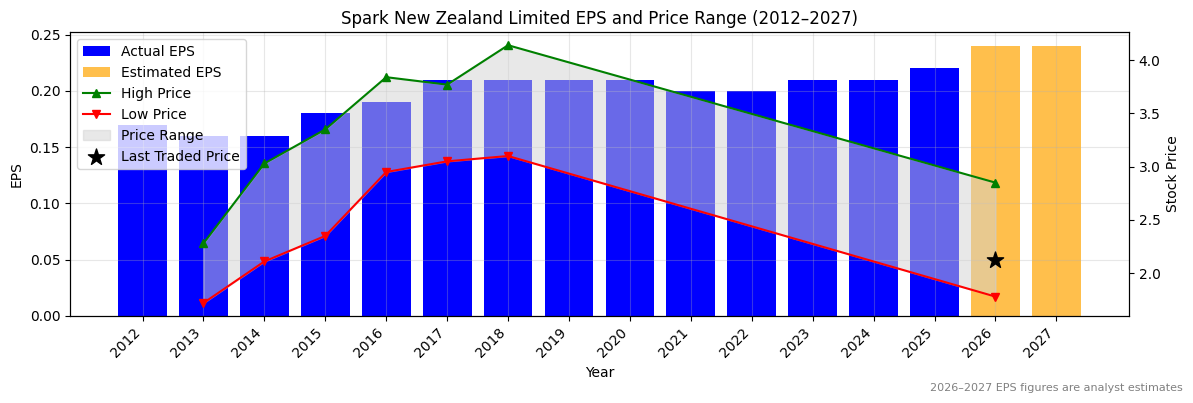
SPK Normalised Earnings Per Share (EPS) (2012–2027)
✅
Valuation
| Price To Sales |
Price To Book |
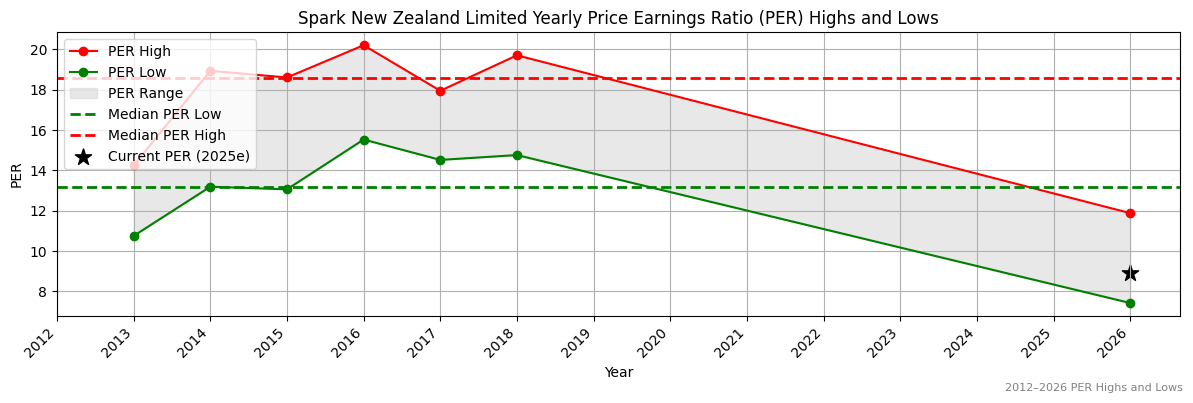
PER 2023 |
PER 2024 |
13Y Median PER Low |
PER 2025e |
13Y Median PER High |
PER 2026e |
Last Updated |
| 1.1 |
2.7 |
10.2 |
10.2 |
13.2 |
9.7 |
18.6 |
8.9 |
13/11/23 |
SPK Yearly Price Earnings Ratio (PER) Highs and Lows
✅✅
SPK Weekly Price Chart with Average True Range (ATR) Trailing Stop (10-Year View)
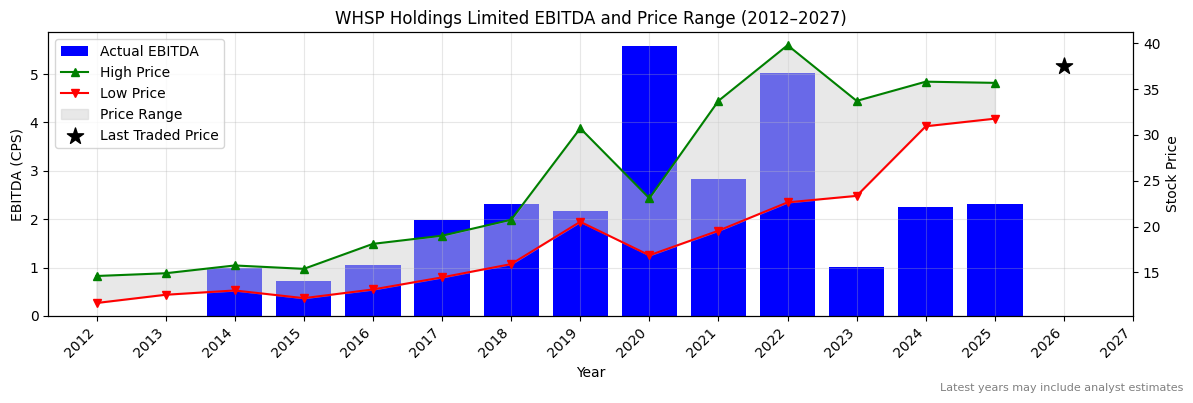
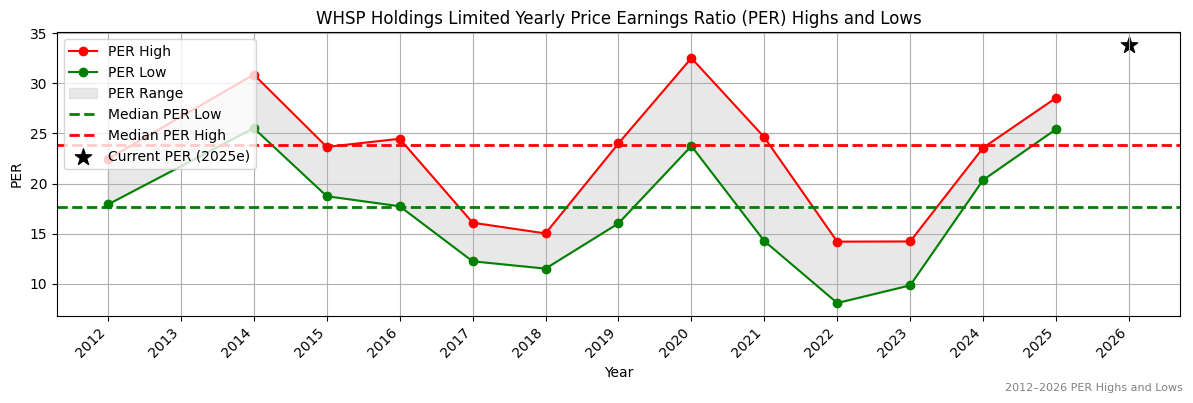
Ticker code: SOL
SOL Red Flags & Risk Indicators
⚠️
⚠️ RED FLAGS: 2 identified
- Falling Earnings
- High Relative Valuation
Income Statement
| Revenue 2024 Per Share |
Revenue 2025e Per Share |
Revenue 2026e Per Share |
Revenue 24 to 25e [%] |
Revenue 25e to 26e [%] |
EBITDA 2024 Per Share |
EBITDA 2025e Per Share |
EBITDA 2026e Per Share |
EBITDA 24 to 25e [%] |
EBITDA 25e to 26e [%] |
| 1.9891 |
None |
None |
None |
None |
2.25782 |
2.31066 |
None |
2.3 |
None |
SOL Revenue Per Share (2012–2027)
SOL Earnings before Interest, Tax, Depreciation and Amortisation (EBITDA) Per Share (2012–2027)
✅
SOL Normalised Earnings Per Share (EPS) (2012–2027)
❌
Valuation
| Price To Sales |
Price To Book |
PER 2023 |
PER 2024 |
13Y Median PER Low |
PER 2025e |
13Y Median PER High |
PER 2026e |
Last Updated |
| 10.4 |
1.5 |
16.3 |
25.5 |
17.7 |
31.0 |
23.7 |
34.9 |
21/4/25 |
SOL Yearly Price Earnings Ratio (PER) Highs and Lows
❌
SOL Weekly Price Chart with Average True Range (ATR) Trailing Stop (10-Year View)