Ticker code: SNOW
SNOW Red Flags & Risk Indicators
✅
⚠️ RED FLAGS: 0 identified
No red flags detected.
Income Statement
| Revenue 2024 Per Share |
Revenue 2025e Per Share |
Revenue 2026e Per Share |
Revenue 24 to 25e [%] |
Revenue 25e to 26e [%] |
EBITDA 2024 Per Share |
EBITDA 2025e Per Share |
EBITDA 2026e Per Share |
EBITDA 24 to 25e [%] |
EBITDA 25e to 26e [%] |
| None |
None |
None |
None |
None |
None |
None |
None |
None |
None |
SNOW Revenue Per Share (2012–2027)
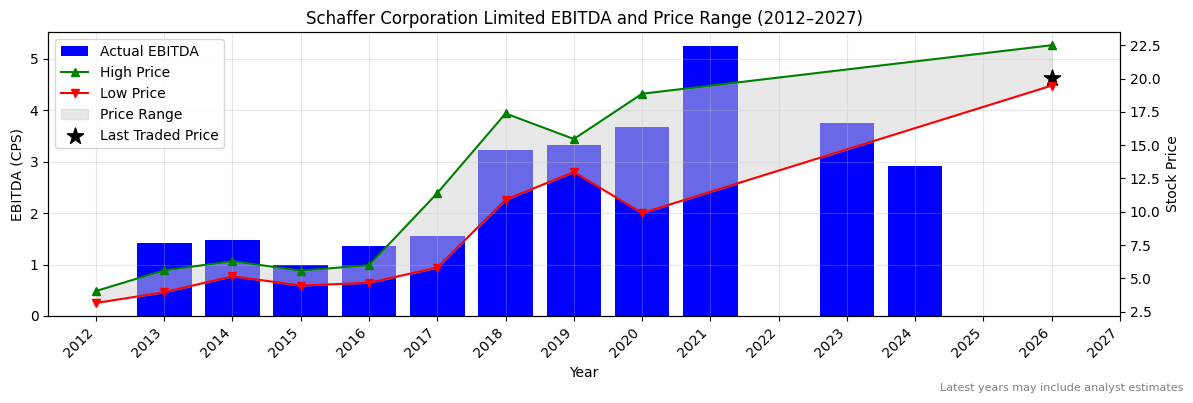
SNOW Earnings before Interest, Tax, Depreciation and Amortisation (EBITDA) Per Share (2012–2027)
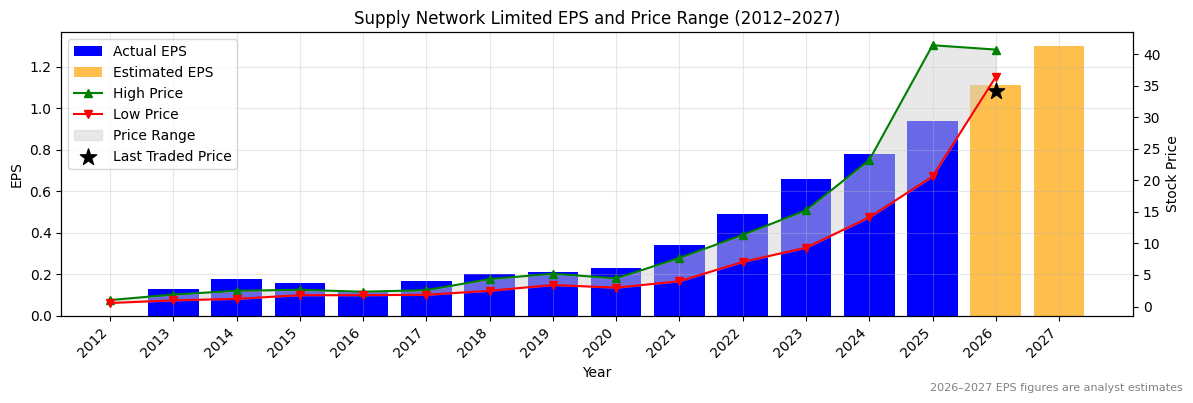
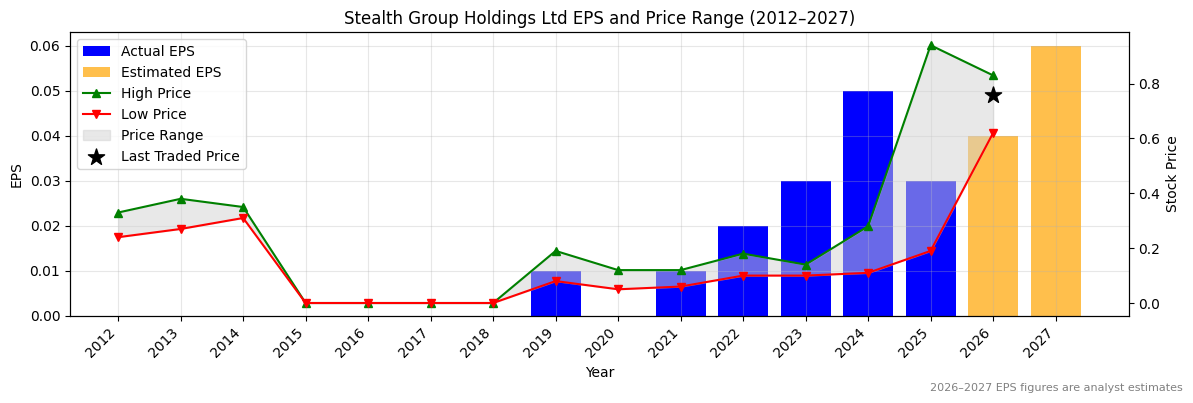
SNOW Normalised Earnings Per Share (EPS) (2012–2027)
Valuation
| Price To Sales |
Price To Book |
PER 2023 |
PER 2024 |
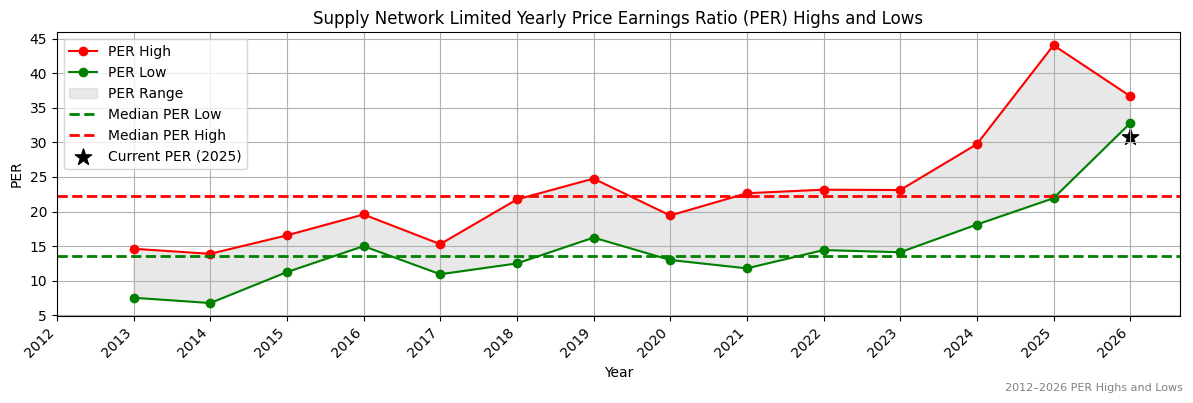
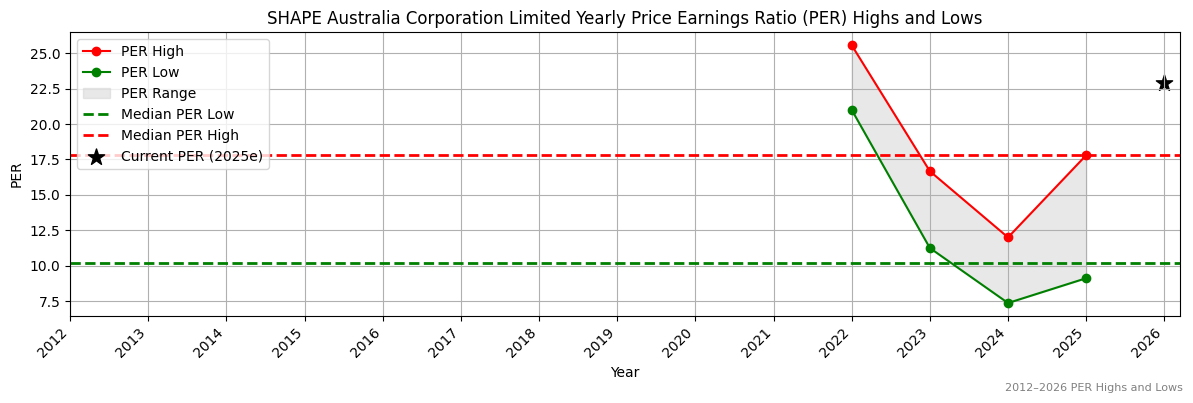
13Y Median PER Low |
PER 2025e |
13Y Median PER High |
PER 2026e |
Last Updated |
| 22.3 |
38.7 |
None |
None |
None |
None |
None |
None |
None |
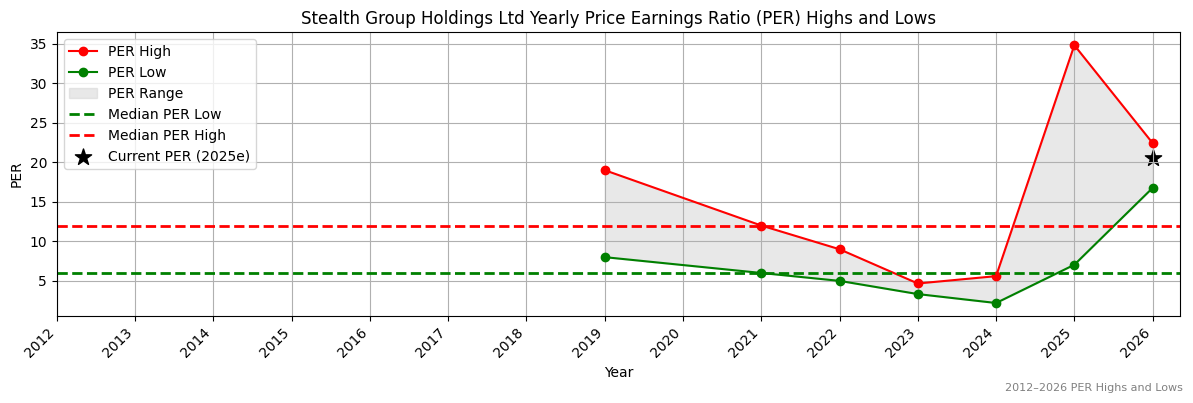
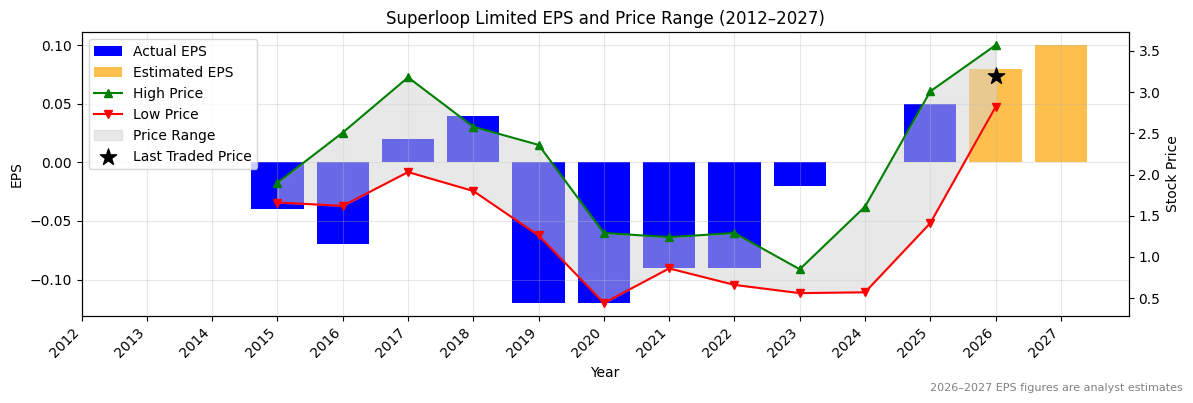
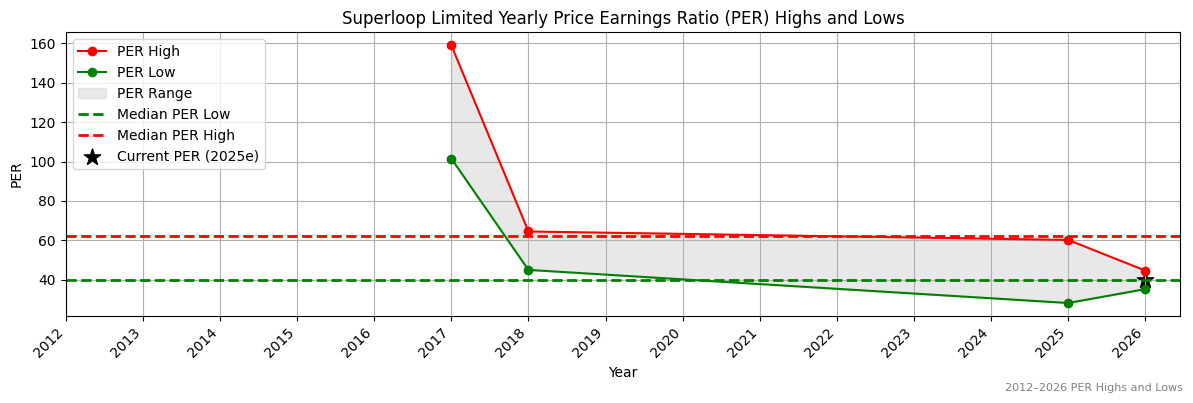
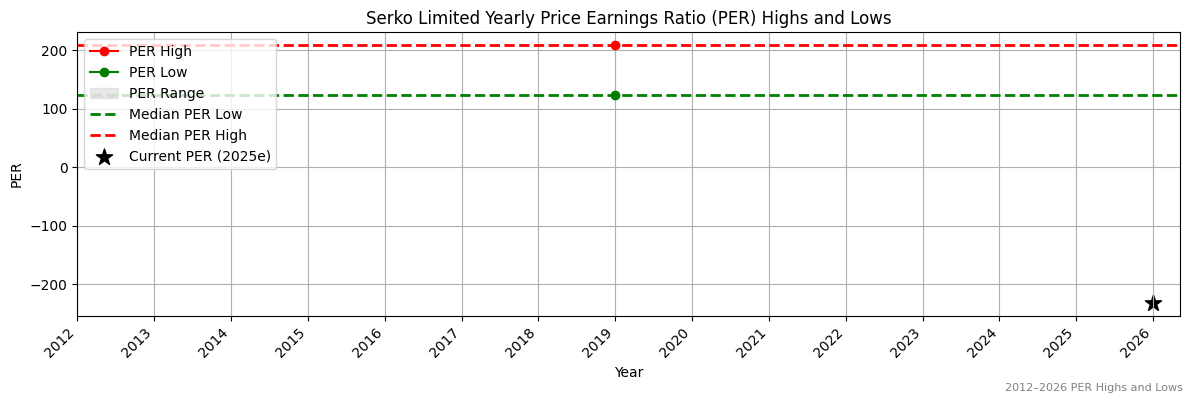
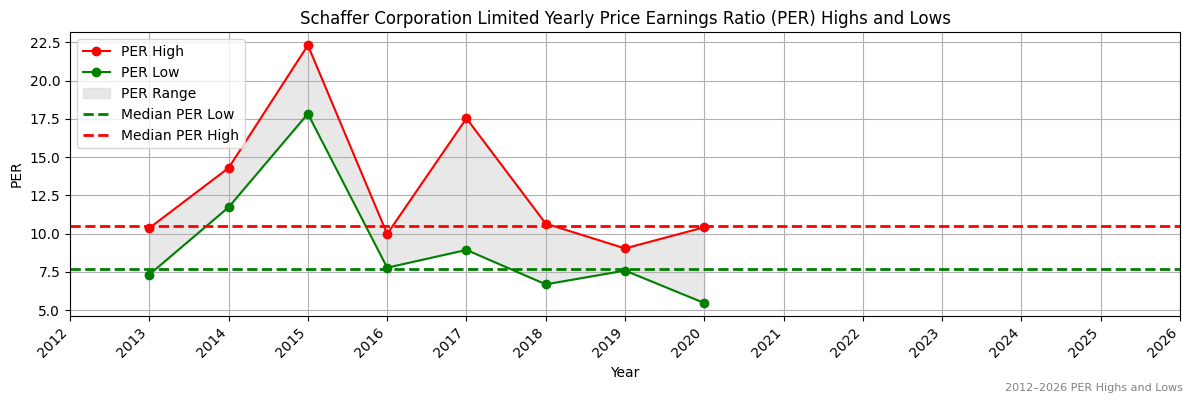
SNOW Yearly Price Earnings Ratio (PER) Highs and Lows
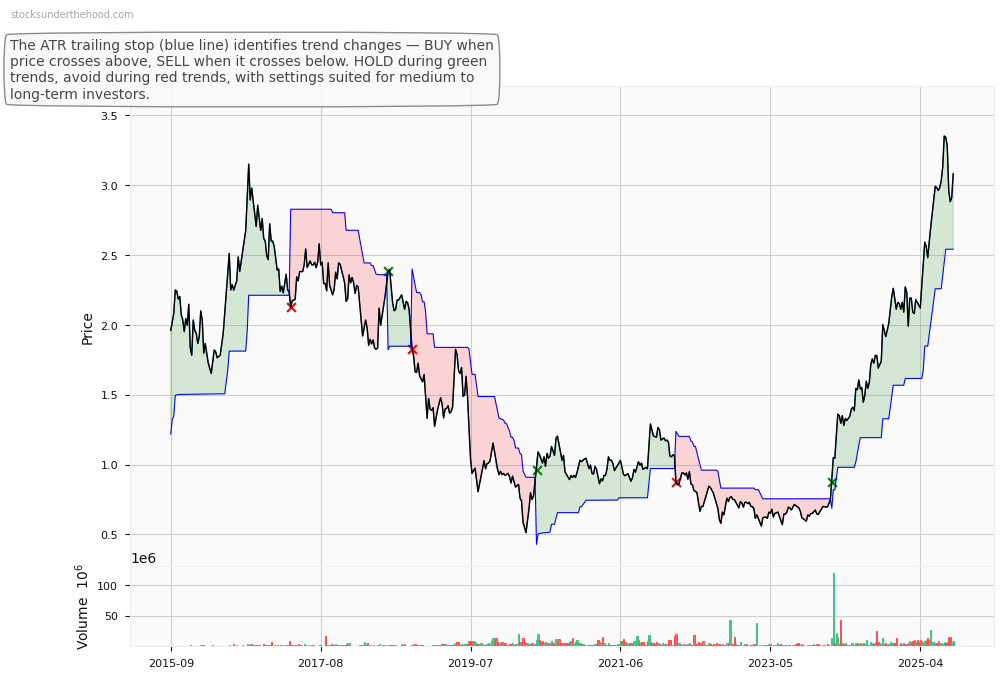
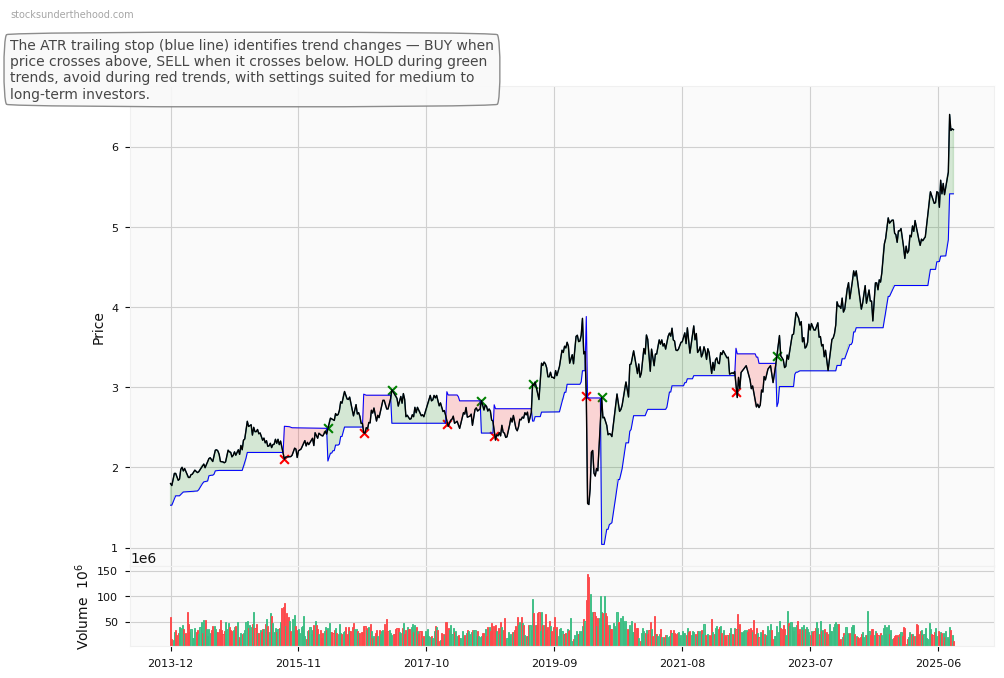
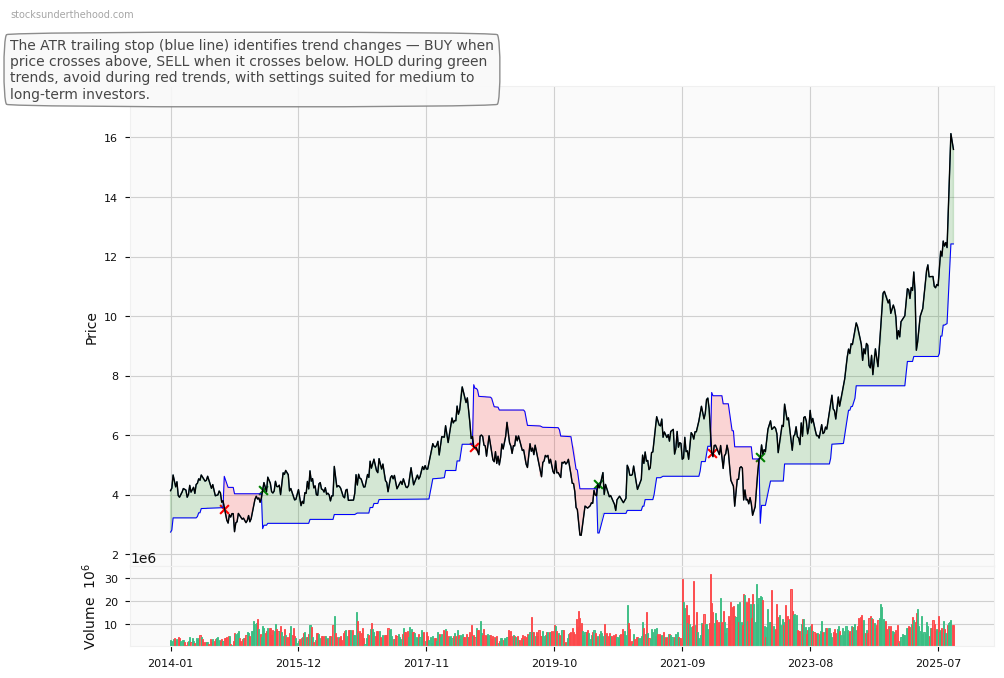
SNOW Weekly Price Chart with Average True Range (ATR) Trailing Stop (10-Year View)
Ticker code: SNL
SNL Red Flags & Risk Indicators
⚠️
⚠️ RED FLAGS: 2 identified
- Increasing Shorts
- High Relative Valuation
Income Statement
| Revenue 2024 Per Share |
Revenue 2025e Per Share |
Revenue 2026e Per Share |
Revenue 24 to 25e [%] |
Revenue 25e to 26e [%] |
EBITDA 2024 Per Share |
EBITDA 2025e Per Share |
EBITDA 2026e Per Share |
EBITDA 24 to 25e [%] |
EBITDA 25e to 26e [%] |
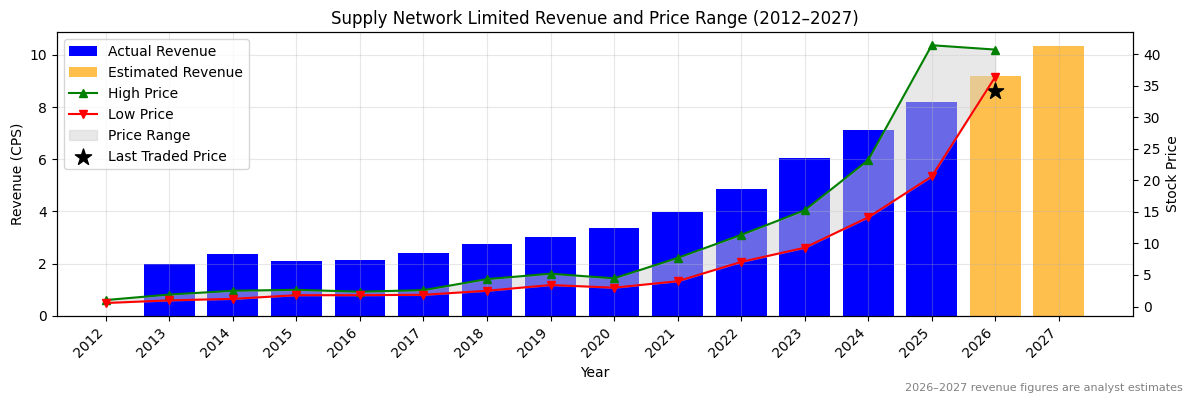
| 7.12 |
8.20331 |
9.19988 |
15.2 |
12.1 |
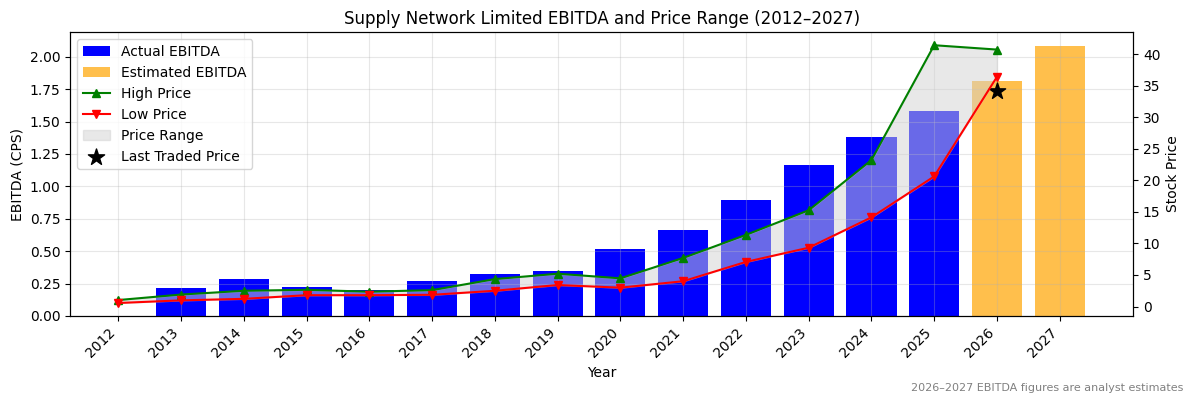
1.37812 |
1.58199 |
1.81058 |
14.8 |
14.4 |
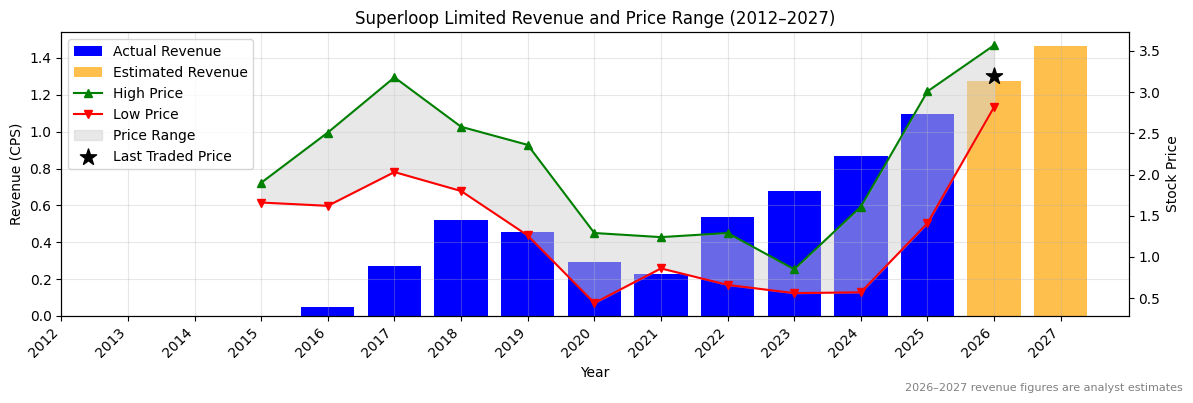
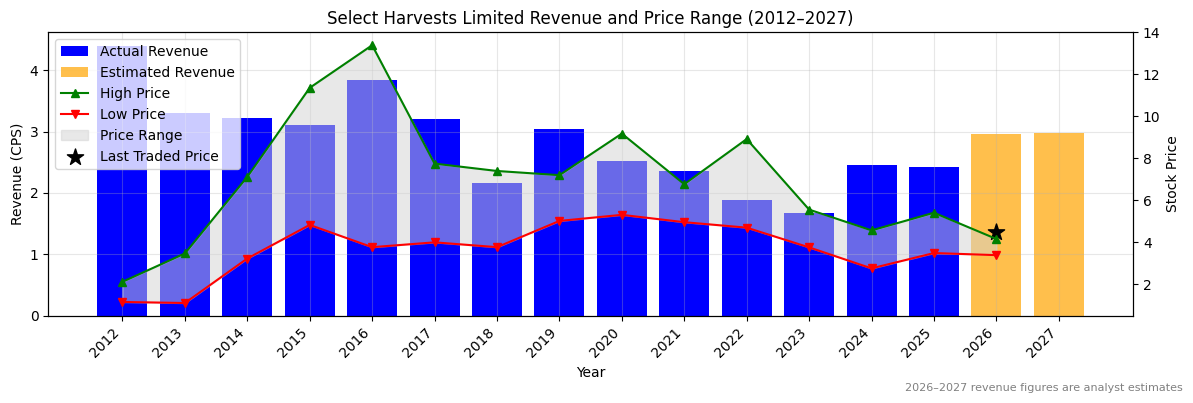
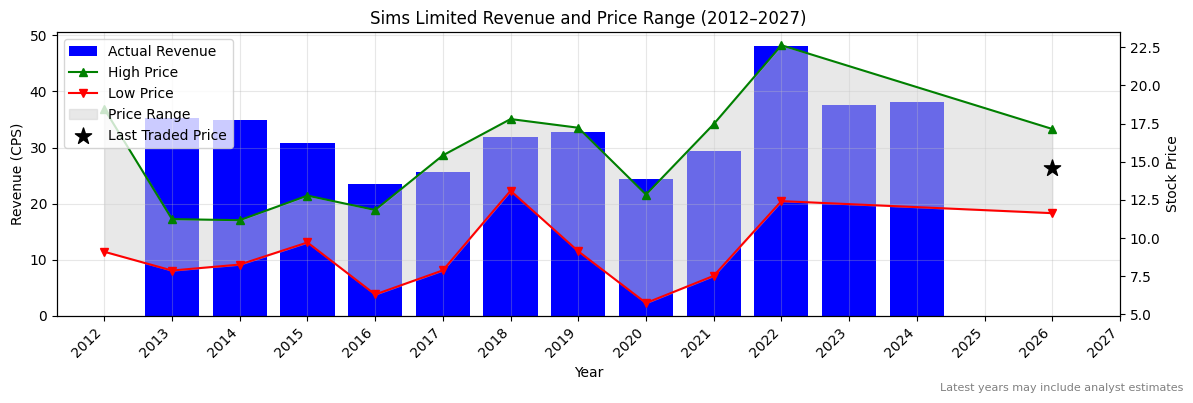
SNL Revenue Per Share (2012–2027)
✅
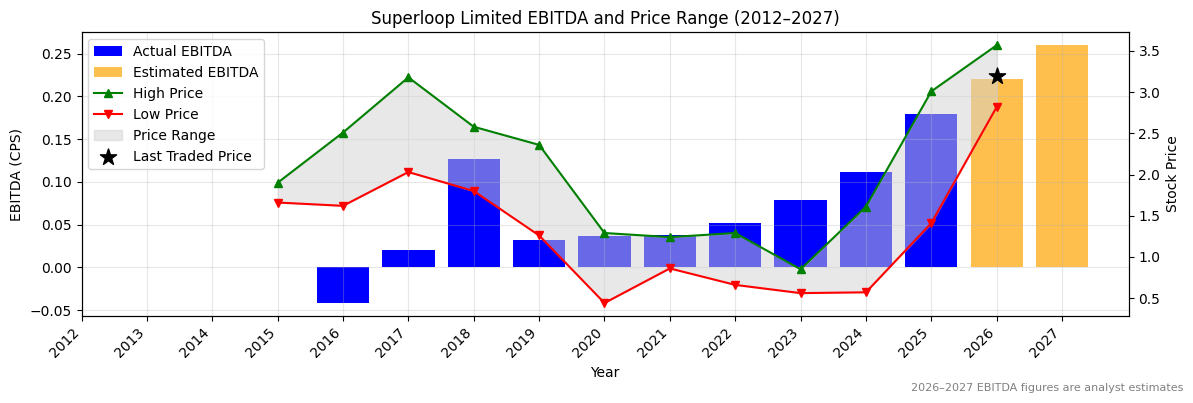
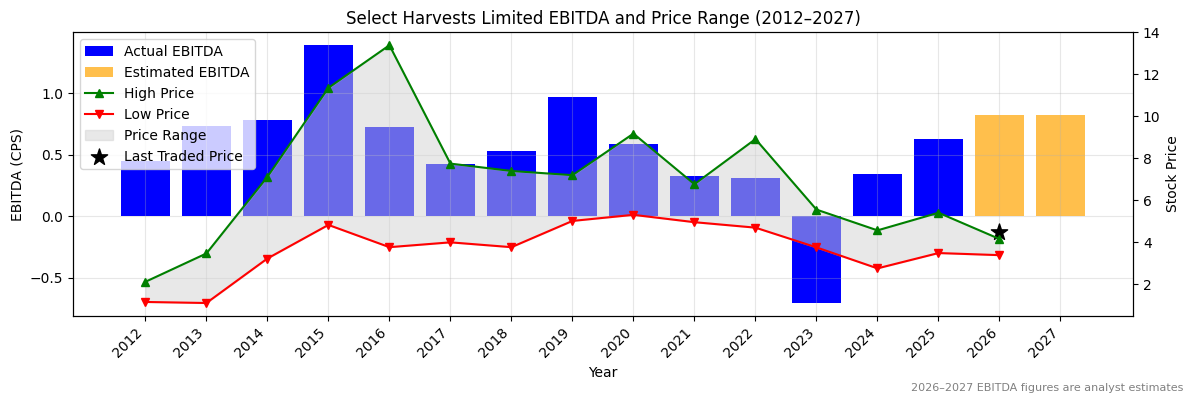
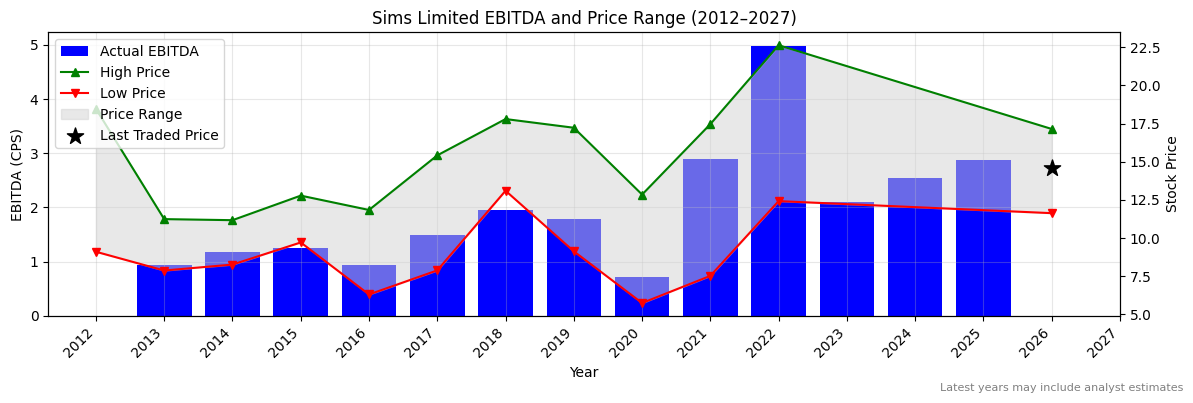
SNL Earnings before Interest, Tax, Depreciation and Amortisation (EBITDA) Per Share (2012–2027)
✅
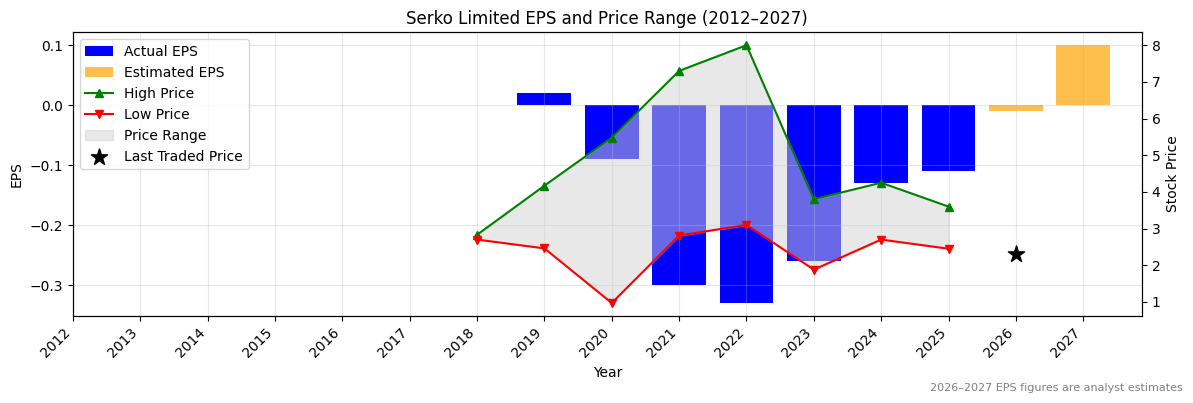
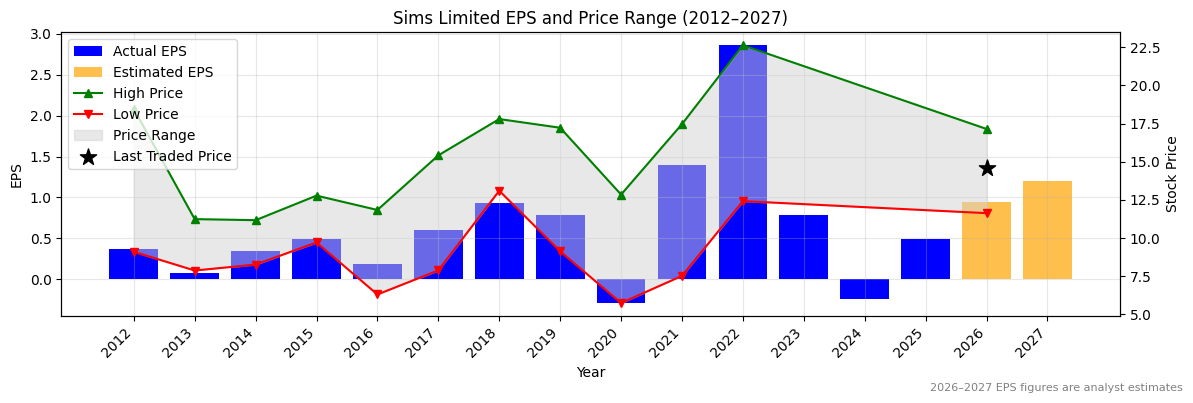
SNL Normalised Earnings Per Share (EPS) (2012–2027)
✅✅
Valuation
| Price To Sales |
Price To Book |
PER 2023 |
PER 2024 |
13Y Median PER Low |
PER 2025e |
13Y Median PER High |
PER 2026e |
Last Updated |
| 4.4 |
11.1 |
53.4 |
45.2 |
13.6 |
37.5 |
22.2 |
31.8 |
4/10/25 |
SNL Yearly Price Earnings Ratio (PER) Highs and Lows
❌
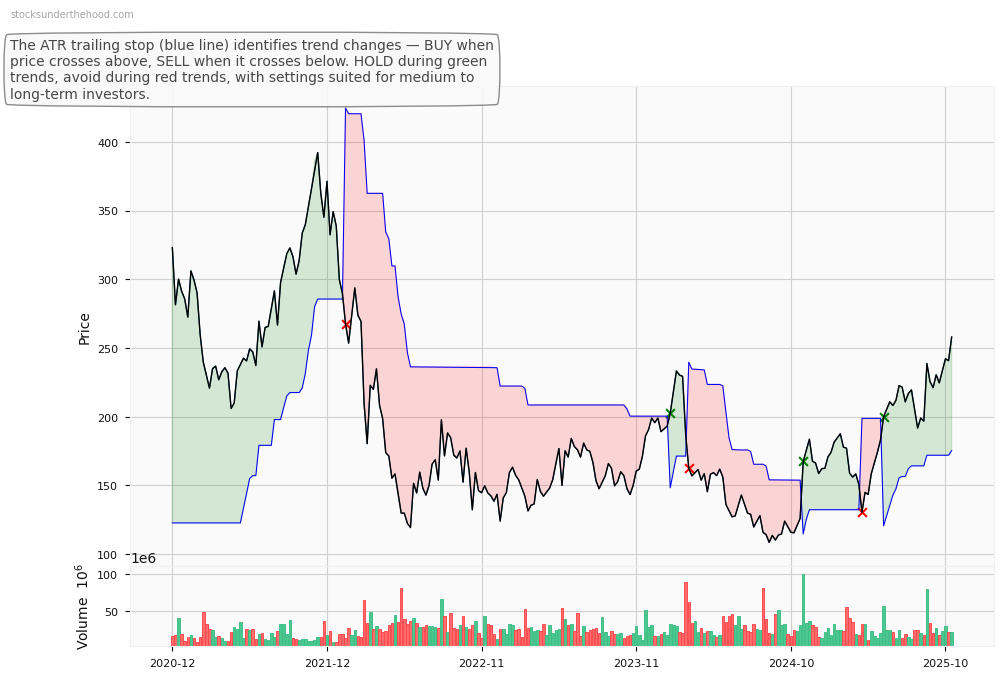
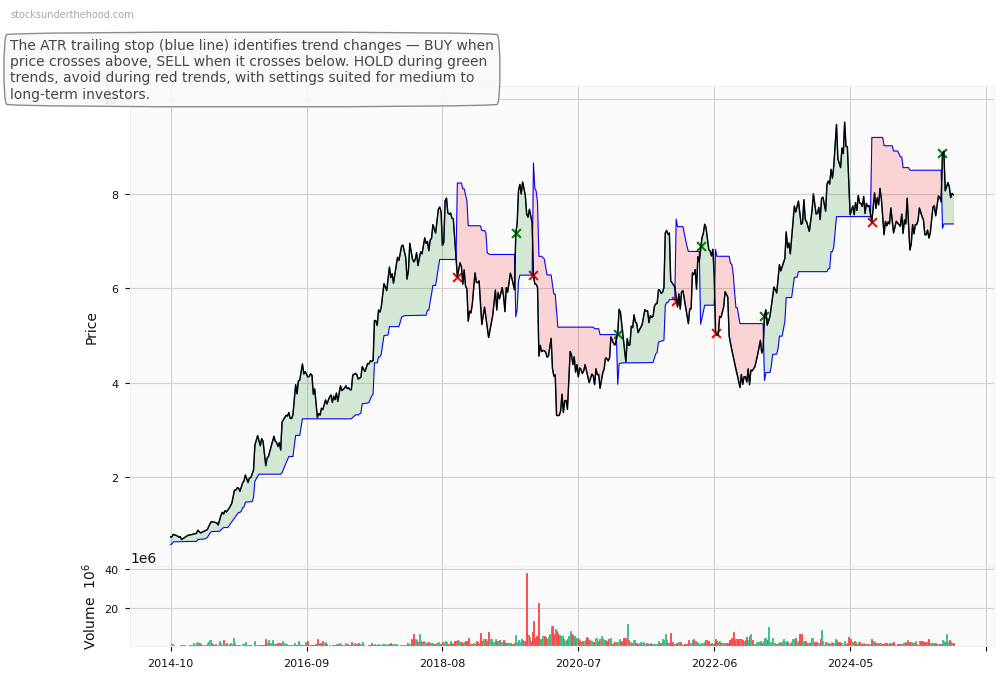
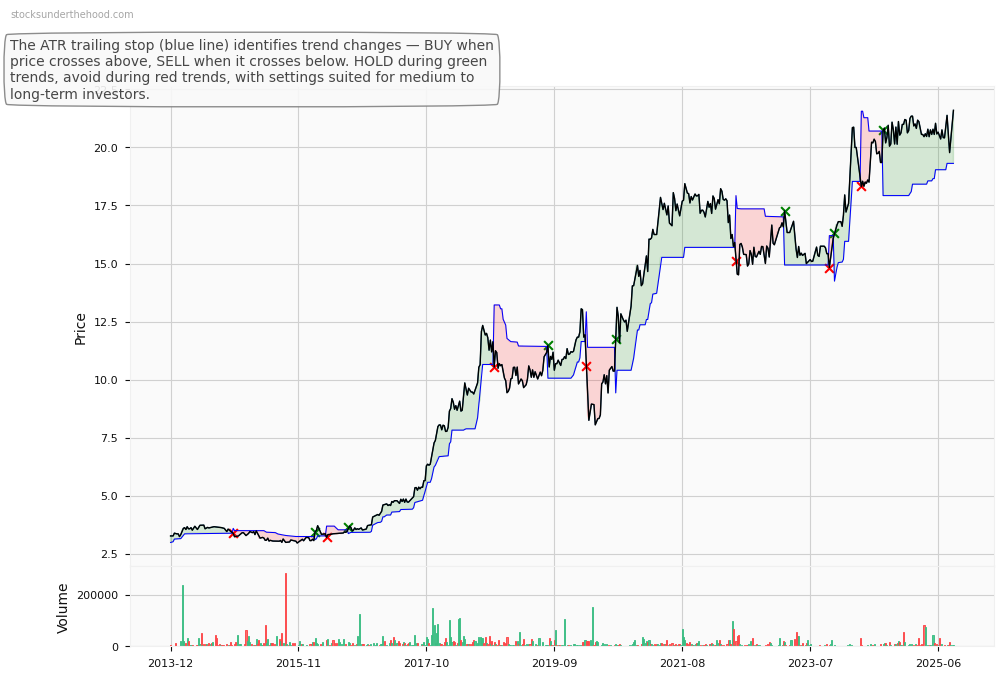
SNL Weekly Price Chart with Average True Range (ATR) Trailing Stop (10-Year View)
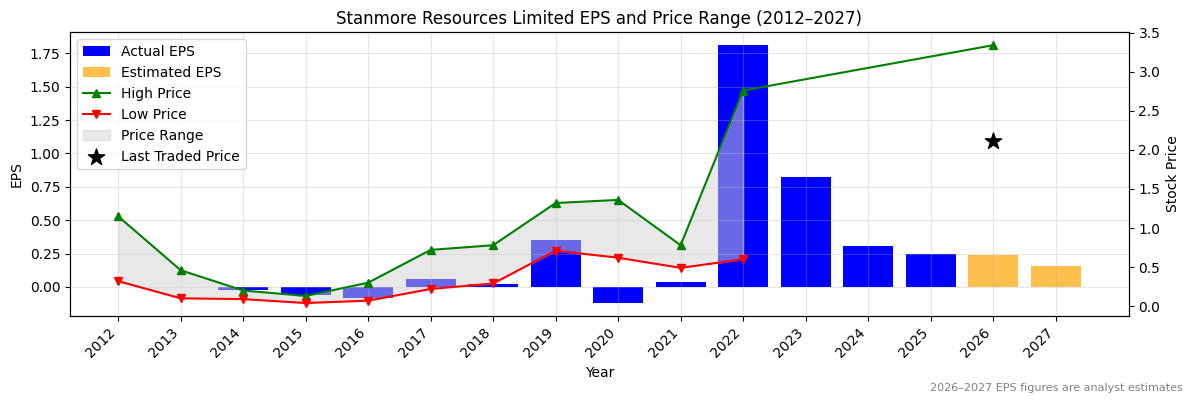
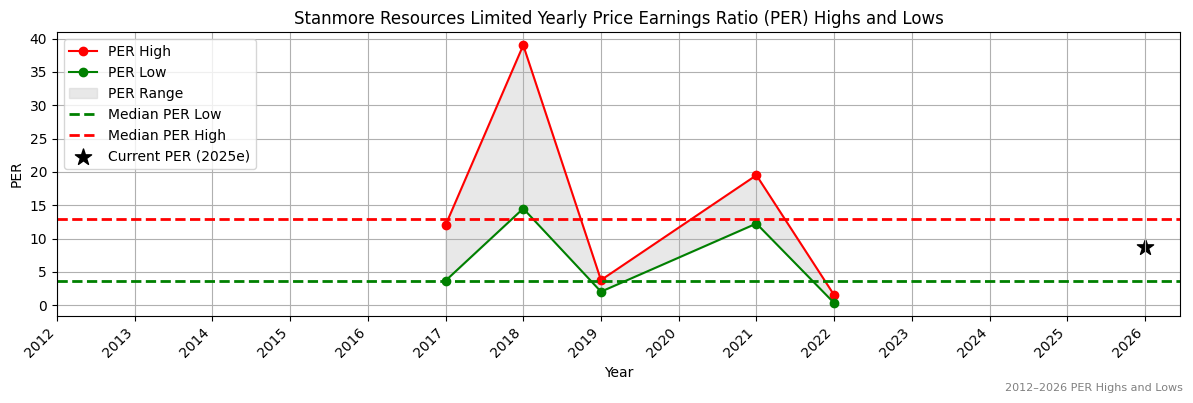
Ticker code: SMR
SMR Red Flags & Risk Indicators
⚠️
⚠️ RED FLAGS: 1 identified
Income Statement
| Revenue 2024 Per Share |
Revenue 2025e Per Share |
Revenue 2026e Per Share |
Revenue 24 to 25e [%] |
Revenue 25e to 26e [%] |
EBITDA 2024 Per Share |
EBITDA 2025e Per Share |
EBITDA 2026e Per Share |
EBITDA 24 to 25e [%] |
EBITDA 25e to 26e [%] |
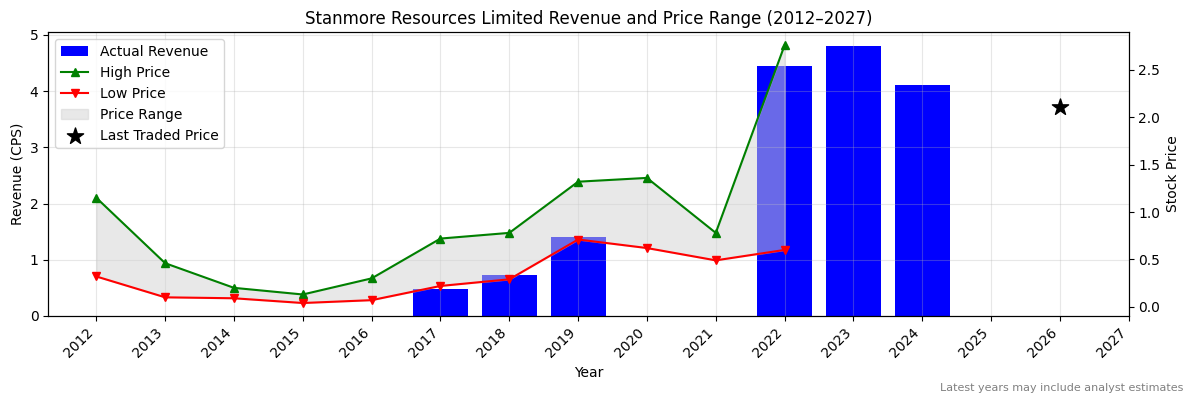
| 4.10605 |
None |
None |
None |
None |
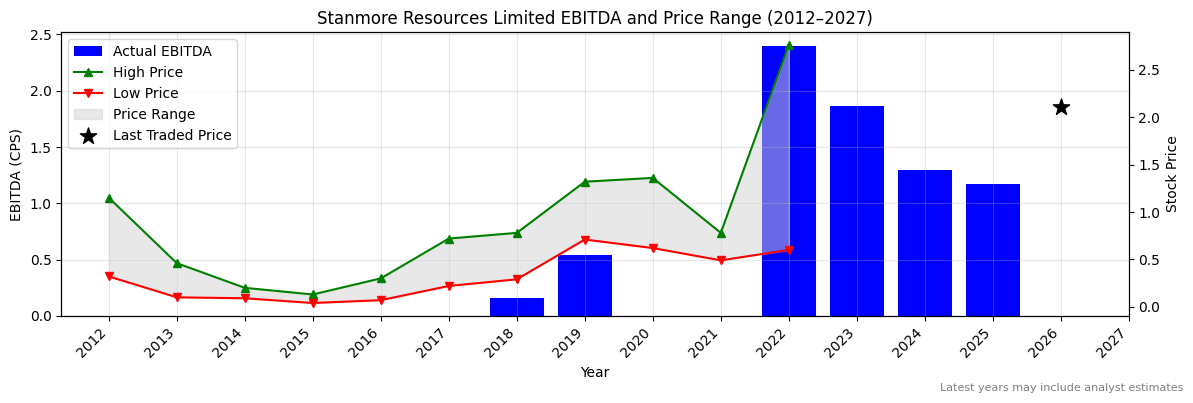
1.29331 |
1.17122 |
None |
-9.4 |
None |
SMR Revenue Per Share (2012–2027)
SMR Earnings before Interest, Tax, Depreciation and Amortisation (EBITDA) Per Share (2012–2027)
❌
SMR Normalised Earnings Per Share (EPS) (2012–2027)
❌
Valuation
| Price To Sales |
Price To Book |
PER 2023 |
PER 2024 |
13Y Median PER Low |
PER 2025e |
13Y Median PER High |
PER 2026e |
Last Updated |
| 1.0 |
1.1 |
2.6 |
6.9 |
3.7 |
8.6 |
13.0 |
9.0 |
28/11/23 |
SMR Yearly Price Earnings Ratio (PER) Highs and Lows
✅
SMR Weekly Price Chart with Average True Range (ATR) Trailing Stop (10-Year View)
Ticker code: SMP
SMP Red Flags & Risk Indicators
⚠️
⚠️ RED FLAGS: 2 identified
- Falling Earnings
- Falling EBITDA Margins
Income Statement
| Revenue 2024 Per Share |
Revenue 2025e Per Share |
Revenue 2026e Per Share |
Revenue 24 to 25e [%] |
Revenue 25e to 26e [%] |
EBITDA 2024 Per Share |
EBITDA 2025e Per Share |
EBITDA 2026e Per Share |
EBITDA 24 to 25e [%] |
EBITDA 25e to 26e [%] |
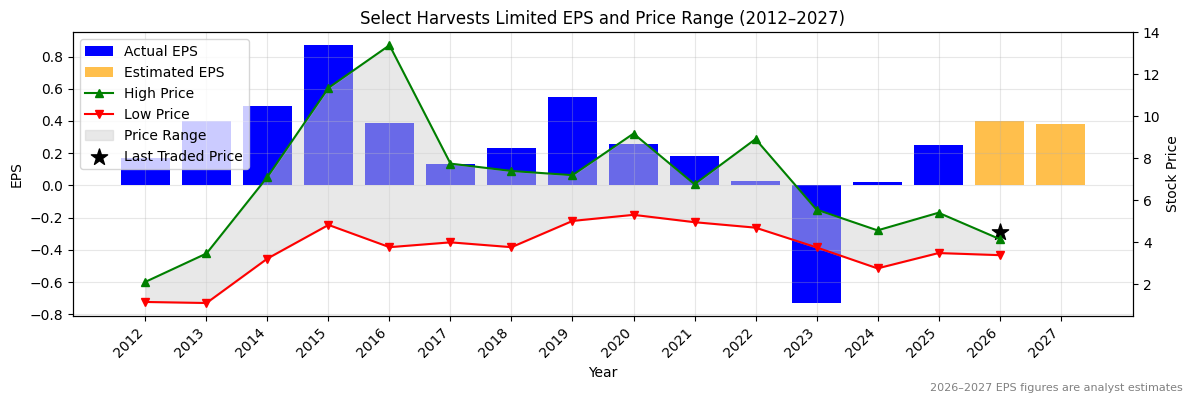
| 0.40501 |
0.43283 |
0.50148 |
6.9 |
15.9 |
0.08926 |
0.06874 |
0.09725 |
-23.0 |
41.5 |
SMP Revenue Per Share (2012–2027)
✅
SMP Earnings before Interest, Tax, Depreciation and Amortisation (EBITDA) Per Share (2012–2027)
❌
SMP Normalised Earnings Per Share (EPS) (2012–2027)
❌
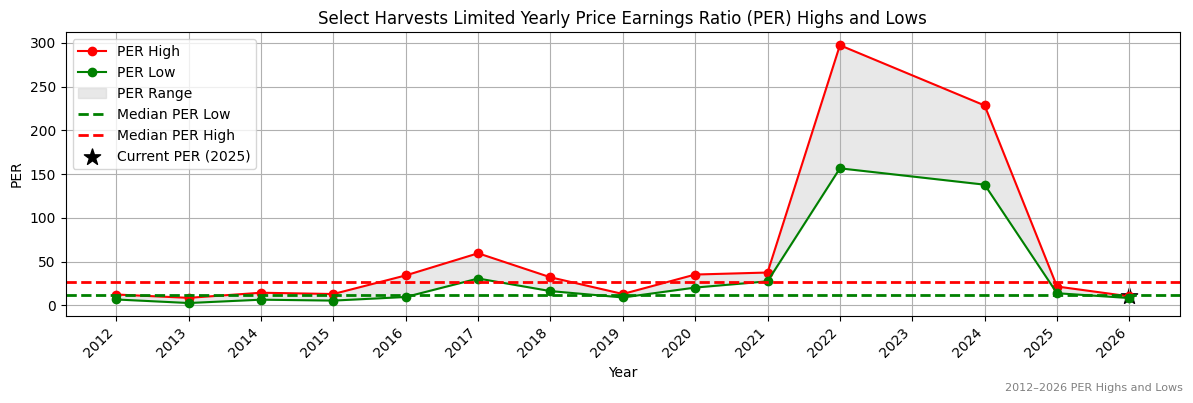
Valuation
| Price To Sales |
Price To Book |
PER 2023 |
PER 2024 |
13Y Median PER Low |
PER 2025e |
13Y Median PER High |
PER 2026e |
Last Updated |
| 2.4 |
4.9 |
None |
None |
19.1 |
None |
38.0 |
None |
2/6/25 |
SMP Yearly Price Earnings Ratio (PER) Highs and Lows
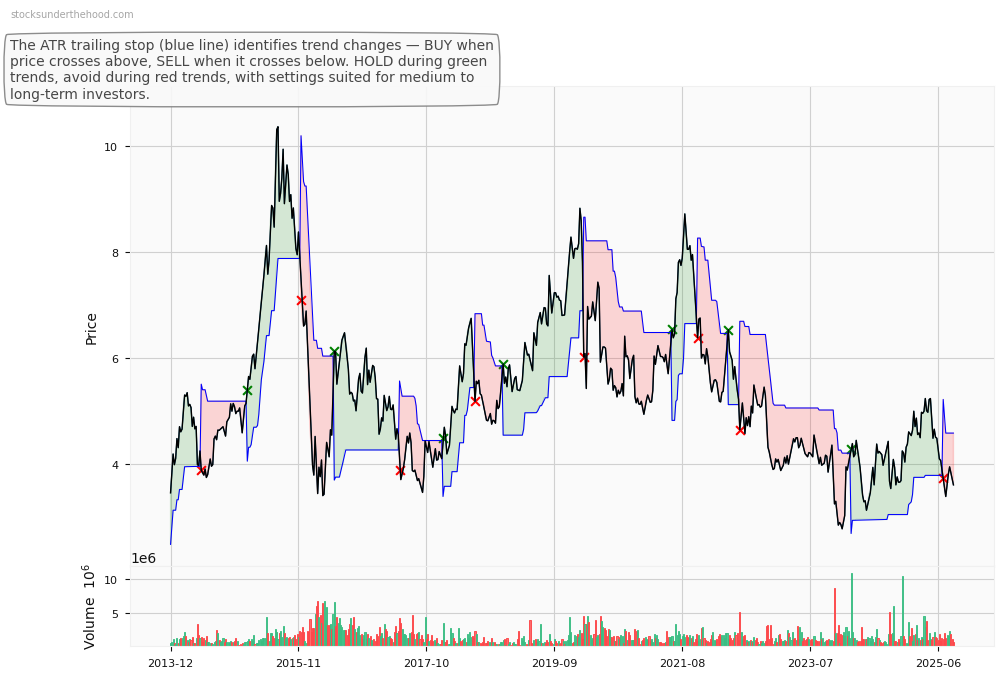
SMP Weekly Price Chart with Average True Range (ATR) Trailing Stop (10-Year View)
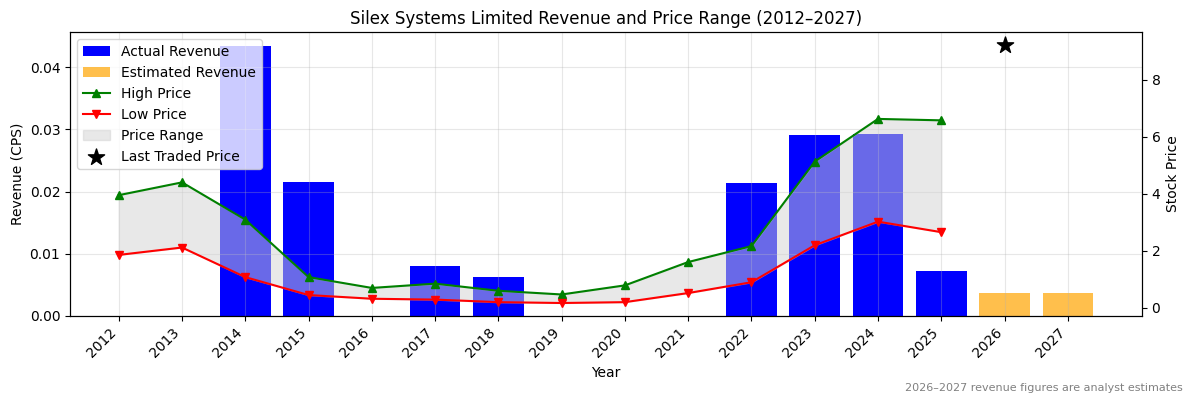
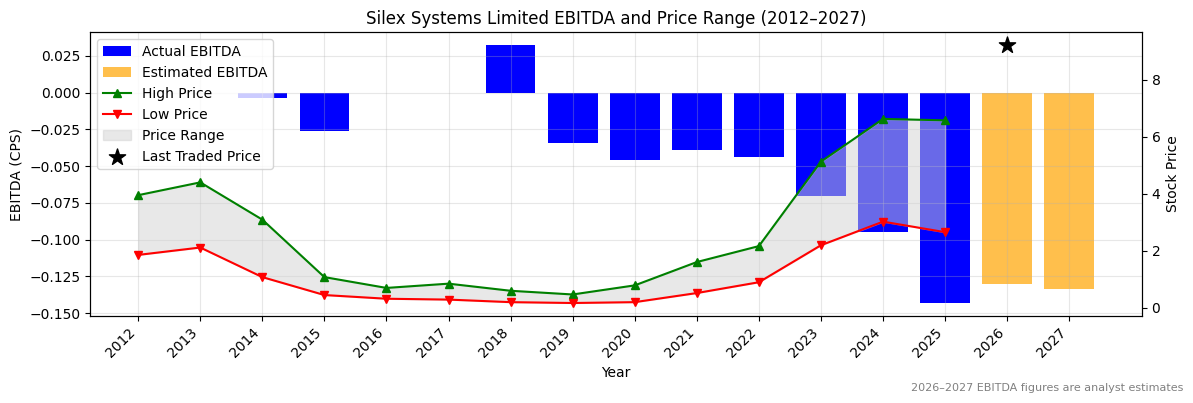
Ticker code: SLX
SLX Red Flags & Risk Indicators
❌
⚠️ RED FLAGS: 5 identified
- Highly Shorted
- Increasing Shorts
- Falling Earnings
- High Price to Book vs ROE
- Falling EBITDA Margins
Income Statement
| Revenue 2024 Per Share |
Revenue 2025e Per Share |
Revenue 2026e Per Share |
Revenue 24 to 25e [%] |
Revenue 25e to 26e [%] |
EBITDA 2024 Per Share |
EBITDA 2025e Per Share |
EBITDA 2026e Per Share |
EBITDA 24 to 25e [%] |
EBITDA 25e to 26e [%] |
| 0.02918 |
0.00722 |
0.00361 |
-75.2 |
-50.0 |
-0.09456 |
-0.14305 |
-0.12991 |
-51.3 |
9.2 |
SLX Revenue Per Share (2012–2027)
❌
SLX Earnings before Interest, Tax, Depreciation and Amortisation (EBITDA) Per Share (2012–2027)
❌
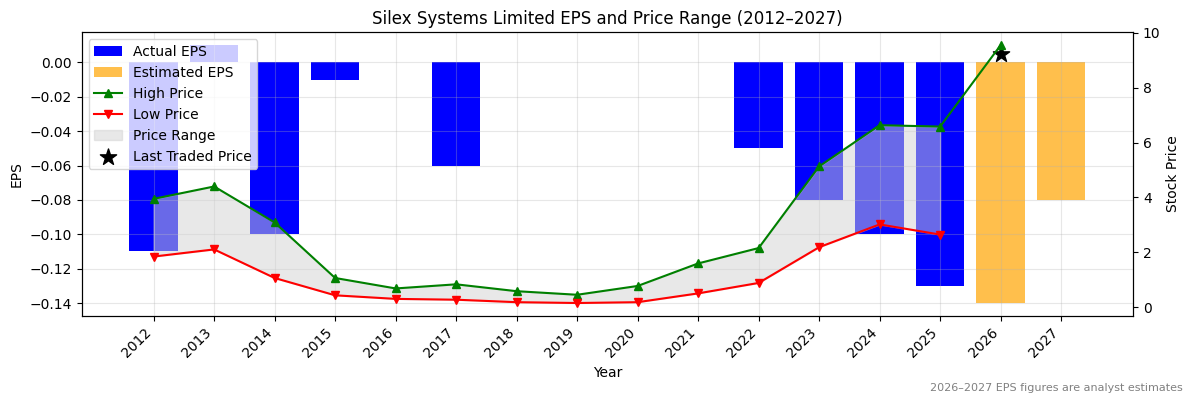
SLX Normalised Earnings Per Share (EPS) (2012–2027)
❌
Valuation
| Price To Sales |
Price To Book |
PER 2023 |
PER 2024 |
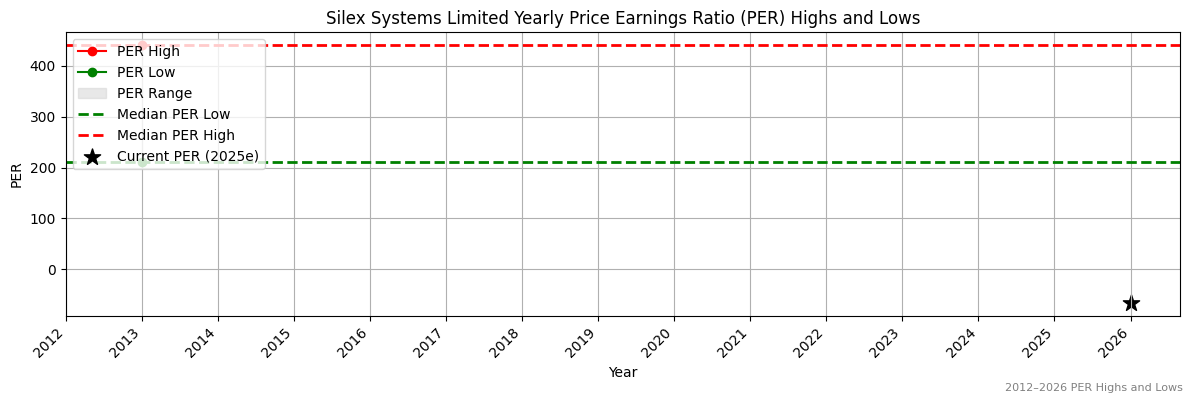
13Y Median PER Low |
PER 2025e |
13Y Median PER High |
PER 2026e |
Last Updated |
| 209.3 |
27.1 |
-129.3 |
-103.4 |
211.0 |
-79.5 |
440.0 |
-73.9 |
20/4/25 |
SLX Yearly Price Earnings Ratio (PER) Highs and Lows
✅✅
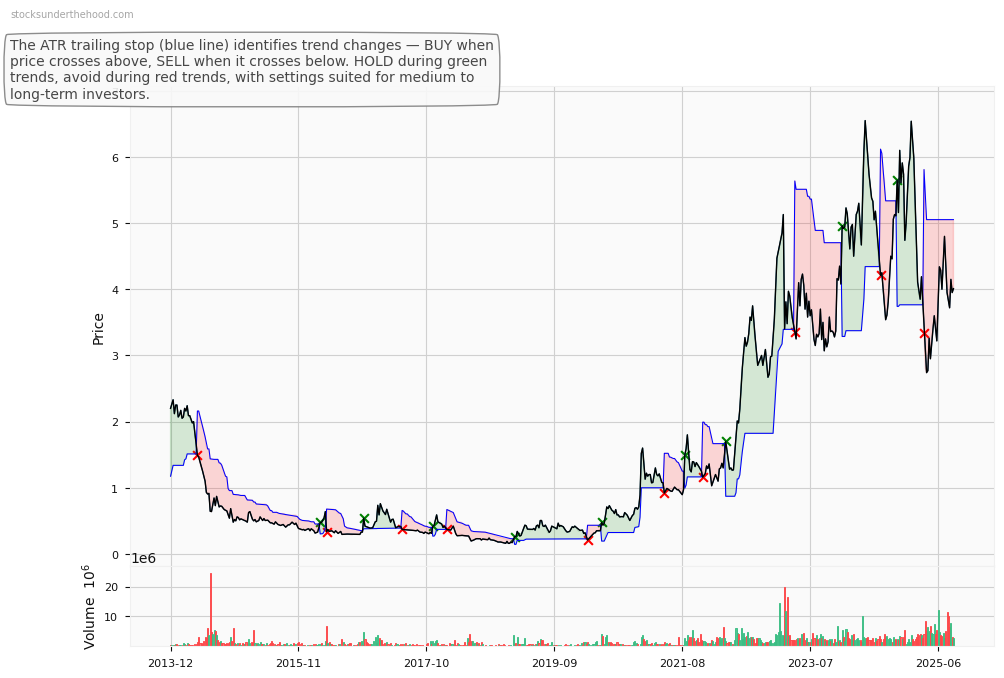
SLX Weekly Price Chart with Average True Range (ATR) Trailing Stop (10-Year View)
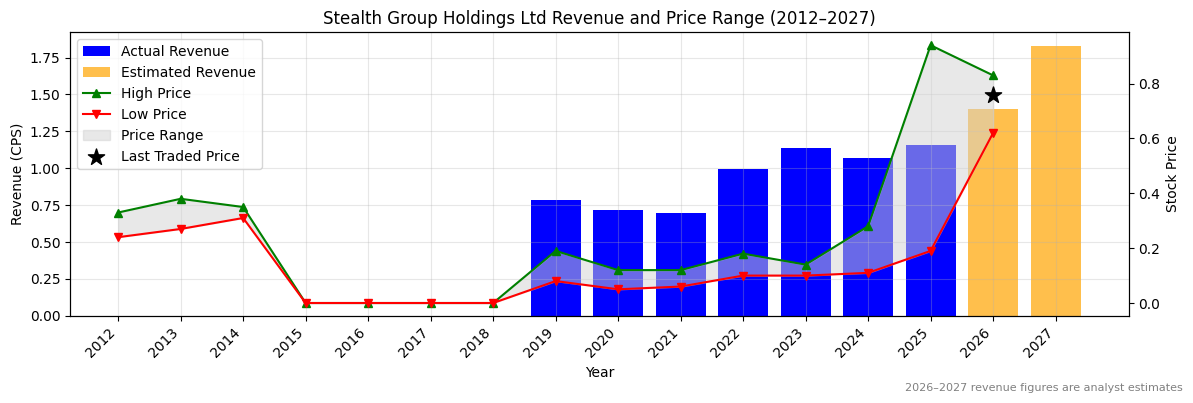
Ticker code: SGI
SGI Red Flags & Risk Indicators
⚠️
⚠️ RED FLAGS: 2 identified
- Low Operating Margin
- High Relative Valuation
Income Statement
| Revenue 2024 Per Share |
Revenue 2025e Per Share |
Revenue 2026e Per Share |
Revenue 24 to 25e [%] |
Revenue 25e to 26e [%] |
EBITDA 2024 Per Share |
EBITDA 2025e Per Share |
EBITDA 2026e Per Share |
EBITDA 24 to 25e [%] |
EBITDA 25e to 26e [%] |
| 1.07019 |
1.15745 |
1.40196 |
8.2 |
21.1 |
0.03884 |
0.07707 |
0.10268 |
98.4 |
33.2 |
SGI Revenue Per Share (2012–2027)
✅
SGI Earnings before Interest, Tax, Depreciation and Amortisation (EBITDA) Per Share (2012–2027)
✅✅
SGI Normalised Earnings Per Share (EPS) (2012–2027)
❌
Valuation
| Price To Sales |
Price To Book |
PER 2023 |
PER 2024 |
13Y Median PER Low |
PER 2025e |
13Y Median PER High |
PER 2026e |
Last Updated |
| 0.7 |
3.1 |
24.2 |
14.5 |
6.0 |
26.9 |
12.0 |
19.6 |
20/9/25 |
SGI Yearly Price Earnings Ratio (PER) Highs and Lows
❌
SGI Weekly Price Chart with Average True Range (ATR) Trailing Stop (10-Year View)
Ticker code: SLC
SLC Red Flags & Risk Indicators
✅
⚠️ RED FLAGS: 0 identified
No red flags detected.
Income Statement
| Revenue 2024 Per Share |
Revenue 2025e Per Share |
Revenue 2026e Per Share |
Revenue 24 to 25e [%] |
Revenue 25e to 26e [%] |
EBITDA 2024 Per Share |
EBITDA 2025e Per Share |
EBITDA 2026e Per Share |
EBITDA 24 to 25e [%] |
EBITDA 25e to 26e [%] |
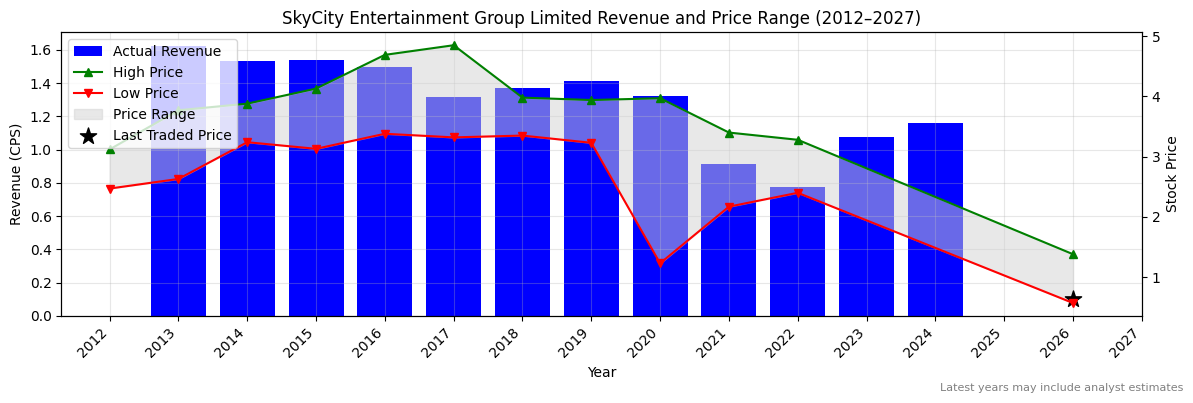
| 0.86616 |
1.0957 |
1.27417 |
26.5 |
16.3 |
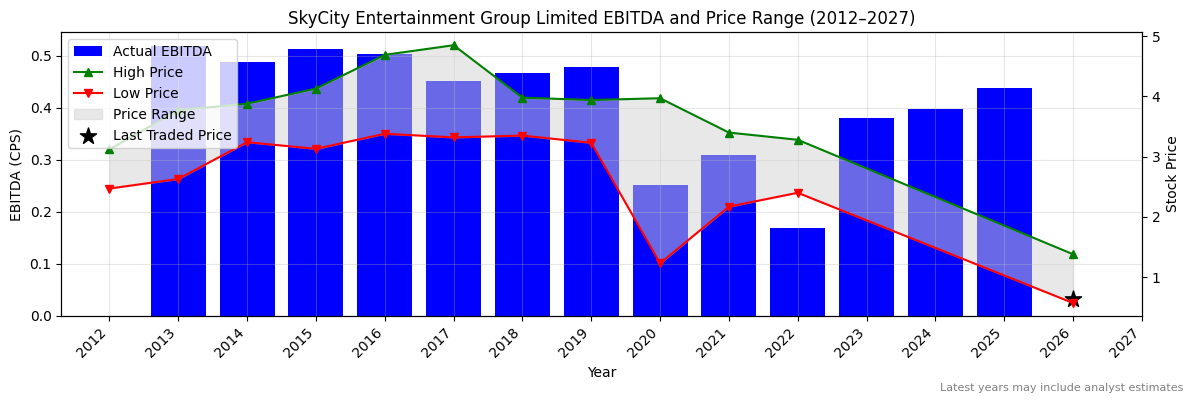
0.11176 |
0.18001 |
0.22019 |
61.1 |
22.3 |
SLC Revenue Per Share (2012–2027)
✅✅
SLC Earnings before Interest, Tax, Depreciation and Amortisation (EBITDA) Per Share (2012–2027)
✅✅
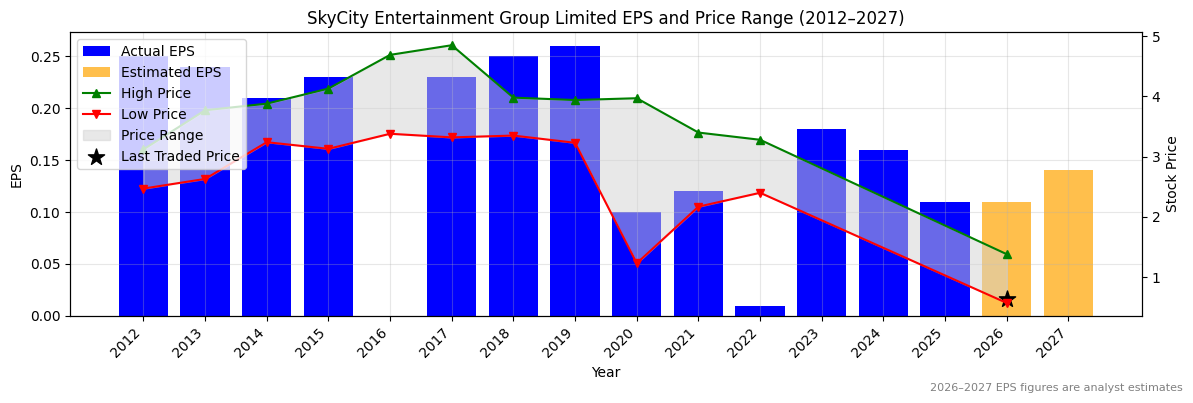
SLC Normalised Earnings Per Share (EPS) (2012–2027)
✅✅
Valuation
| Price To Sales |
Price To Book |
PER 2023 |
PER 2024 |
13Y Median PER Low |
PER 2025e |
13Y Median PER High |
PER 2026e |
Last Updated |
| 2.9 |
4.0 |
-156.0 |
None |
40.1 |
62.4 |
62.4 |
39.0 |
4/10/25 |
SLC Yearly Price Earnings Ratio (PER) Highs and Lows
✅
SLC Weekly Price Chart with Average True Range (ATR) Trailing Stop (10-Year View)
Ticker code: SKO
SKO Red Flags & Risk Indicators
✅
⚠️ RED FLAGS: 0 identified
No red flags detected.
Income Statement
| Revenue 2024 Per Share |
Revenue 2025e Per Share |
Revenue 2026e Per Share |
Revenue 24 to 25e [%] |
Revenue 25e to 26e [%] |
EBITDA 2024 Per Share |
EBITDA 2025e Per Share |
EBITDA 2026e Per Share |
EBITDA 24 to 25e [%] |
EBITDA 25e to 26e [%] |
| 0.58426 |
0.74241 |
0.95682 |
27.1 |
28.9 |
-0.01313 |
0.02298 |
0.03563 |
275.0 |
55.1 |
SKO Revenue Per Share (2012–2027)
✅✅
SKO Earnings before Interest, Tax, Depreciation and Amortisation (EBITDA) Per Share (2012–2027)
✅✅
SKO Normalised Earnings Per Share (EPS) (2012–2027)
✅
Valuation
| Price To Sales |
Price To Book |
PER 2023 |
PER 2024 |
13Y Median PER Low |
PER 2025e |
13Y Median PER High |
PER 2026e |
Last Updated |
| 3.4 |
3.0 |
-9.3 |
-18.7 |
123.0 |
-22.1 |
208.5 |
-243.0 |
11/10/25 |
SKO Yearly Price Earnings Ratio (PER) Highs and Lows
✅✅
SKO Weekly Price Chart with Average True Range (ATR) Trailing Stop (10-Year View)
Ticker code: SKC
SKC Red Flags & Risk Indicators
❌
⚠️ RED FLAGS: 4 identified
- Low Operating Margin
- Increasing Shorts
- Falling Earnings
- Falling Revenues
Income Statement
| Revenue 2024 Per Share |
Revenue 2025e Per Share |
Revenue 2026e Per Share |
Revenue 24 to 25e [%] |
Revenue 25e to 26e [%] |
EBITDA 2024 Per Share |
EBITDA 2025e Per Share |
EBITDA 2026e Per Share |
EBITDA 24 to 25e [%] |
EBITDA 25e to 26e [%] |
| 1.15892 |
None |
None |
None |
None |
0.39725 |
0.43873 |
None |
10.4 |
None |
SKC Revenue Per Share (2012–2027)
SKC Earnings before Interest, Tax, Depreciation and Amortisation (EBITDA) Per Share (2012–2027)
✅
SKC Normalised Earnings Per Share (EPS) (2012–2027)
❌
Valuation
| Price To Sales |
Price To Book |
PER 2023 |
PER 2024 |
13Y Median PER Low |
PER 2025e |
13Y Median PER High |
PER 2026e |
Last Updated |
| 0.9 |
0.4 |
3.5 |
4.0 |
13.4 |
5.8 |
18.0 |
5.8 |
27/8/23 |
SKC Yearly Price Earnings Ratio (PER) Highs and Lows
✅✅
SKC Weekly Price Chart with Average True Range (ATR) Trailing Stop (10-Year View)
Ticker code: SIQ
SIQ Red Flags & Risk Indicators
⚠️
⚠️ RED FLAGS: 1 identified
Income Statement
| Revenue 2024 Per Share |
Revenue 2025e Per Share |
Revenue 2026e Per Share |
Revenue 24 to 25e [%] |
Revenue 25e to 26e [%] |
EBITDA 2024 Per Share |
EBITDA 2025e Per Share |
EBITDA 2026e Per Share |
EBITDA 24 to 25e [%] |
EBITDA 25e to 26e [%] |
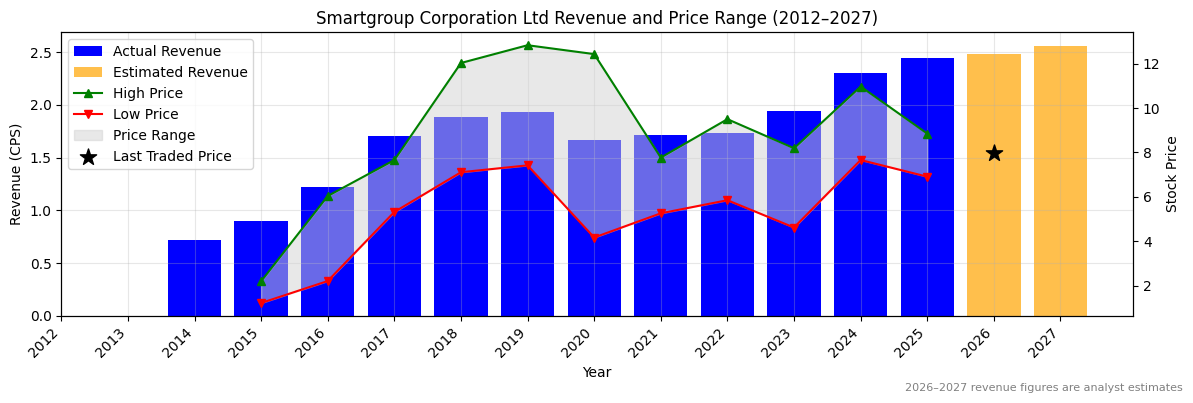
| 2.30301 |
2.44857 |
2.48714 |
6.3 |
1.6 |
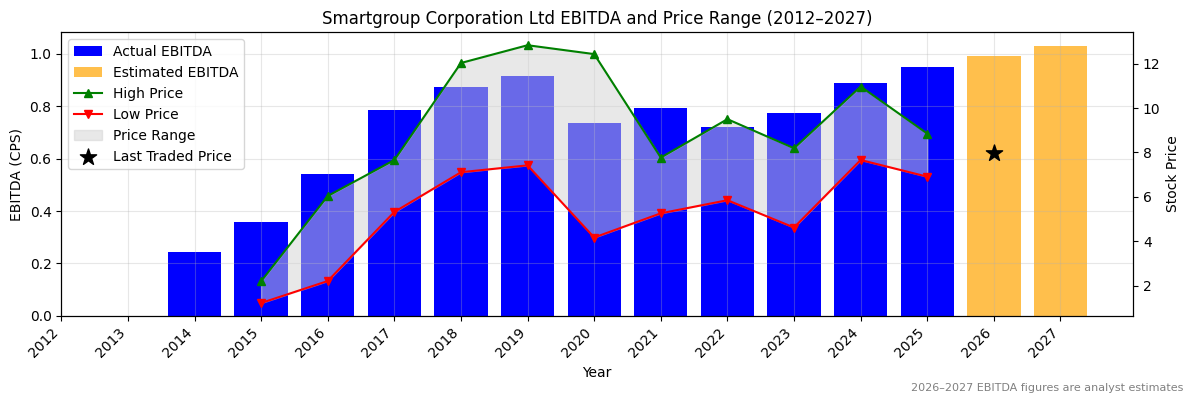
0.89021 |
0.94952 |
0.99222 |
6.7 |
4.5 |
SIQ Revenue Per Share (2012–2027)
✅
SIQ Earnings before Interest, Tax, Depreciation and Amortisation (EBITDA) Per Share (2012–2027)
✅
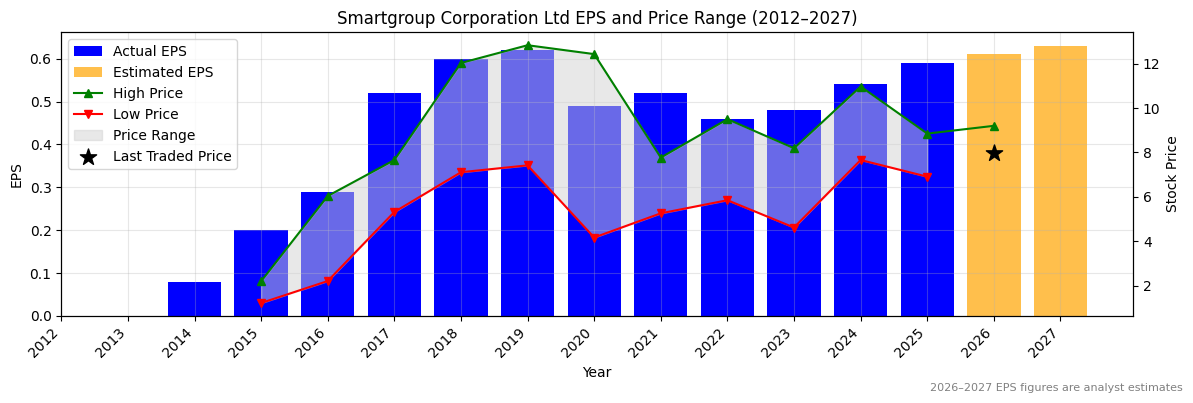
SIQ Normalised Earnings Per Share (EPS) (2012–2027)
✅
Valuation
| Price To Sales |
Price To Book |
PER 2023 |
PER 2024 |
13Y Median PER Low |
PER 2025e |
13Y Median PER High |
PER 2026e |
Last Updated |
| 3.5 |
4.1 |
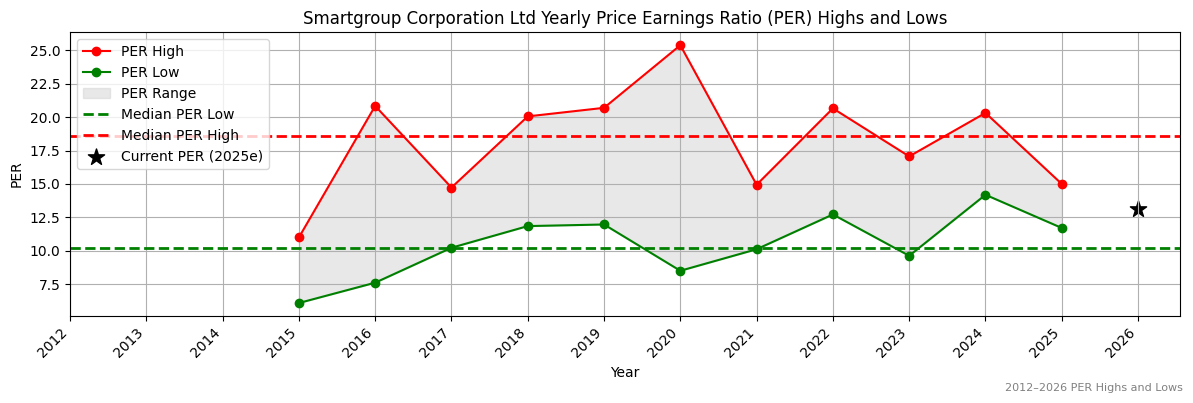
17.0 |
15.1 |
10.2 |
13.9 |
18.6 |
13.4 |
2/8/25 |
SIQ Yearly Price Earnings Ratio (PER) Highs and Lows
✅
SIQ Weekly Price Chart with Average True Range (ATR) Trailing Stop (10-Year View)
Ticker code: SIG
SIG Red Flags & Risk Indicators
❌
⚠️ RED FLAGS: 4 identified
- Low Operating Margin
- Falling Earnings
- High Price to Book vs ROE
- High Relative Valuation
Income Statement
| Revenue 2024 Per Share |
Revenue 2025e Per Share |
Revenue 2026e Per Share |
Revenue 24 to 25e [%] |
Revenue 25e to 26e [%] |
EBITDA 2024 Per Share |
EBITDA 2025e Per Share |
EBITDA 2026e Per Share |
EBITDA 24 to 25e [%] |
EBITDA 25e to 26e [%] |
| 2.03577 |
4.21734 |
0.81808 |
107.2 |
-80.6 |
0.03658 |
0.07743 |
0.09909 |
111.6 |
28.0 |
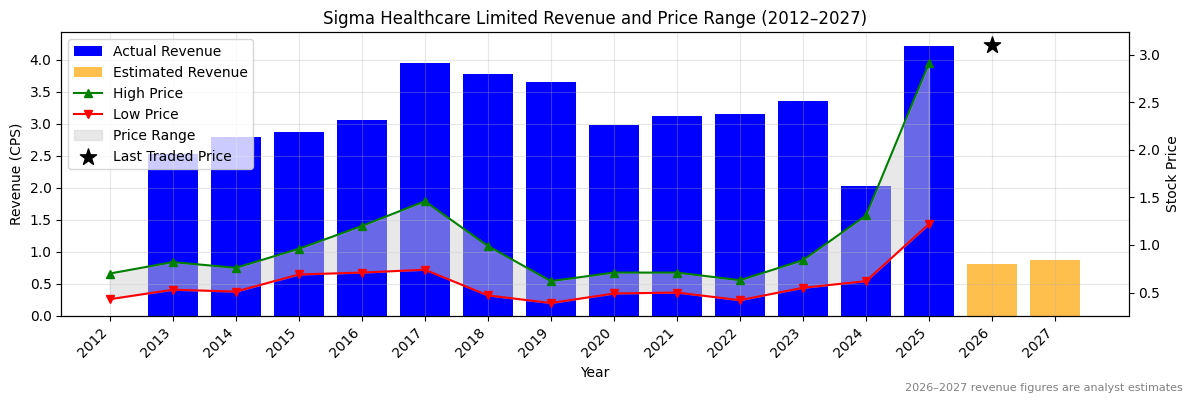
SIG Revenue Per Share (2012–2027)
✅✅
SIG Earnings before Interest, Tax, Depreciation and Amortisation (EBITDA) Per Share (2012–2027)
✅✅
SIG Normalised Earnings Per Share (EPS) (2012–2027)
✅✅
Valuation
| Price To Sales |
Price To Book |
PER 2023 |
PER 2024 |
13Y Median PER Low |
PER 2025e |
13Y Median PER High |
PER 2026e |
Last Updated |
| 10.3 |
7.7 |
311.0 |
311.0 |
13.9 |
62.2 |
23.7 |
51.8 |
4/10/25 |
SIG Yearly Price Earnings Ratio (PER) Highs and Lows
❌
SIG Weekly Price Chart with Average True Range (ATR) Trailing Stop (10-Year View)
Ticker code: SHV
SHV Red Flags & Risk Indicators
⚠️
⚠️ RED FLAGS: 1 identified
Income Statement
| Revenue 2024 Per Share |
Revenue 2025e Per Share |
Revenue 2026e Per Share |
Revenue 24 to 25e [%] |
Revenue 25e to 26e [%] |
EBITDA 2024 Per Share |
EBITDA 2025e Per Share |
EBITDA 2026e Per Share |
EBITDA 24 to 25e [%] |
EBITDA 25e to 26e [%] |
| 2.45659 |
2.42471 |
2.95614 |
-1.3 |
21.9 |
0.34108 |
0.62847 |
0.82255 |
84.3 |
30.9 |
SHV Revenue Per Share (2012–2027)
❌
SHV Earnings before Interest, Tax, Depreciation and Amortisation (EBITDA) Per Share (2012–2027)
✅✅
SHV Normalised Earnings Per Share (EPS) (2012–2027)
✅✅
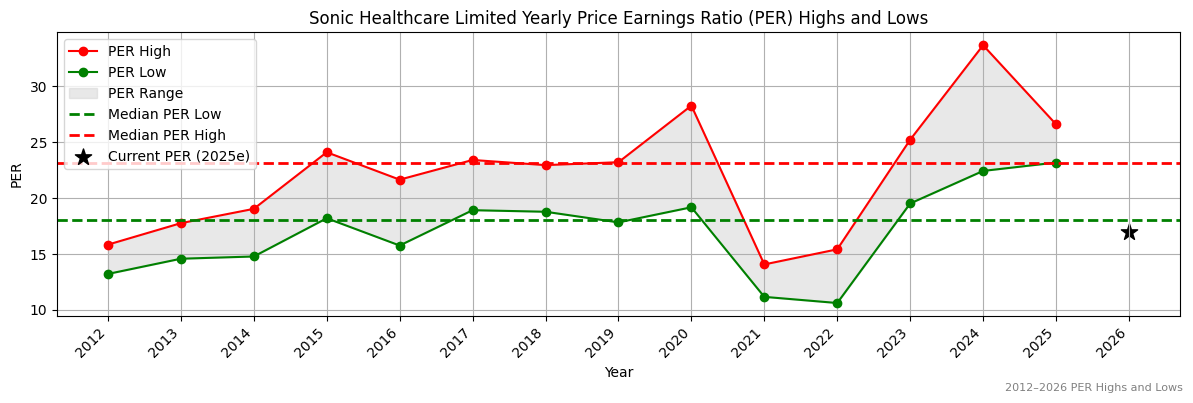
Valuation
| Price To Sales |
Price To Book |
PER 2023 |
PER 2024 |
13Y Median PER Low |
PER 2025e |
13Y Median PER High |
PER 2026e |
Last Updated |
| 1.5 |
1.1 |
-5.3 |
194.0 |
11.8 |
15.5 |
26.9 |
9.7 |
4/10/25 |
SHV Yearly Price Earnings Ratio (PER) Highs and Lows
✅
SHV Weekly Price Chart with Average True Range (ATR) Trailing Stop (10-Year View)
Ticker code: SHL
SHL Red Flags & Risk Indicators
⚠️
⚠️ RED FLAGS: 1 identified
Income Statement
| Revenue 2024 Per Share |
Revenue 2025e Per Share |
Revenue 2026e Per Share |
Revenue 24 to 25e [%] |
Revenue 25e to 26e [%] |
EBITDA 2024 Per Share |
EBITDA 2025e Per Share |
EBITDA 2026e Per Share |
EBITDA 24 to 25e [%] |
EBITDA 25e to 26e [%] |
| 18.73387 |
19.41516 |
20.85087 |
3.6 |
7.4 |
3.40246 |
3.53192 |
3.90597 |
3.8 |
10.6 |
SHL Revenue Per Share (2012–2027)
✅
SHL Earnings before Interest, Tax, Depreciation and Amortisation (EBITDA) Per Share (2012–2027)
✅
SHL Normalised Earnings Per Share (EPS) (2012–2027)
✅
Valuation
| Price To Sales |
Price To Book |
PER 2023 |
PER 2024 |
13Y Median PER Low |
PER 2025e |
13Y Median PER High |
PER 2026e |
Last Updated |
| 1.1 |
1.2 |
14.6 |
19.8 |
18.0 |
19.4 |
23.1 |
16.5 |
21/4/25 |
SHL Yearly Price Earnings Ratio (PER) Highs and Lows
✅
SHL Weekly Price Chart with Average True Range (ATR) Trailing Stop (10-Year View)
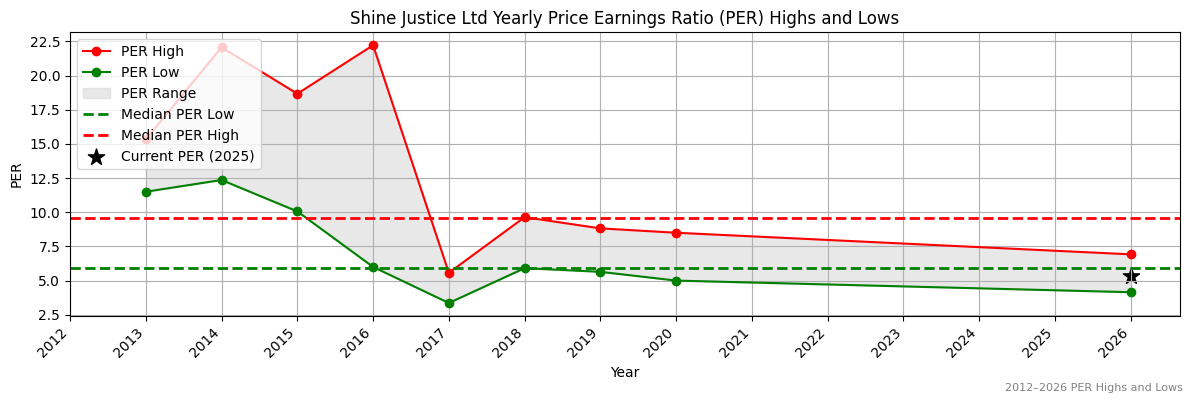
Ticker code: SHJ
SHJ Red Flags & Risk Indicators
⚠️
⚠️ RED FLAGS: 2 identified
- Low Operating Margin
- Falling Earnings
Income Statement
| Revenue 2024 Per Share |
Revenue 2025e Per Share |
Revenue 2026e Per Share |
Revenue 24 to 25e [%] |
Revenue 25e to 26e [%] |
EBITDA 2024 Per Share |
EBITDA 2025e Per Share |
EBITDA 2026e Per Share |
EBITDA 24 to 25e [%] |
EBITDA 25e to 26e [%] |
| 1.14162 |
None |
None |
None |
None |
0.12946 |
None |
None |
None |
None |
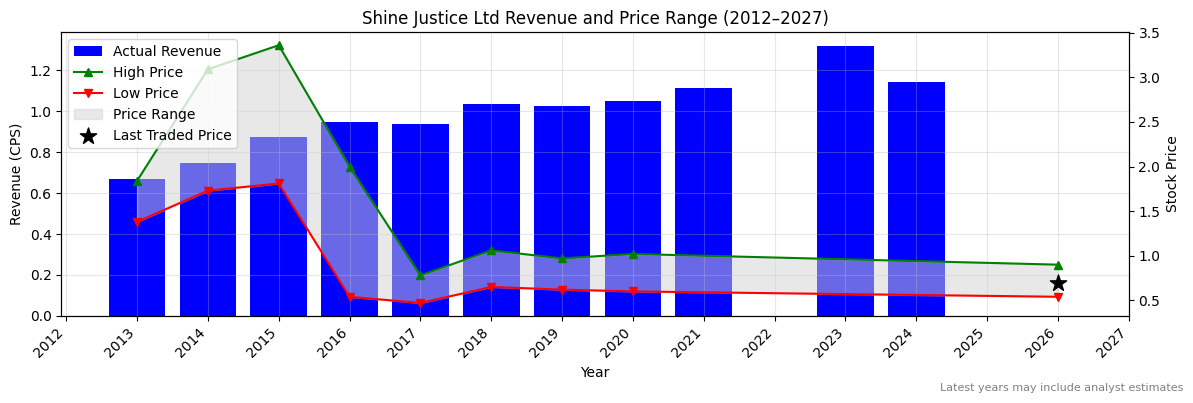
SHJ Revenue Per Share (2012–2027)
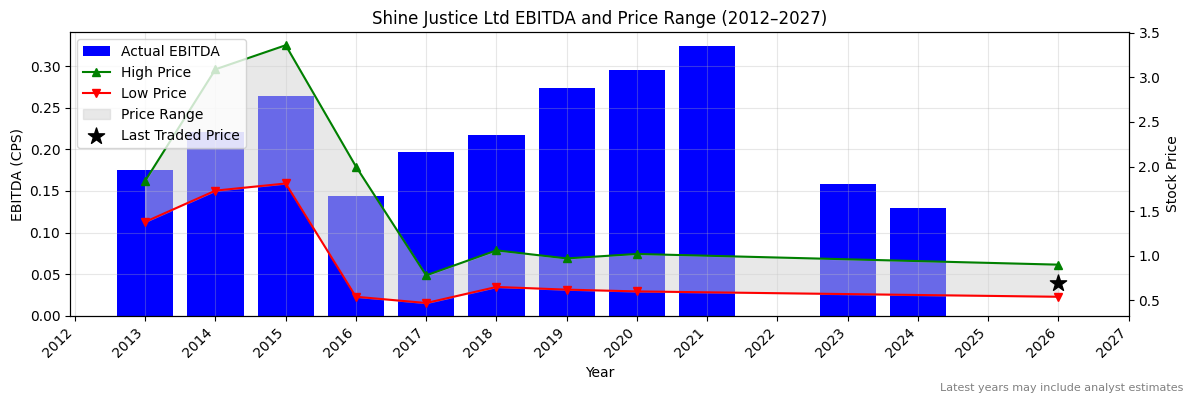
SHJ Earnings before Interest, Tax, Depreciation and Amortisation (EBITDA) Per Share (2012–2027)
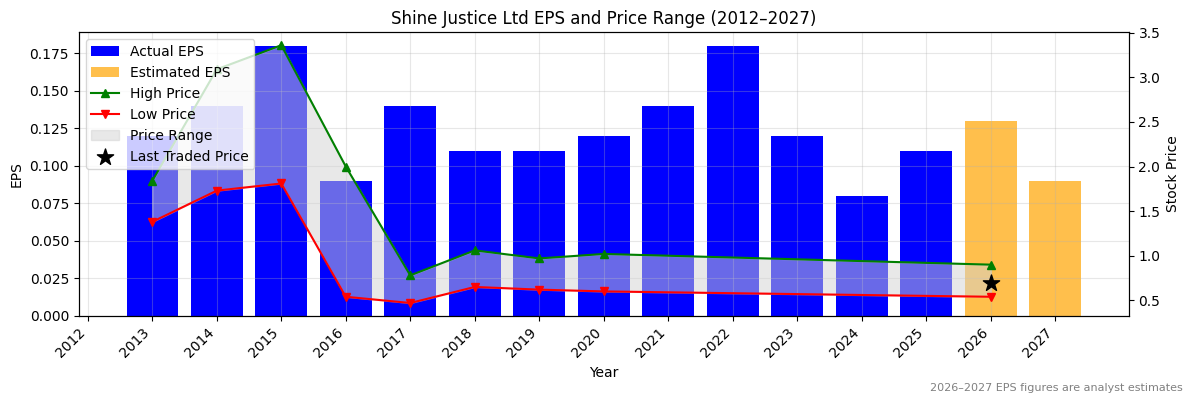
SHJ Normalised Earnings Per Share (EPS) (2012–2027)
✅✅
Valuation
| Price To Sales |
Price To Book |
PER 2023 |
PER 2024 |
13Y Median PER Low |
PER 2025e |
13Y Median PER High |
PER 2026e |
Last Updated |
| 0.6 |
0.4 |
5.6 |
8.4 |
5.9 |
6.1 |
9.6 |
5.2 |
4/3/22 |
SHJ Yearly Price Earnings Ratio (PER) Highs and Lows
✅
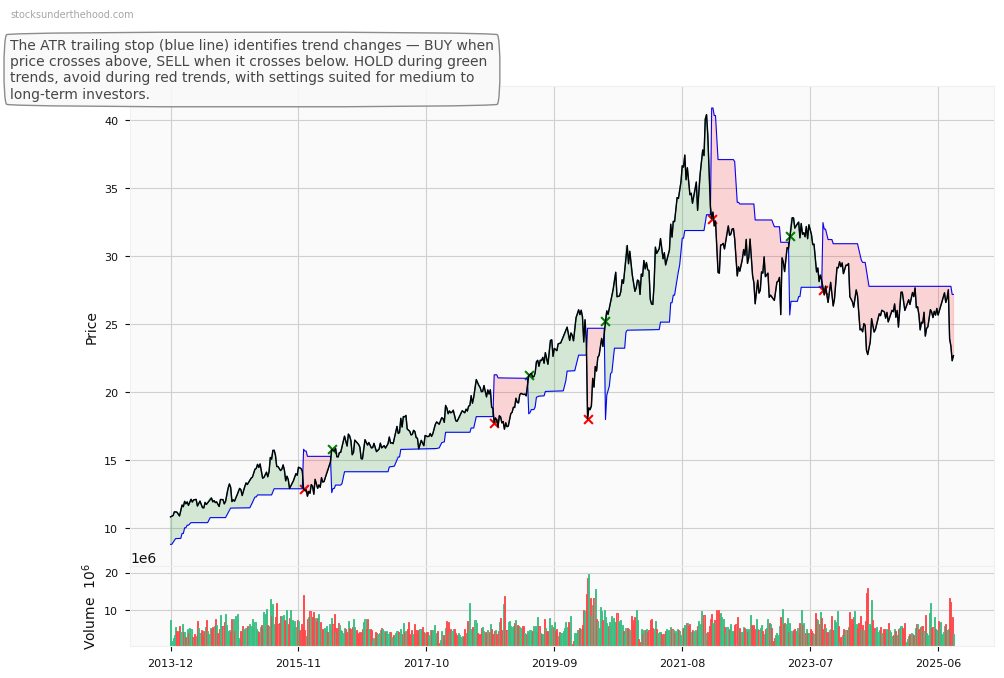
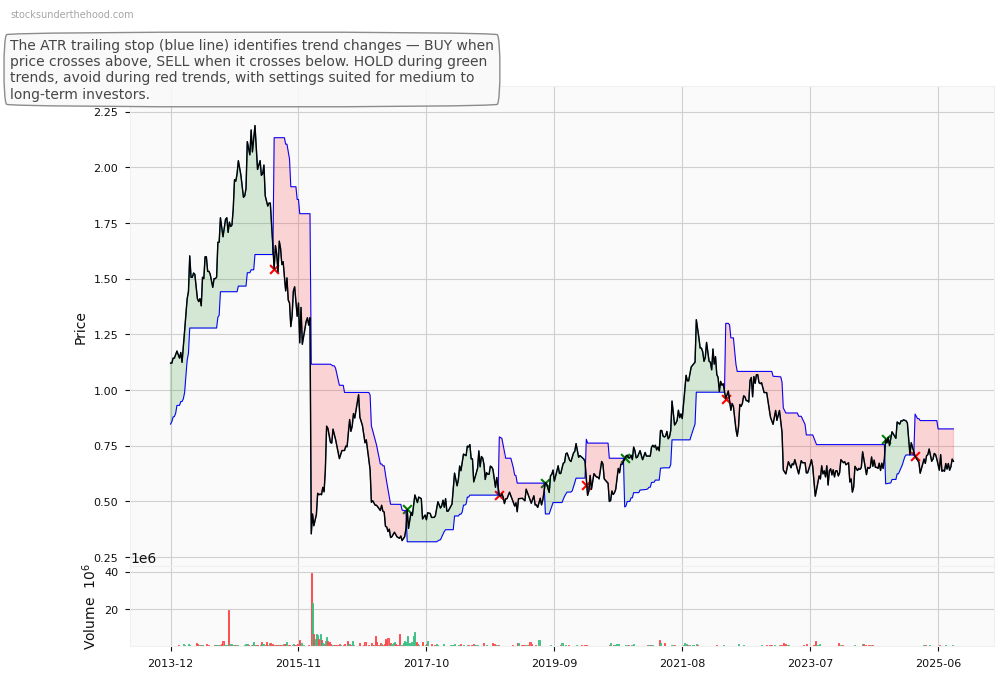
SHJ Weekly Price Chart with Average True Range (ATR) Trailing Stop (10-Year View)
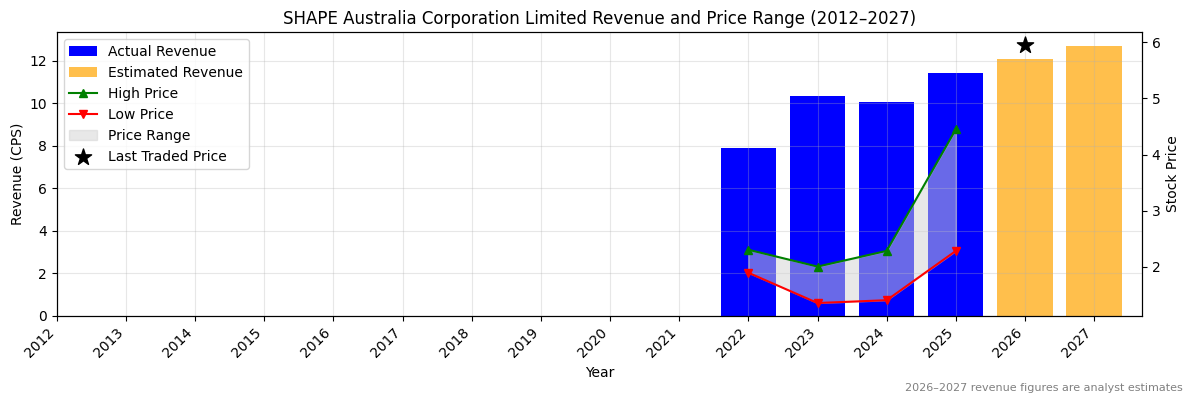
Ticker code: SHA
SHA Red Flags & Risk Indicators
❌
⚠️ RED FLAGS: 3 identified
- Low Operating Margin
- Increasing Shorts
- High Relative Valuation
Income Statement
| Revenue 2024 Per Share |
Revenue 2025e Per Share |
Revenue 2026e Per Share |
Revenue 24 to 25e [%] |
Revenue 25e to 26e [%] |
EBITDA 2024 Per Share |
EBITDA 2025e Per Share |
EBITDA 2026e Per Share |
EBITDA 24 to 25e [%] |
EBITDA 25e to 26e [%] |
| 10.04596 |
11.435 |
12.09377 |
13.8 |
5.8 |
0.31058 |
0.39215 |
0.43598 |
26.3 |
11.2 |
SHA Revenue Per Share (2012–2027)
✅
SHA Earnings before Interest, Tax, Depreciation and Amortisation (EBITDA) Per Share (2012–2027)
✅✅
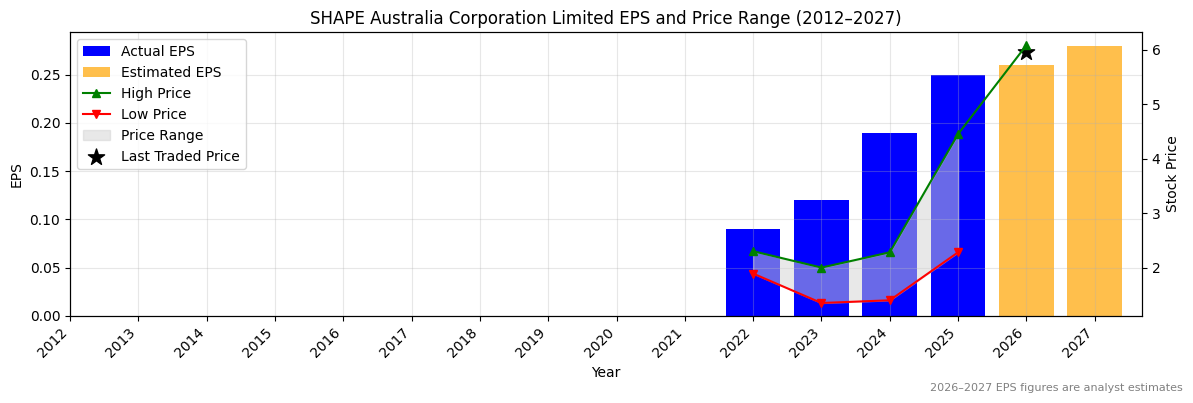
SHA Normalised Earnings Per Share (EPS) (2012–2027)
✅✅
Valuation
| Price To Sales |
Price To Book |
PER 2023 |
PER 2024 |
13Y Median PER Low |
PER 2025e |
13Y Median PER High |
PER 2026e |
Last Updated |
| 0.5 |
13.0 |
48.2 |
30.5 |
10.2 |
23.2 |
17.8 |
22.3 |
4/10/25 |
SHA Yearly Price Earnings Ratio (PER) Highs and Lows
❌
SHA Weekly Price Chart with Average True Range (ATR) Trailing Stop (10-Year View)
Ticker code: SGR
SGR Red Flags & Risk Indicators
⚠️
⚠️ RED FLAGS: 2 identified
- Increasing Shorts
- Falling Earnings
Income Statement
| Revenue 2024 Per Share |
Revenue 2025e Per Share |
Revenue 2026e Per Share |
Revenue 24 to 25e [%] |
Revenue 25e to 26e [%] |
EBITDA 2024 Per Share |
EBITDA 2025e Per Share |
EBITDA 2026e Per Share |
EBITDA 24 to 25e [%] |
EBITDA 25e to 26e [%] |
| 0.58623 |
None |
None |
None |
None |
0.06227 |
0.06845 |
0.09131 |
9.9 |
33.4 |
SGR Revenue Per Share (2012–2027)
SGR Earnings before Interest, Tax, Depreciation and Amortisation (EBITDA) Per Share (2012–2027)
✅
SGR Normalised Earnings Per Share (EPS) (2012–2027)
❌
Valuation
| Price To Sales |
Price To Book |
PER 2023 |
PER 2024 |
13Y Median PER Low |
PER 2025e |
13Y Median PER High |
PER 2026e |
Last Updated |
| 0.2 |
0.6 |
2.2 |
8.9 |
14.4 |
-1.5 |
21.7 |
-1.8 |
13/8/24 |
SGR Yearly Price Earnings Ratio (PER) Highs and Lows
✅✅
SGR Weekly Price Chart with Average True Range (ATR) Trailing Stop (10-Year View)
Ticker code: SGP
SGP Red Flags & Risk Indicators
❌
⚠️ RED FLAGS: 3 identified
- Increasing Shorts
- Falling Earnings
- High Relative Valuation
Income Statement
| Revenue 2024 Per Share |
Revenue 2025e Per Share |
Revenue 2026e Per Share |
Revenue 24 to 25e [%] |
Revenue 25e to 26e [%] |
EBITDA 2024 Per Share |
EBITDA 2025e Per Share |
EBITDA 2026e Per Share |
EBITDA 24 to 25e [%] |
EBITDA 25e to 26e [%] |
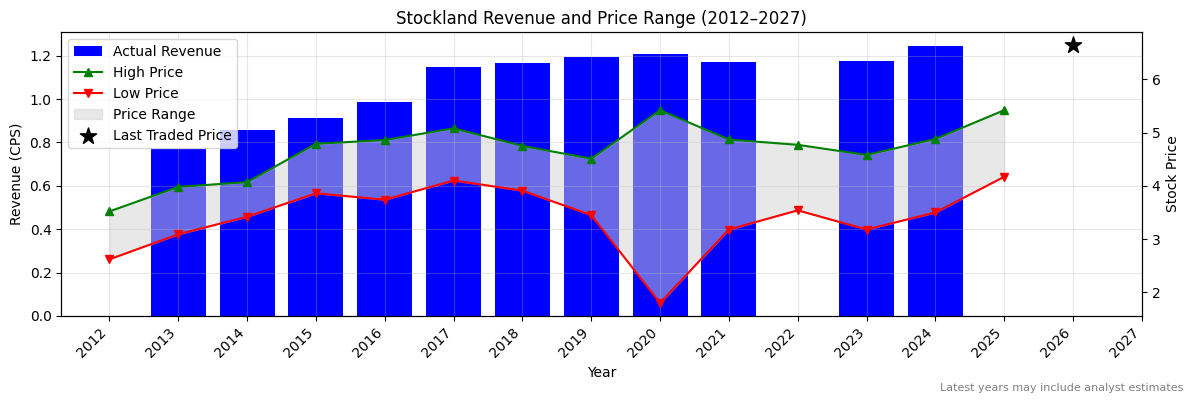
| 1.24583 |
None |
None |
None |
None |
0.29365 |
None |
None |
None |
None |
SGP Revenue Per Share (2012–2027)
SGP Earnings before Interest, Tax, Depreciation and Amortisation (EBITDA) Per Share (2012–2027)
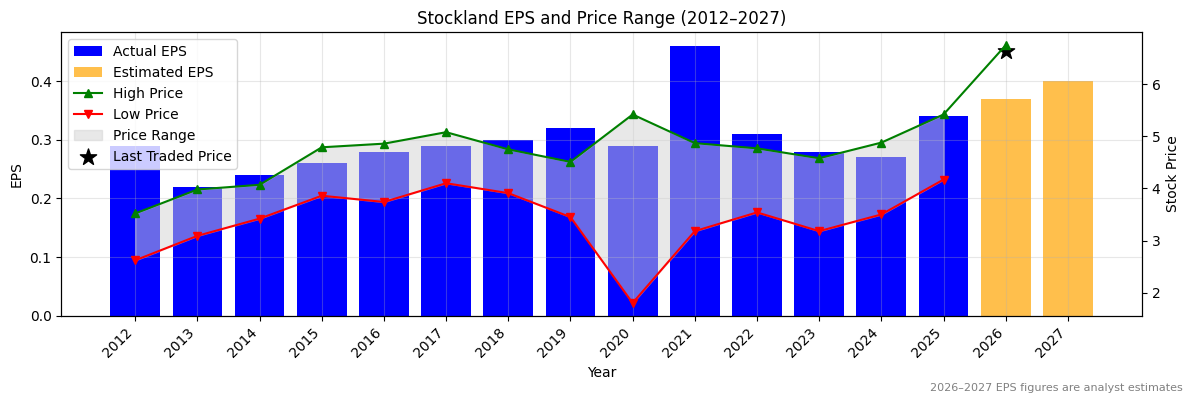
SGP Normalised Earnings Per Share (EPS) (2012–2027)
✅✅
Valuation
| Price To Sales |
Price To Book |
PER 2023 |
PER 2024 |
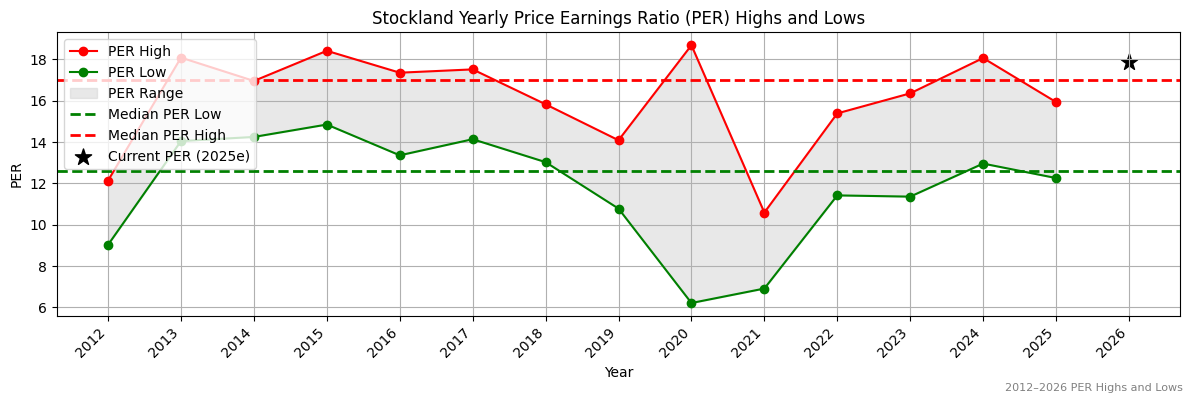
13Y Median PER Low |
PER 2025e |
13Y Median PER High |
PER 2026e |
Last Updated |
| 4.8 |
1.5 |
22.5 |
23.4 |
12.6 |
18.6 |
17.0 |
17.1 |
14/1/22 |
SGP Yearly Price Earnings Ratio (PER) Highs and Lows
❌
SGP Weekly Price Chart with Average True Range (ATR) Trailing Stop (10-Year View)
Ticker code: SGM
SGM Red Flags & Risk Indicators
⚠️
⚠️ RED FLAGS: 2 identified
- Increasing Shorts
- Falling Earnings
Income Statement
| Revenue 2024 Per Share |
Revenue 2025e Per Share |
Revenue 2026e Per Share |
Revenue 24 to 25e [%] |
Revenue 25e to 26e [%] |
EBITDA 2024 Per Share |
EBITDA 2025e Per Share |
EBITDA 2026e Per Share |
EBITDA 24 to 25e [%] |
EBITDA 25e to 26e [%] |
| 38.0745 |
None |
None |
None |
None |
2.53542 |
2.88458 |
None |
13.8 |
None |
SGM Revenue Per Share (2012–2027)
SGM Earnings before Interest, Tax, Depreciation and Amortisation (EBITDA) Per Share (2012–2027)
✅
SGM Normalised Earnings Per Share (EPS) (2012–2027)
✅✅
Valuation
| Price To Sales |
Price To Book |
PER 2023 |
PER 2024 |
13Y Median PER Low |
PER 2025e |
13Y Median PER High |
PER 2026e |
Last Updated |
| 0.4 |
1.2 |
20.2 |
-66.5 |
14.1 |
32.6 |
25.7 |
17.0 |
26/2/23 |
SGM Yearly Price Earnings Ratio (PER) Highs and Lows
❌
SGM Weekly Price Chart with Average True Range (ATR) Trailing Stop (10-Year View)
Ticker code: SFR
SFR Red Flags & Risk Indicators
⚠️
⚠️ RED FLAGS: 2 identified
- Highly Shorted
- High Relative Valuation
Income Statement
| Revenue 2024 Per Share |
Revenue 2025e Per Share |
Revenue 2026e Per Share |
Revenue 24 to 25e [%] |
Revenue 25e to 26e [%] |
EBITDA 2024 Per Share |
EBITDA 2025e Per Share |
EBITDA 2026e Per Share |
EBITDA 24 to 25e [%] |
EBITDA 25e to 26e [%] |
| 3.0139 |
3.95286 |
4.34242 |
31.2 |
9.9 |
1.16727 |
1.77046 |
1.96611 |
51.7 |
11.1 |
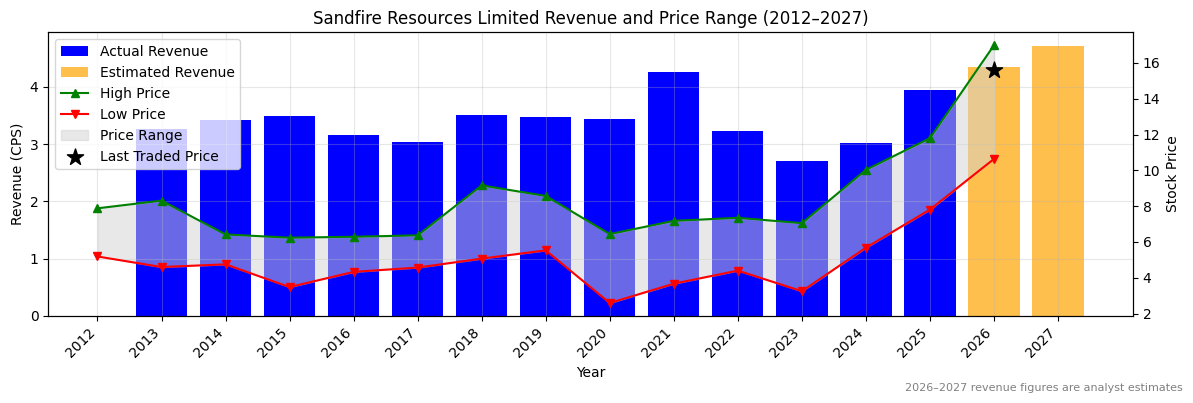
SFR Revenue Per Share (2012–2027)
✅✅
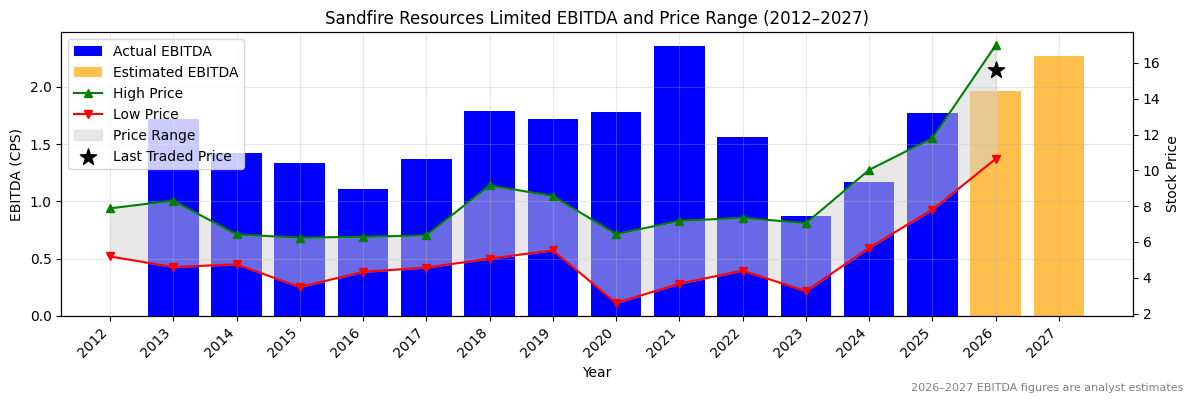
SFR Earnings before Interest, Tax, Depreciation and Amortisation (EBITDA) Per Share (2012–2027)
✅✅
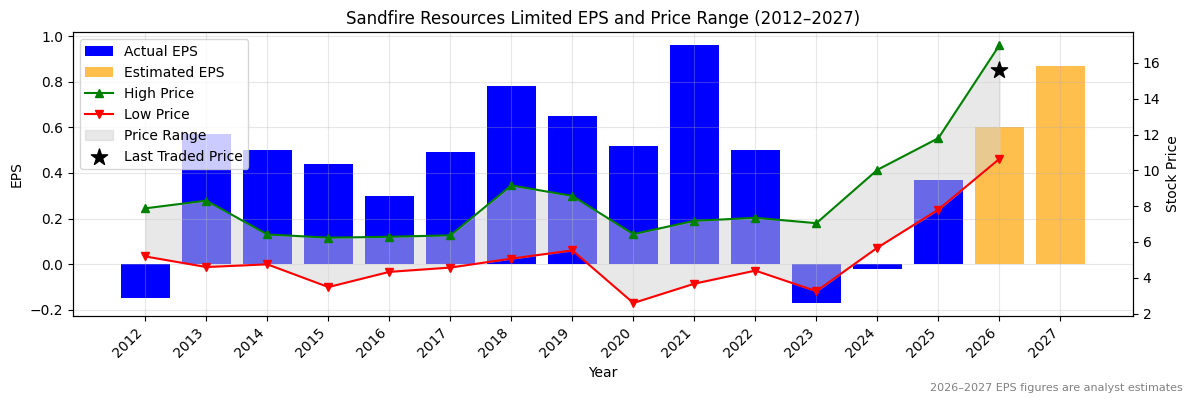
SFR Normalised Earnings Per Share (EPS) (2012–2027)
✅✅
Valuation
| Price To Sales |
Price To Book |
PER 2023 |
PER 2024 |
13Y Median PER Low |
PER 2025e |
13Y Median PER High |
PER 2026e |
Last Updated |
| 6.3 |
4.2 |
-95.5 |
-812.0 |
8.7 |
43.9 |
13.7 |
27.1 |
8/9/25 |
SFR Yearly Price Earnings Ratio (PER) Highs and Lows
❌
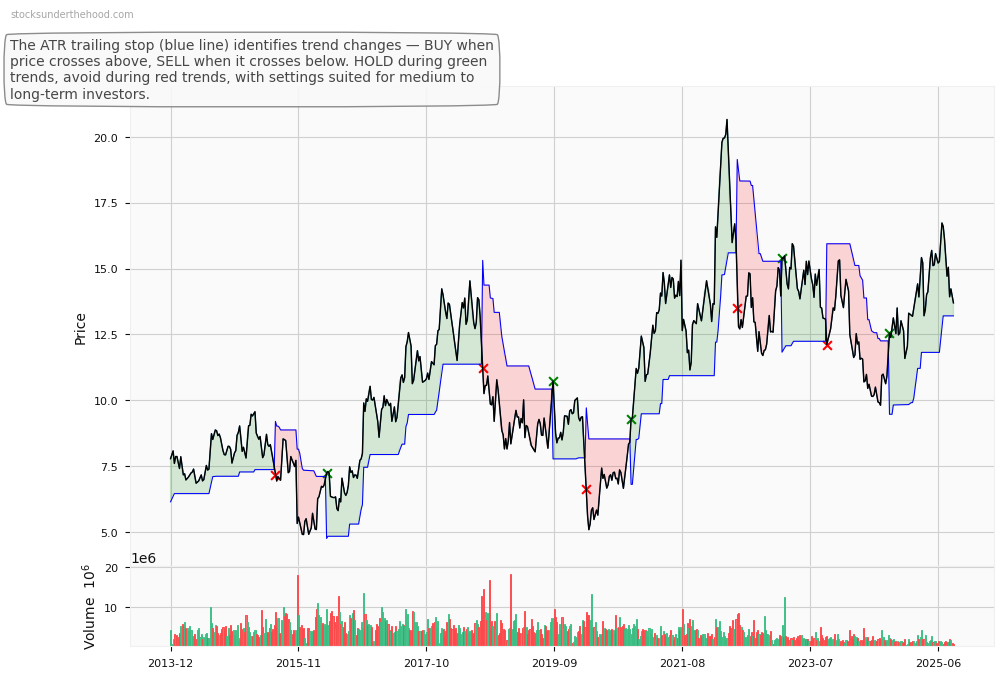
SFR Weekly Price Chart with Average True Range (ATR) Trailing Stop (10-Year View)
Ticker code: SFC
SFC Red Flags & Risk Indicators
❌
⚠️ RED FLAGS: 3 identified
- Falling Earnings
- High Price to Book vs ROE
- High Relative Valuation
Income Statement
| Revenue 2024 Per Share |
Revenue 2025e Per Share |
Revenue 2026e Per Share |
Revenue 24 to 25e [%] |
Revenue 25e to 26e [%] |
EBITDA 2024 Per Share |
EBITDA 2025e Per Share |
EBITDA 2026e Per Share |
EBITDA 24 to 25e [%] |
EBITDA 25e to 26e [%] |
| 16.37673 |
None |
None |
None |
None |
2.91336 |
None |
None |
None |
None |
SFC Revenue Per Share (2012–2027)
SFC Earnings before Interest, Tax, Depreciation and Amortisation (EBITDA) Per Share (2012–2027)
SFC Normalised Earnings Per Share (EPS) (2012–2027)
Valuation
| Price To Sales |
Price To Book |
PER 2023 |
PER 2024 |
13Y Median PER Low |
PER 2025e |
13Y Median PER High |
PER 2026e |
Last Updated |
| 1.2 |
1.1 |
None |
None |
7.7 |
None |
10.5 |
None |
4/4/24 |
SFC Yearly Price Earnings Ratio (PER) Highs and Lows
SFC Weekly Price Chart with Average True Range (ATR) Trailing Stop (10-Year View)