Ticker code: SEQ
SEQ Red Flags & Risk Indicators
⚠️
⚠️ RED FLAGS: 2 identified
- Falling Earnings
- High Relative Valuation
Income Statement
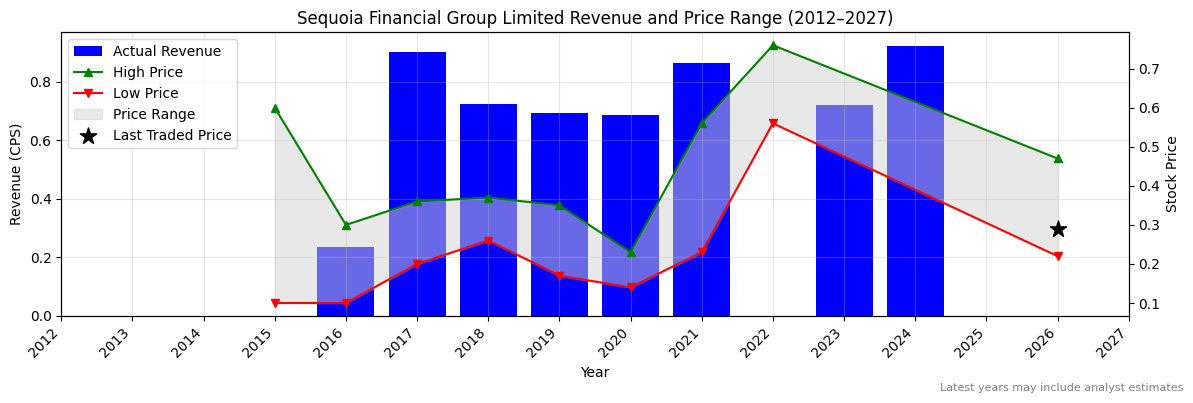
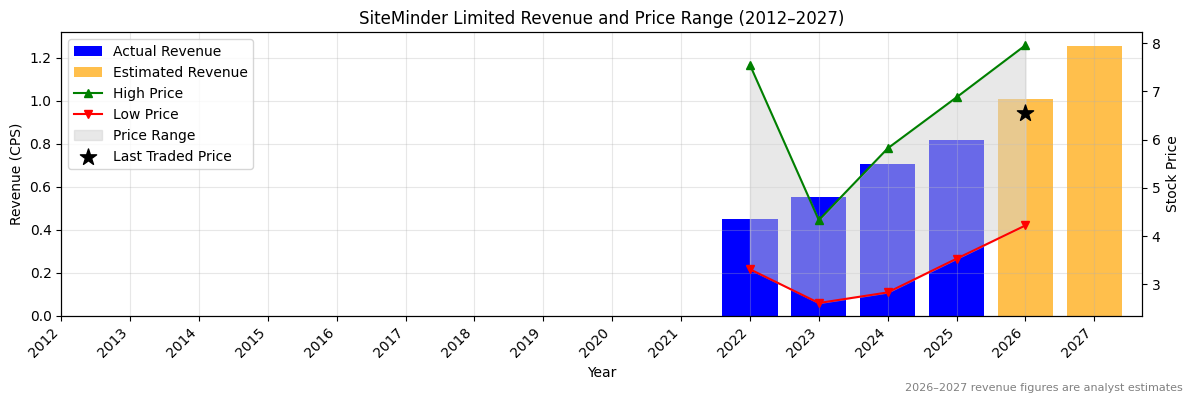
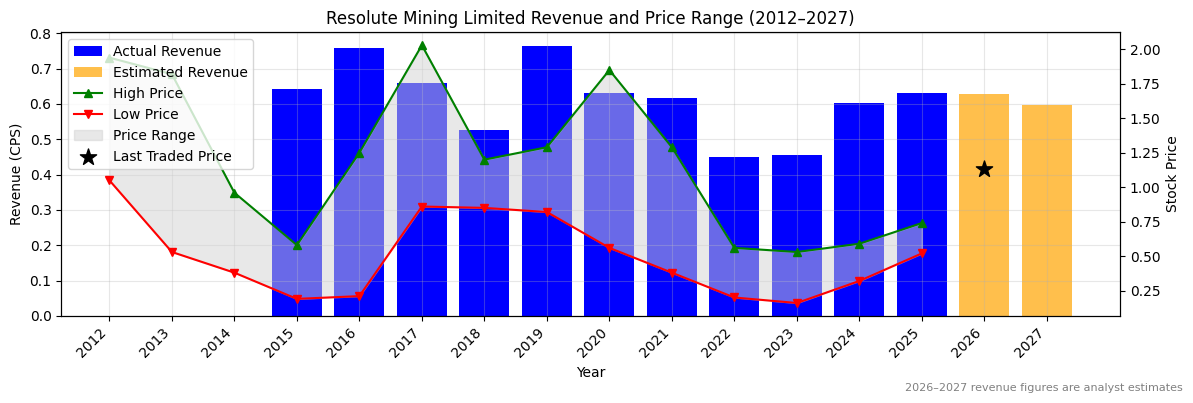
| Revenue 2024 Per Share |
Revenue 2025e Per Share |
Revenue 2026e Per Share |
Revenue 24 to 25e [%] |
Revenue 25e to 26e [%] |
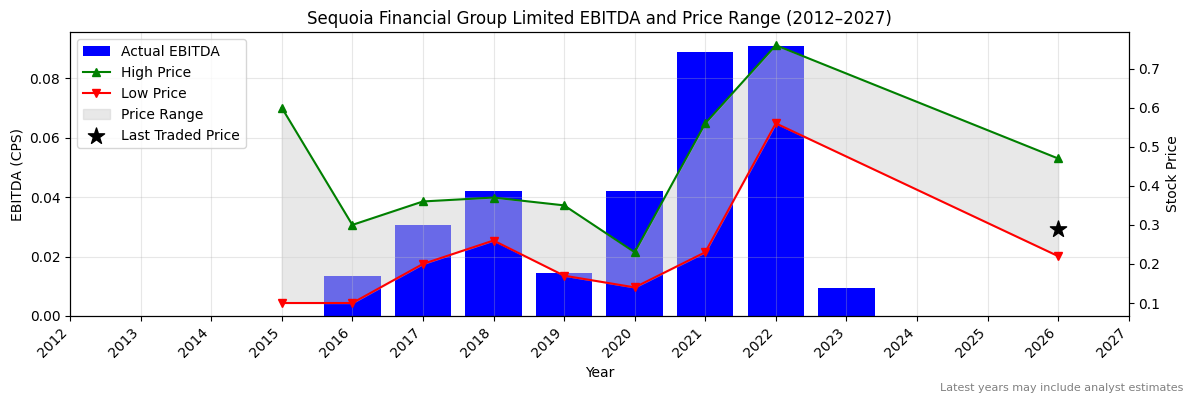
EBITDA 2024 Per Share |
EBITDA 2025e Per Share |
EBITDA 2026e Per Share |
EBITDA 24 to 25e [%] |
EBITDA 25e to 26e [%] |
| 0.92309 |
None |
None |
None |
None |
None |
None |
None |
None |
None |
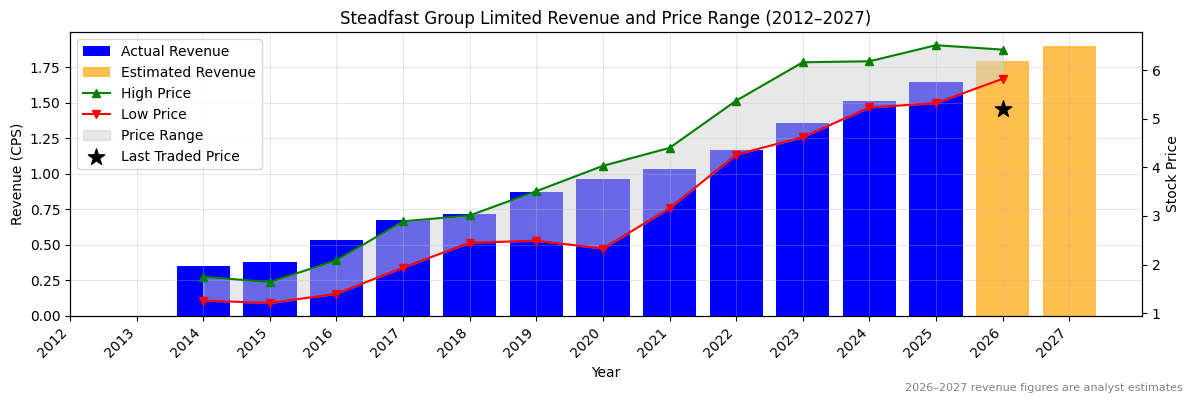
SEQ Revenue Per Share (2012–2027)
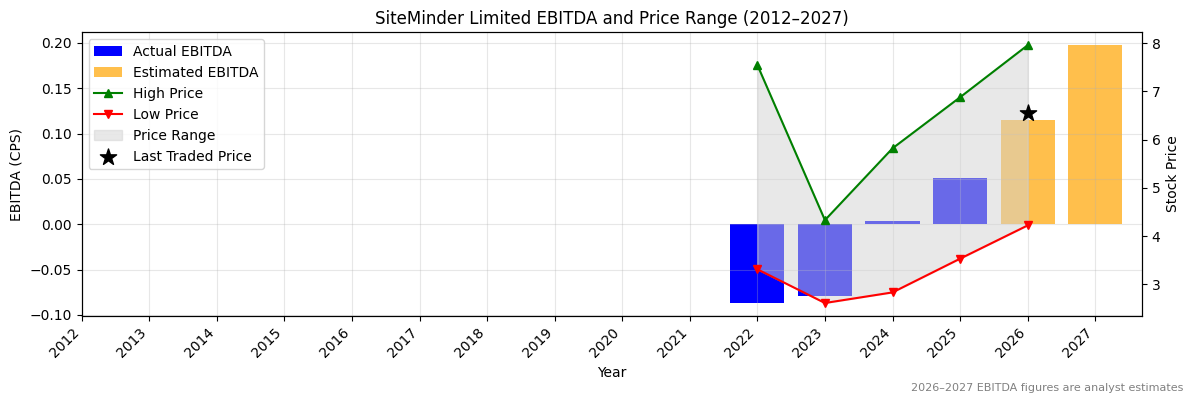
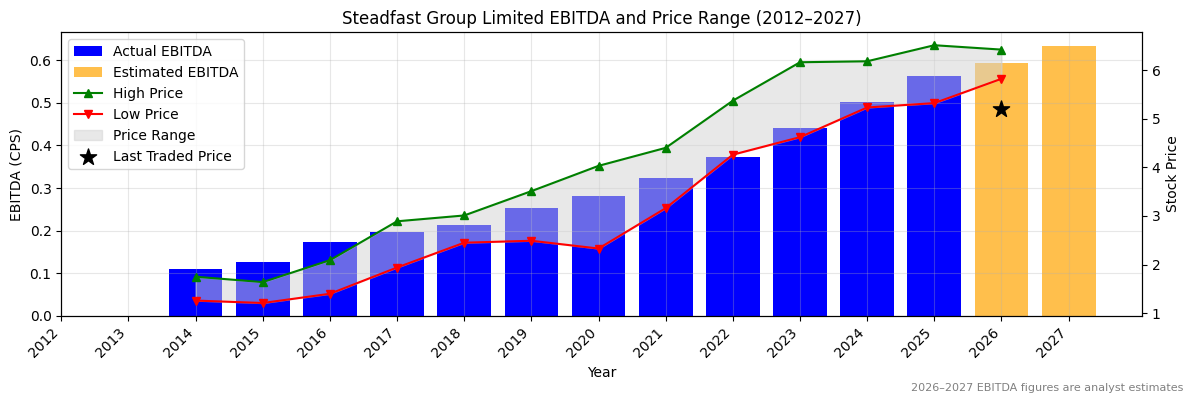
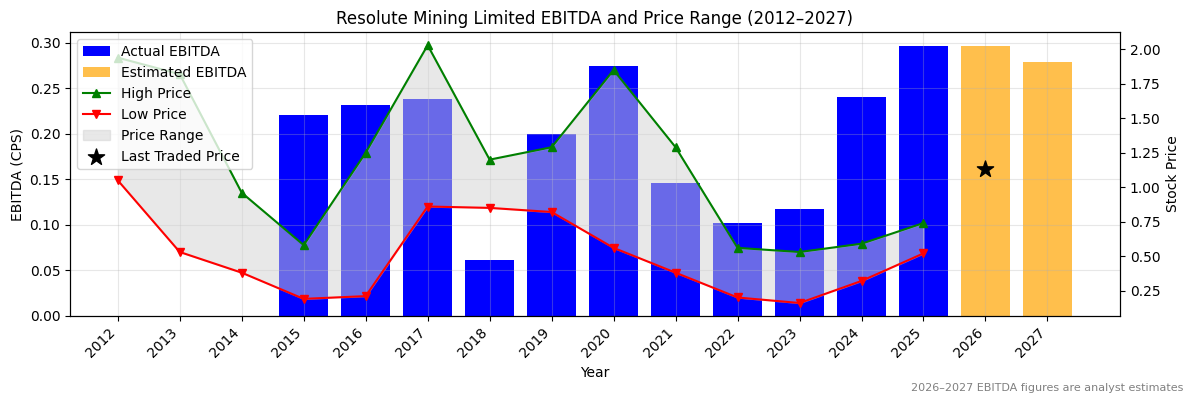
SEQ Earnings before Interest, Tax, Depreciation and Amortisation (EBITDA) Per Share (2012–2027)
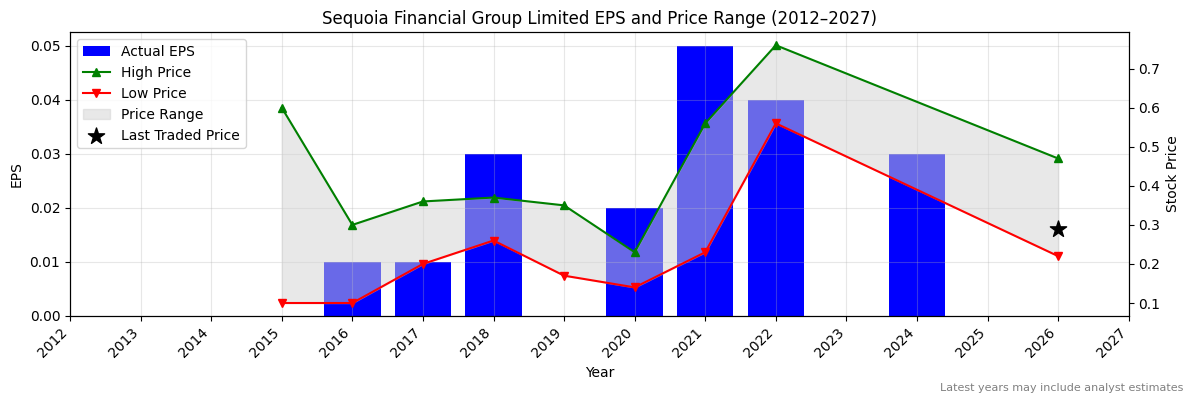
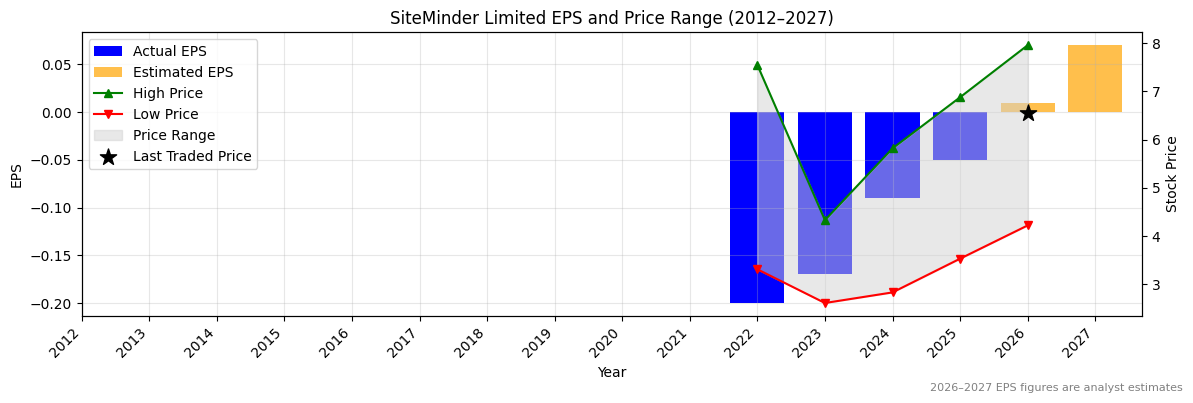
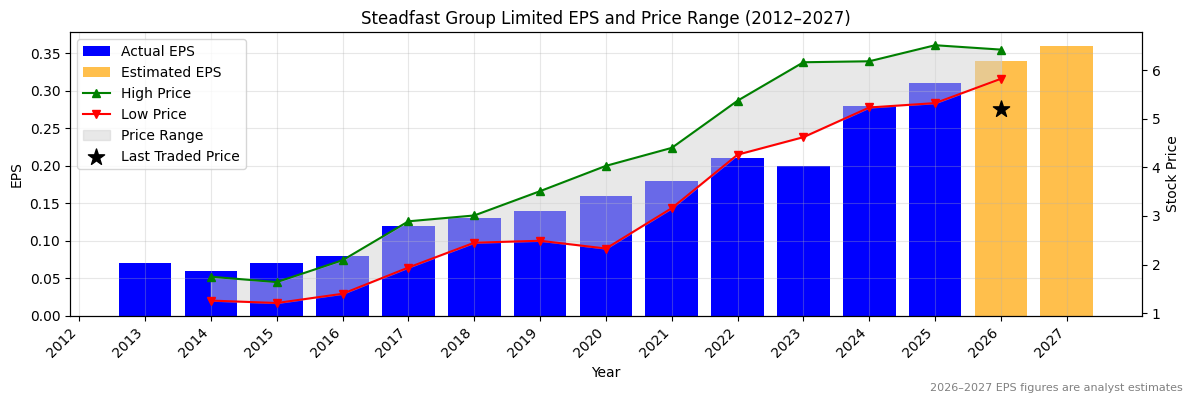
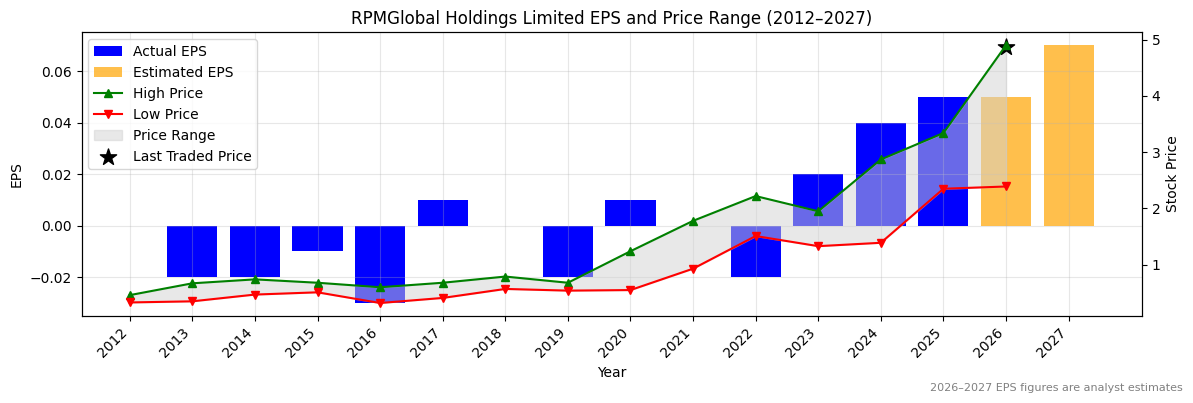
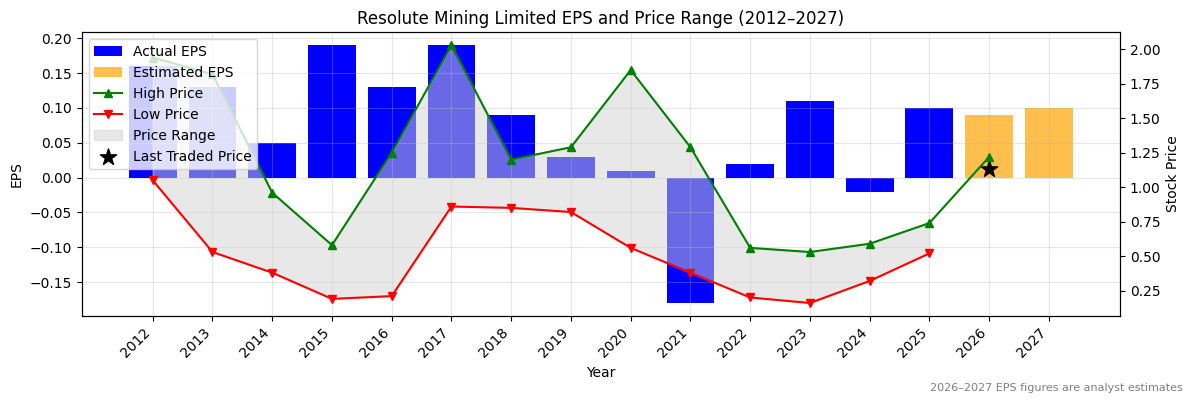
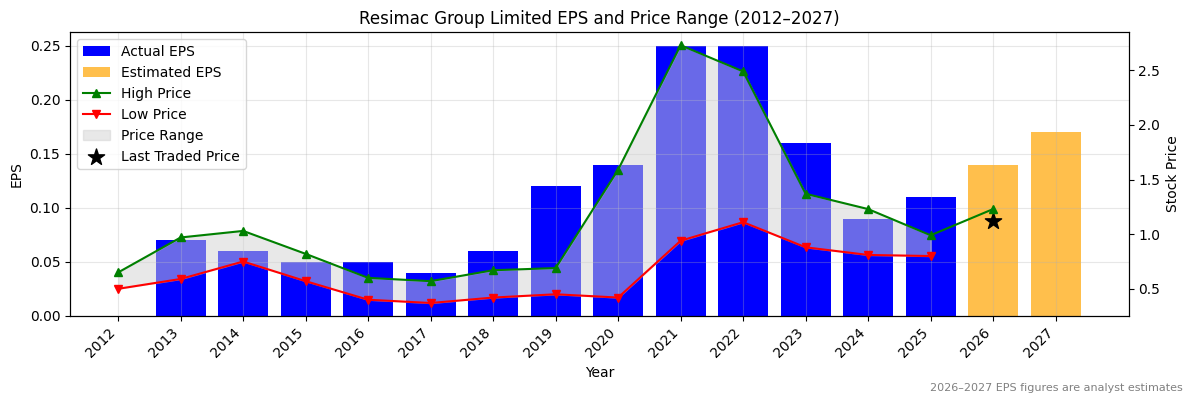
SEQ Normalised Earnings Per Share (EPS) (2012–2027)
Valuation
| Price To Sales |
Price To Book |
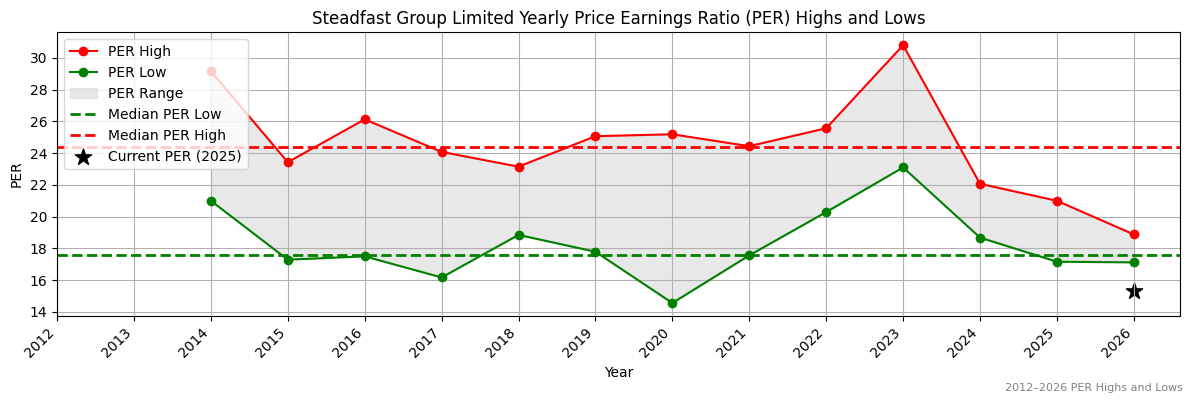
PER 2023 |
PER 2024 |
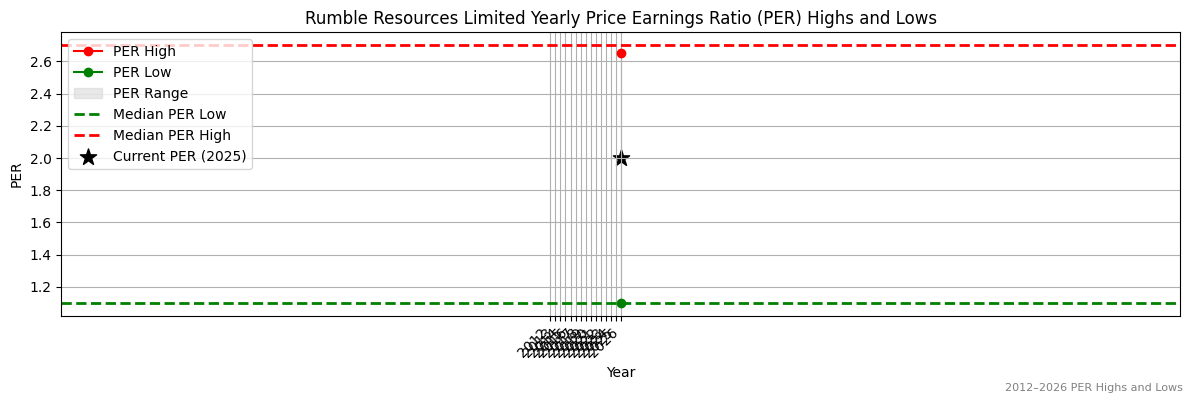
13Y Median PER Low |
PER 2025e |
13Y Median PER High |
PER 2026e |
Last Updated |
| 0.3 |
0.7 |
None |
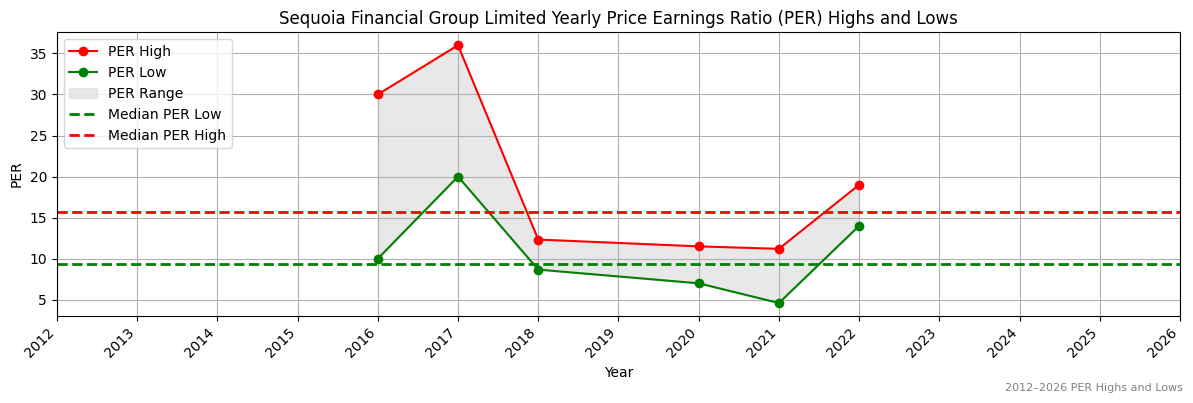
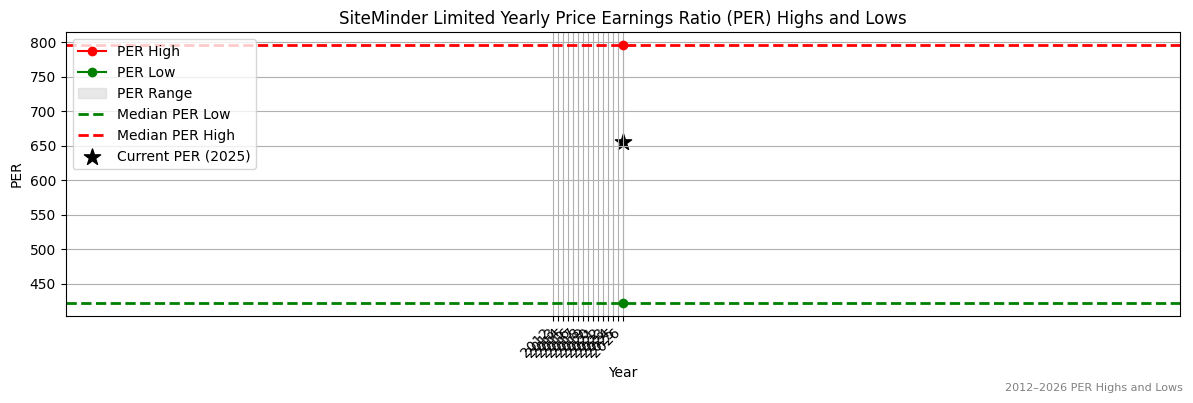
9.5 |
9.3 |
None |
15.7 |
None |
2/7/24 |
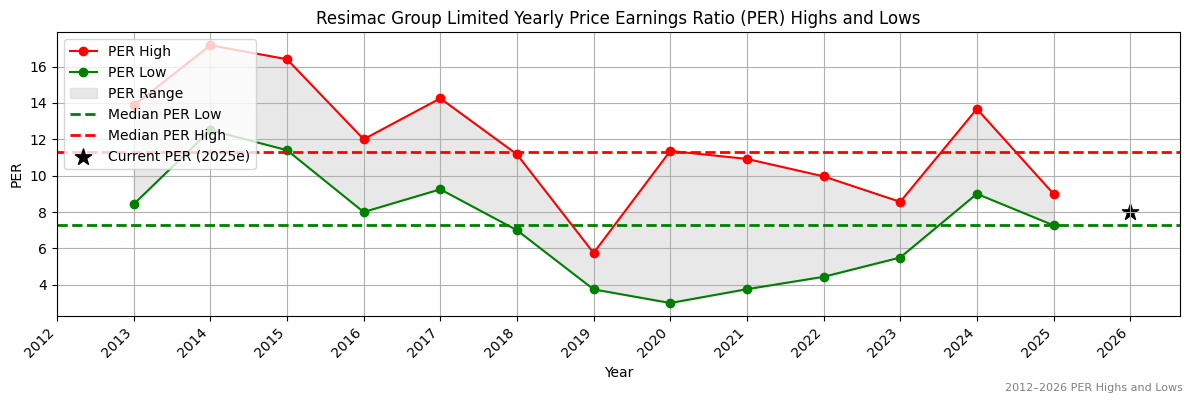
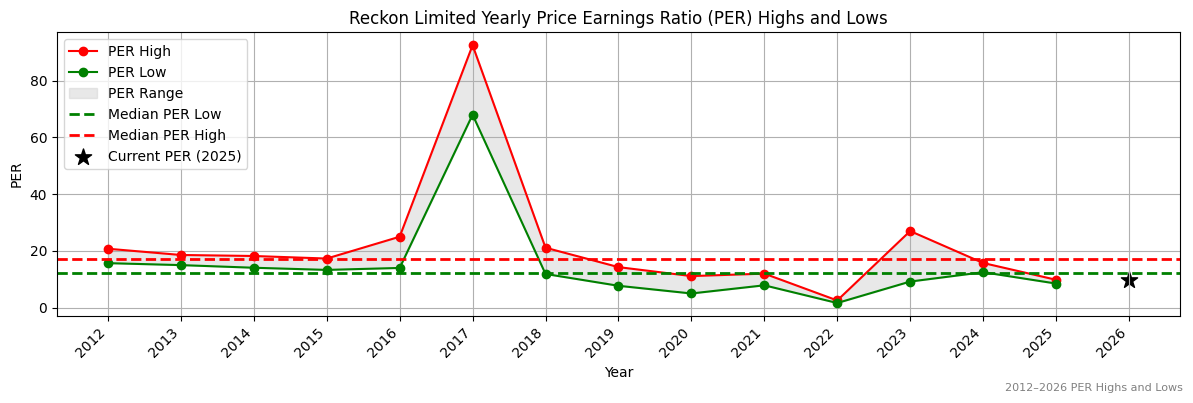
SEQ Yearly Price Earnings Ratio (PER) Highs and Lows
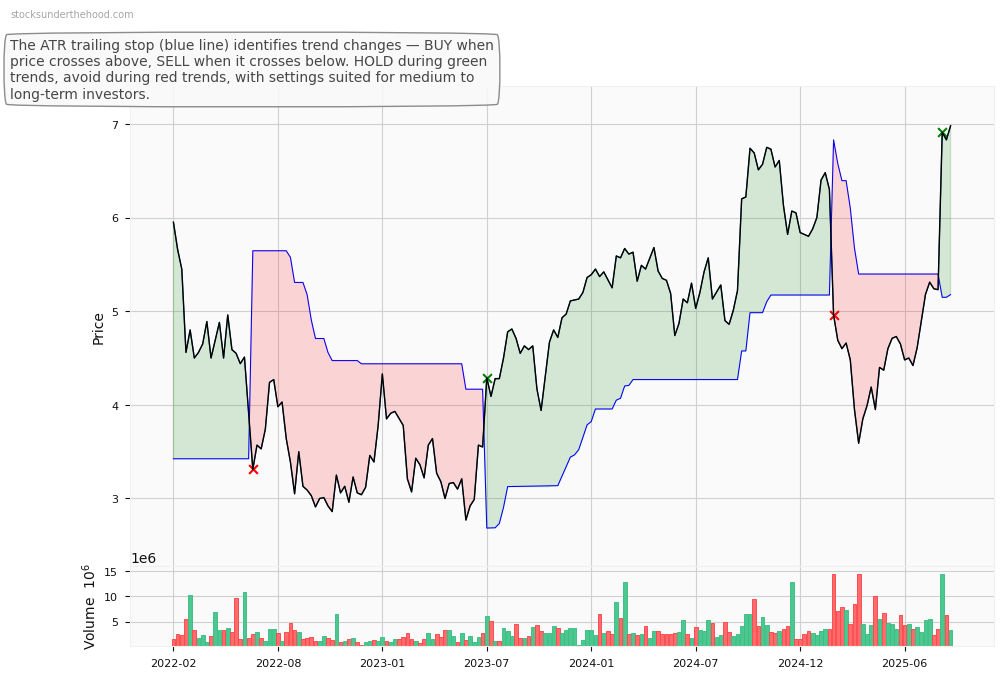
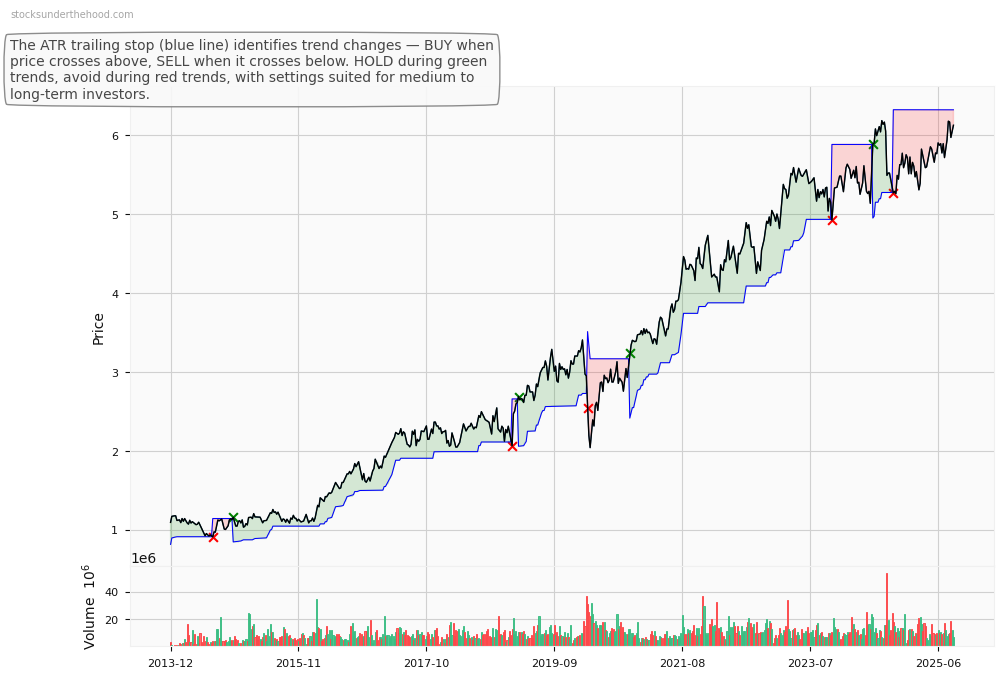
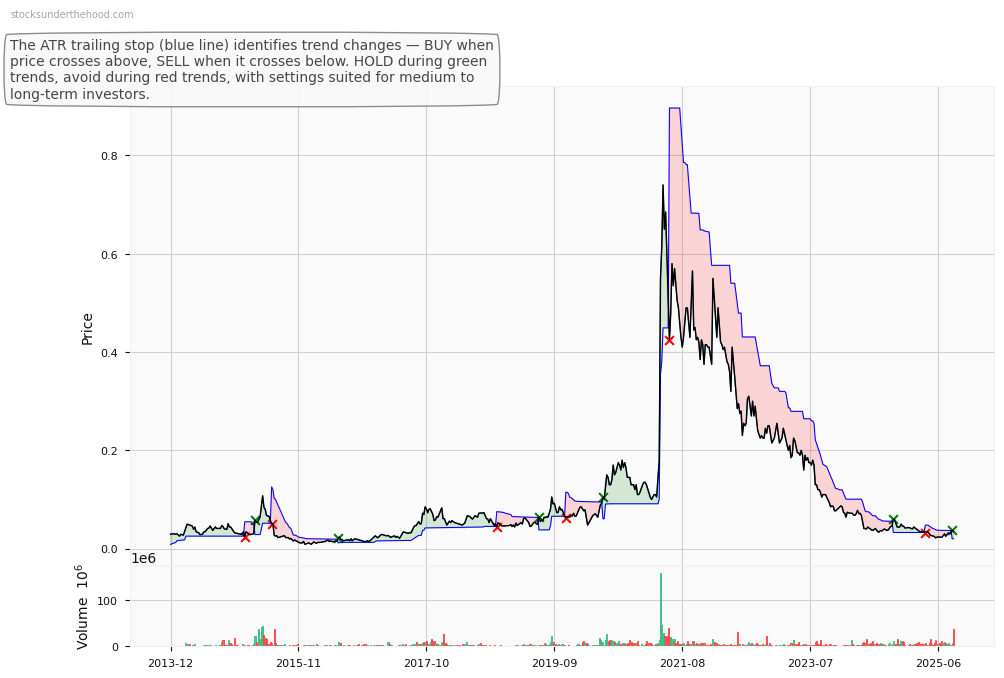
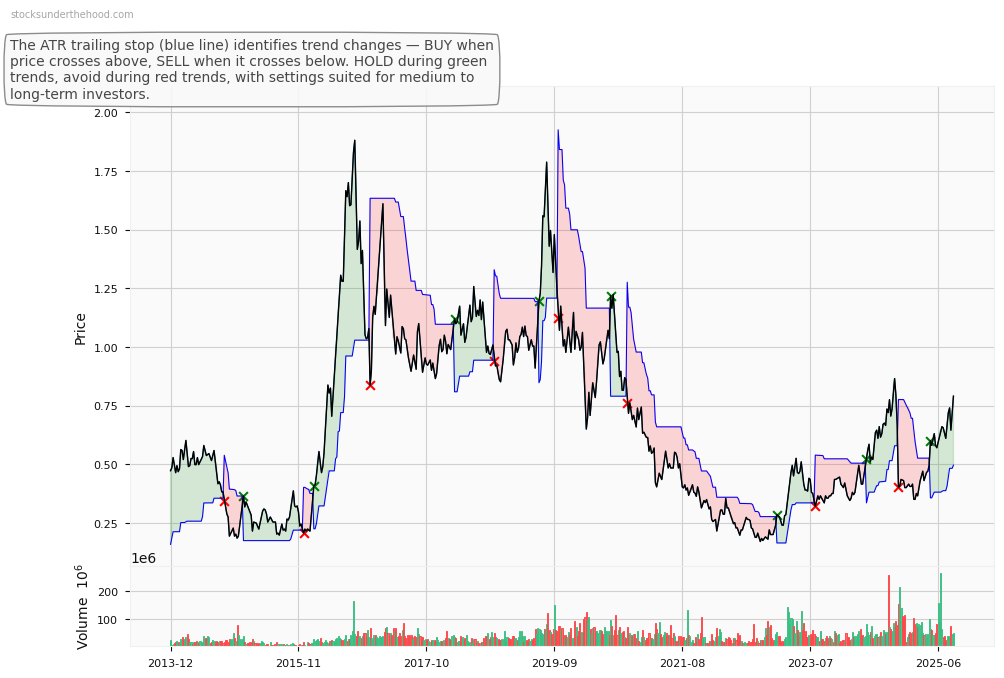
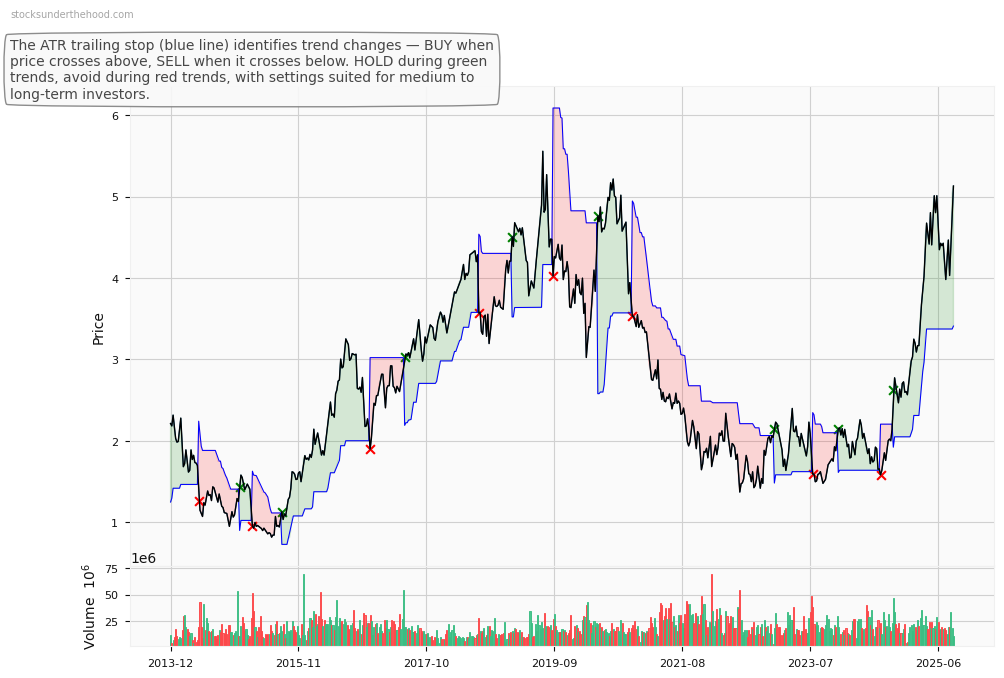
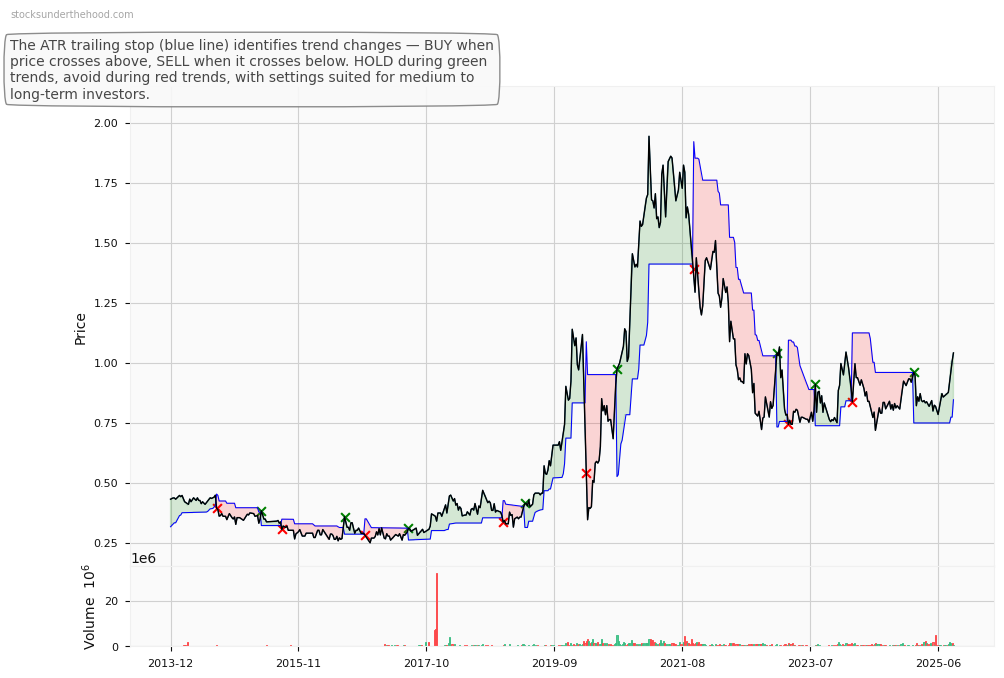
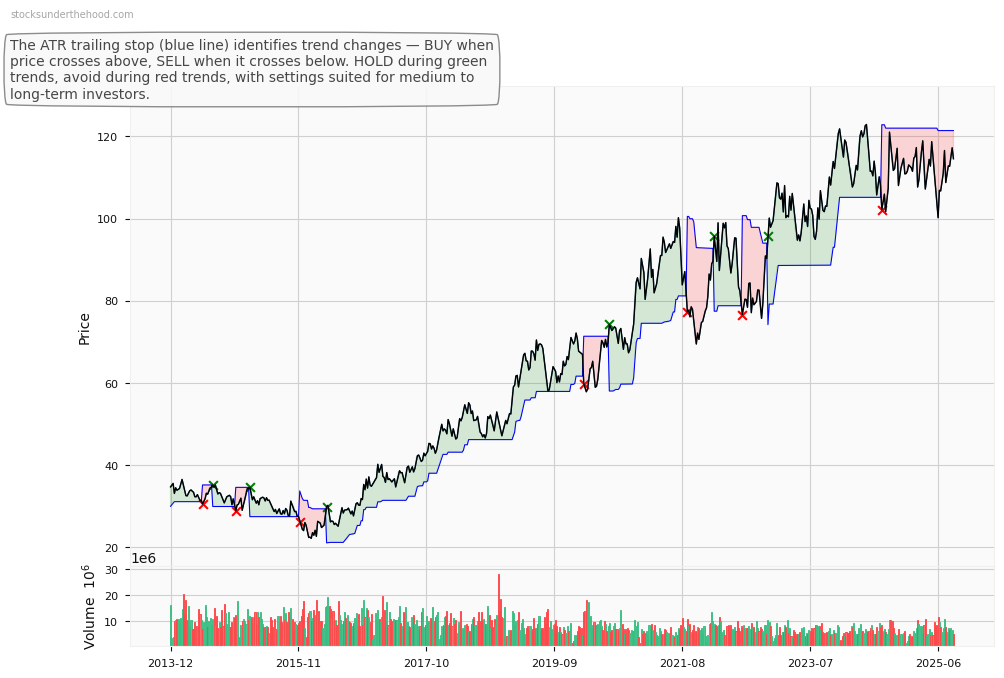
SEQ Weekly Price Chart with Average True Range (ATR) Trailing Stop (10-Year View)
Ticker code: SEK
SEK Red Flags & Risk Indicators
❌
⚠️ RED FLAGS: 3 identified
- Increasing Shorts
- Falling Earnings
- High Relative Valuation
Income Statement
| Revenue 2024 Per Share |
Revenue 2025e Per Share |
Revenue 2026e Per Share |
Revenue 24 to 25e [%] |
Revenue 25e to 26e [%] |
EBITDA 2024 Per Share |
EBITDA 2025e Per Share |
EBITDA 2026e Per Share |
EBITDA 24 to 25e [%] |
EBITDA 25e to 26e [%] |
| 3.04865 |
None |
None |
None |
None |
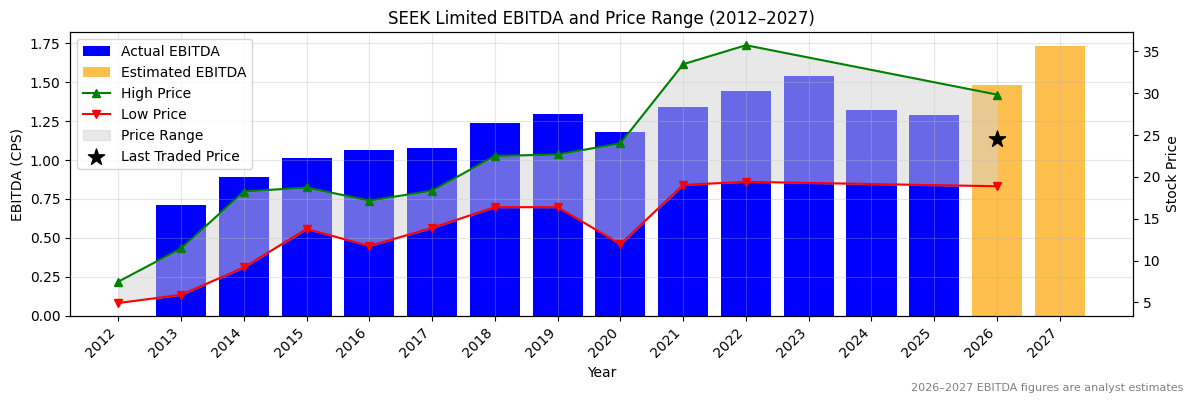
1.31862 |
1.28808 |
1.47996 |
-2.3 |
14.9 |
SEK Revenue Per Share (2012–2027)
SEK Earnings before Interest, Tax, Depreciation and Amortisation (EBITDA) Per Share (2012–2027)
❌
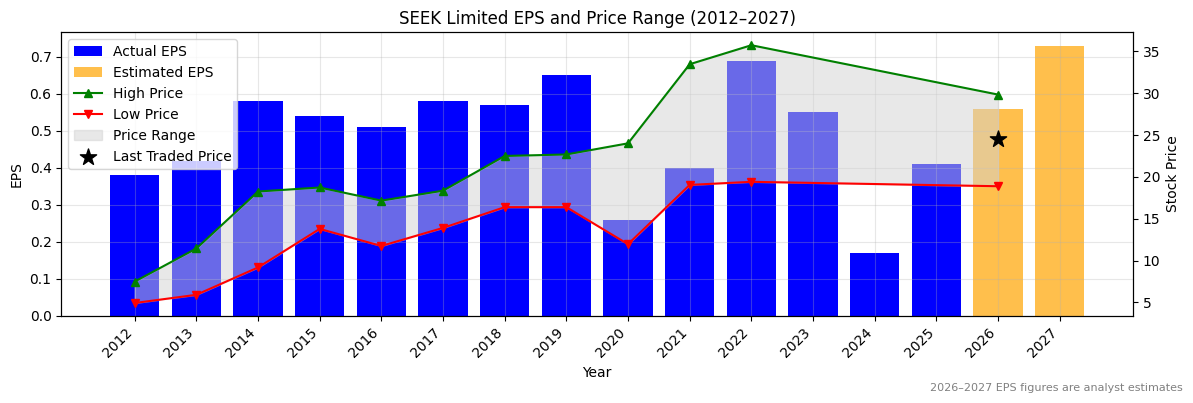
SEK Normalised Earnings Per Share (EPS) (2012–2027)
✅✅
Valuation
| Price To Sales |
Price To Book |
PER 2023 |
PER 2024 |
13Y Median PER Low |
PER 2025e |
13Y Median PER High |
PER 2026e |
Last Updated |
| 8.8 |
3.6 |
49.3 |
159.4 |
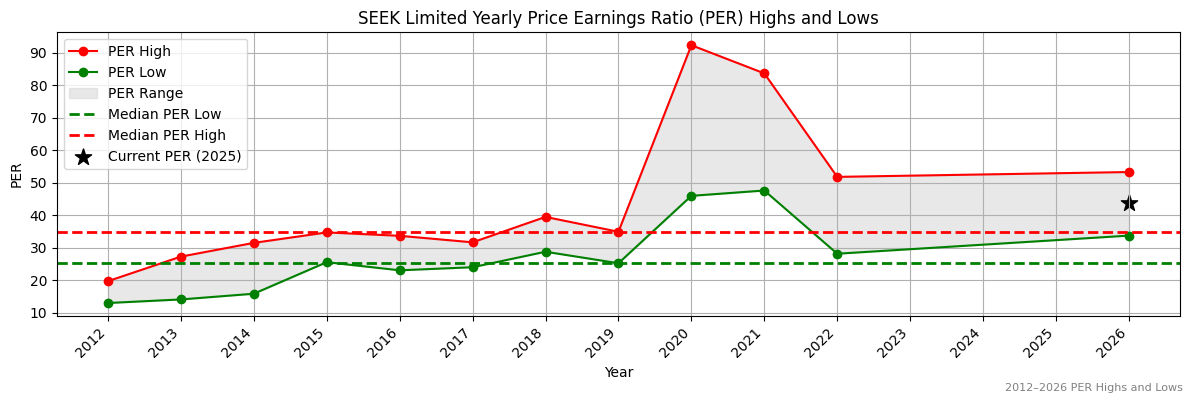
25.4 |
66.1 |
34.8 |
48.4 |
4/10/25 |
SEK Yearly Price Earnings Ratio (PER) Highs and Lows
❌
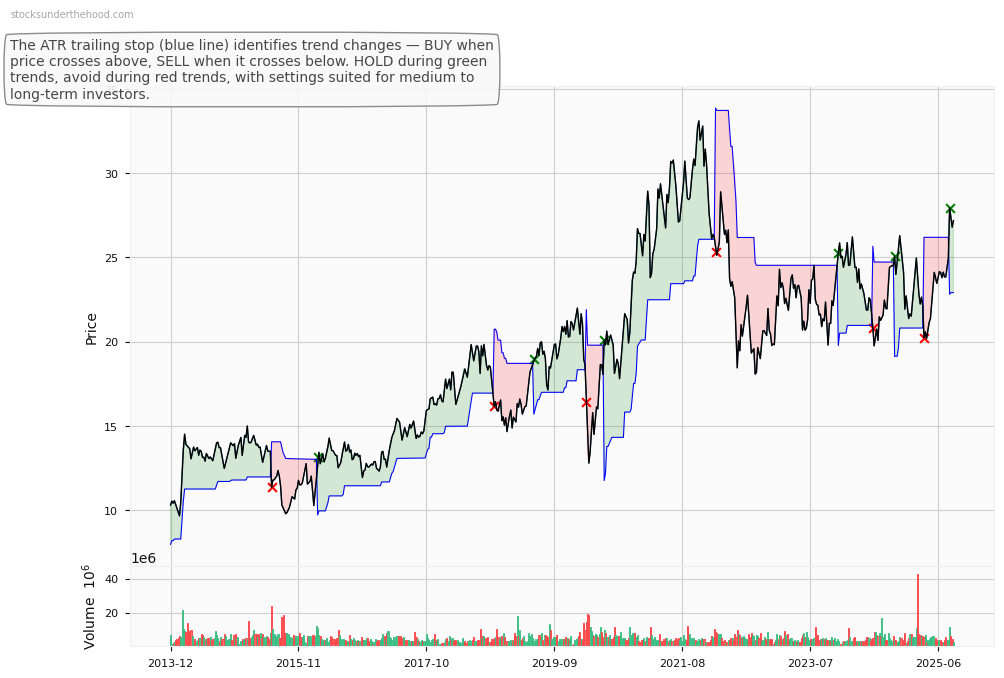
SEK Weekly Price Chart with Average True Range (ATR) Trailing Stop (10-Year View)
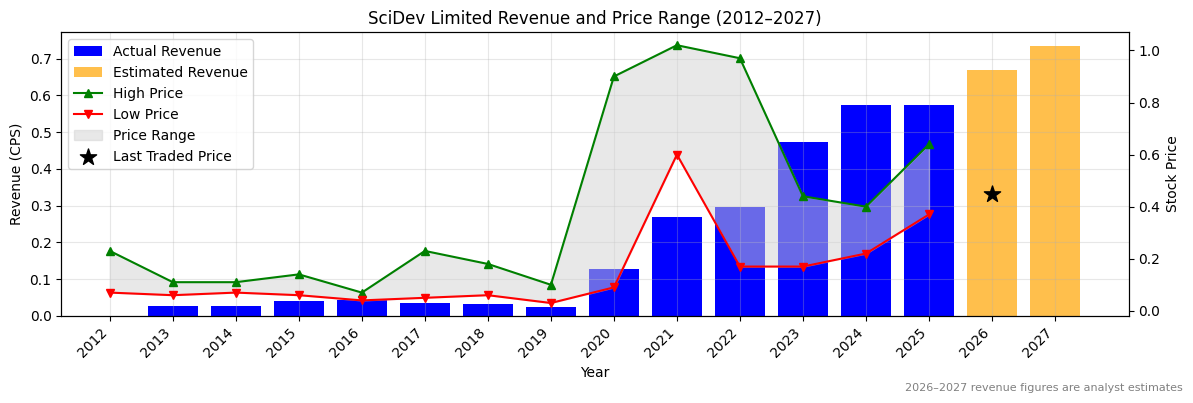
Ticker code: SDV
SDV Red Flags & Risk Indicators
⚠️
⚠️ RED FLAGS: 2 identified
- Increasing Shorts
- Falling Revenues
Income Statement
| Revenue 2024 Per Share |
Revenue 2025e Per Share |
Revenue 2026e Per Share |
Revenue 24 to 25e [%] |
Revenue 25e to 26e [%] |
EBITDA 2024 Per Share |
EBITDA 2025e Per Share |
EBITDA 2026e Per Share |
EBITDA 24 to 25e [%] |
EBITDA 25e to 26e [%] |
| 0.57526 |
0.57451 |
0.67021 |
-0.1 |
16.7 |
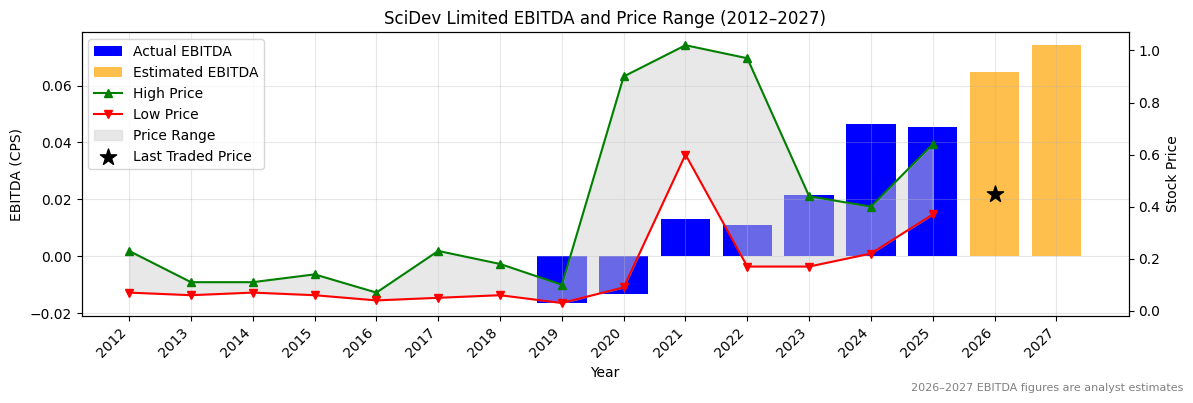
0.04655 |
0.04529 |
0.06471 |
-2.7 |
42.9 |
SDV Revenue Per Share (2012–2027)
❌
SDV Earnings before Interest, Tax, Depreciation and Amortisation (EBITDA) Per Share (2012–2027)
❌
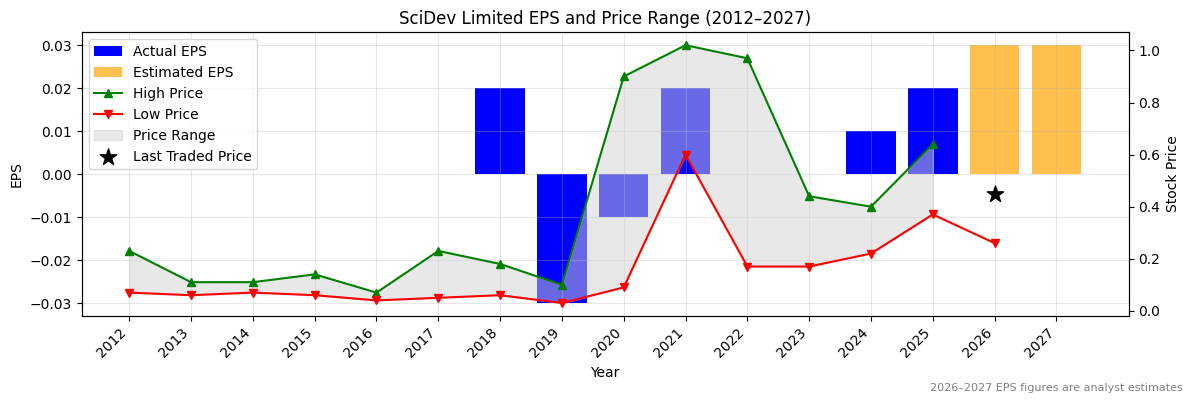
SDV Normalised Earnings Per Share (EPS) (2012–2027)
✅✅
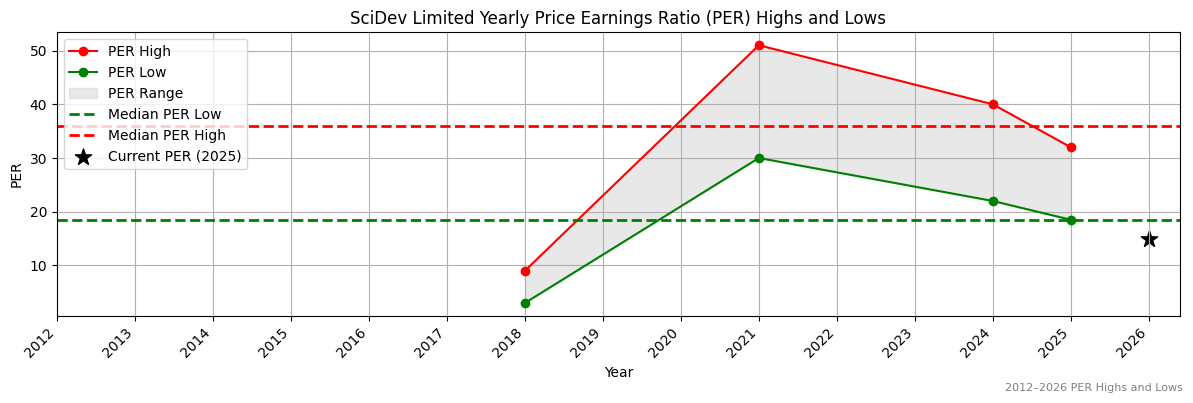
Valuation
| Price To Sales |
Price To Book |
PER 2023 |
PER 2024 |
13Y Median PER Low |
PER 2025e |
13Y Median PER High |
PER 2026e |
Last Updated |
| 0.6 |
1.3 |
None |
33.0 |
18.5 |
16.5 |
36.0 |
11.0 |
10/3/25 |
SDV Yearly Price Earnings Ratio (PER) Highs and Lows
✅✅
SDV Weekly Price Chart with Average True Range (ATR) Trailing Stop (10-Year View)
Ticker code: SDR
SDR Red Flags & Risk Indicators
⚠️
⚠️ RED FLAGS: 2 identified
- Increasing Shorts
- High Price to Book vs ROE
Income Statement
| Revenue 2024 Per Share |
Revenue 2025e Per Share |
Revenue 2026e Per Share |
Revenue 24 to 25e [%] |
Revenue 25e to 26e [%] |
EBITDA 2024 Per Share |
EBITDA 2025e Per Share |
EBITDA 2026e Per Share |
EBITDA 24 to 25e [%] |
EBITDA 25e to 26e [%] |
| 0.70555 |
0.81948 |
1.00964 |
16.1 |
23.2 |
0.00323 |
0.05094 |
0.11539 |
1479.3 |
126.5 |
SDR Revenue Per Share (2012–2027)
✅
SDR Earnings before Interest, Tax, Depreciation and Amortisation (EBITDA) Per Share (2012–2027)
✅✅
SDR Normalised Earnings Per Share (EPS) (2012–2027)
✅✅
Valuation
| Price To Sales |
Price To Book |
PER 2023 |
PER 2024 |
13Y Median PER Low |
PER 2025e |
13Y Median PER High |
PER 2026e |
Last Updated |
| 8.9 |
34.3 |
-41.8 |
-79.0 |
422.0 |
-142.2 |
796.0 |
711.0 |
31/10/25 |
SDR Yearly Price Earnings Ratio (PER) Highs and Lows
✅✅
SDR Weekly Price Chart with Average True Range (ATR) Trailing Stop (10-Year View)
Ticker code: SDF
SDF Red Flags & Risk Indicators
✅
⚠️ RED FLAGS: 0 identified
No red flags detected.
Income Statement
| Revenue 2024 Per Share |
Revenue 2025e Per Share |
Revenue 2026e Per Share |
Revenue 24 to 25e [%] |
Revenue 25e to 26e [%] |
EBITDA 2024 Per Share |
EBITDA 2025e Per Share |
EBITDA 2026e Per Share |
EBITDA 24 to 25e [%] |
EBITDA 25e to 26e [%] |
| 1.51514 |
1.65028 |
1.79682 |
8.9 |
8.9 |
0.50294 |
0.56214 |
0.59456 |
11.8 |
5.8 |
SDF Revenue Per Share (2012–2027)
✅
SDF Earnings before Interest, Tax, Depreciation and Amortisation (EBITDA) Per Share (2012–2027)
✅
SDF Normalised Earnings Per Share (EPS) (2012–2027)
✅
Valuation
| Price To Sales |
Price To Book |
PER 2023 |
PER 2024 |
13Y Median PER Low |
PER 2025e |
13Y Median PER High |
PER 2026e |
Last Updated |
| 3.0 |
2.6 |
28.0 |
20.0 |
17.6 |
18.1 |
24.4 |
16.5 |
28/9/25 |
SDF Yearly Price Earnings Ratio (PER) Highs and Lows
✅
SDF Weekly Price Chart with Average True Range (ATR) Trailing Stop (10-Year View)
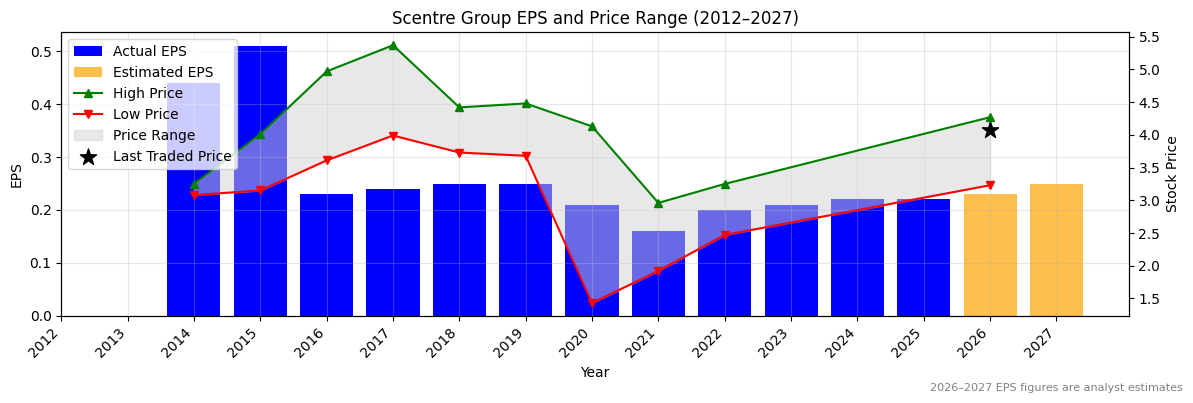
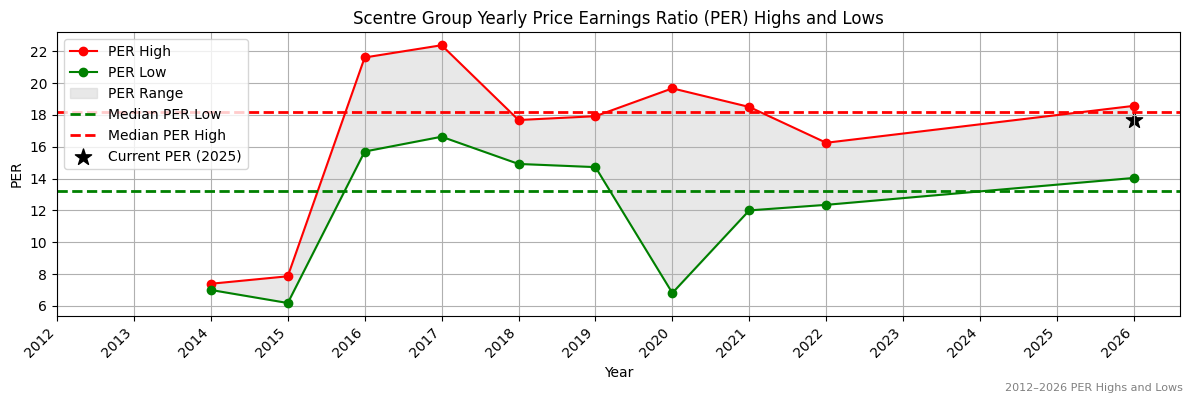
Ticker code: SCG
SCG Red Flags & Risk Indicators
❌
⚠️ RED FLAGS: 3 identified
- Low Operating Margin
- Increasing Shorts
- Falling Earnings
Income Statement
| Revenue 2024 Per Share |
Revenue 2025e Per Share |
Revenue 2026e Per Share |
Revenue 24 to 25e [%] |
Revenue 25e to 26e [%] |
EBITDA 2024 Per Share |
EBITDA 2025e Per Share |
EBITDA 2026e Per Share |
EBITDA 24 to 25e [%] |
EBITDA 25e to 26e [%] |
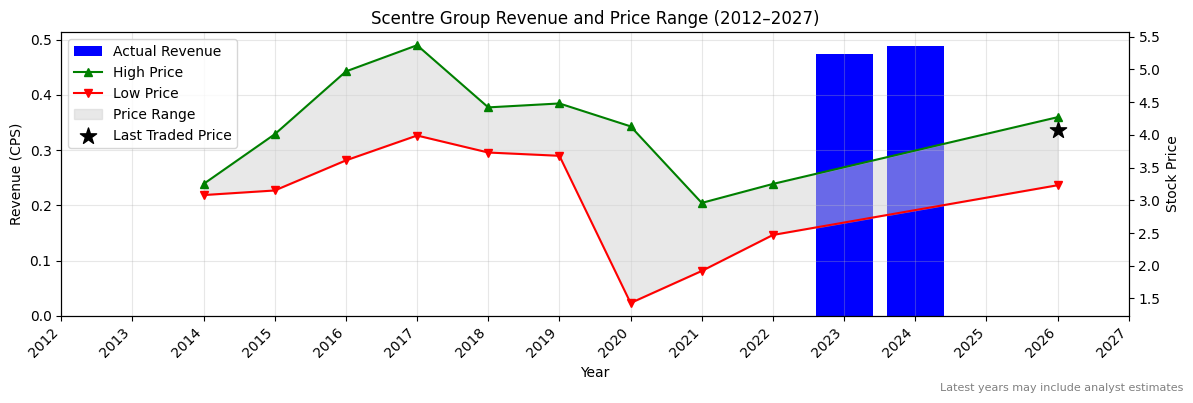
| 0.48868 |
None |
None |
None |
None |
None |
None |
None |
None |
None |
SCG Revenue Per Share (2012–2027)
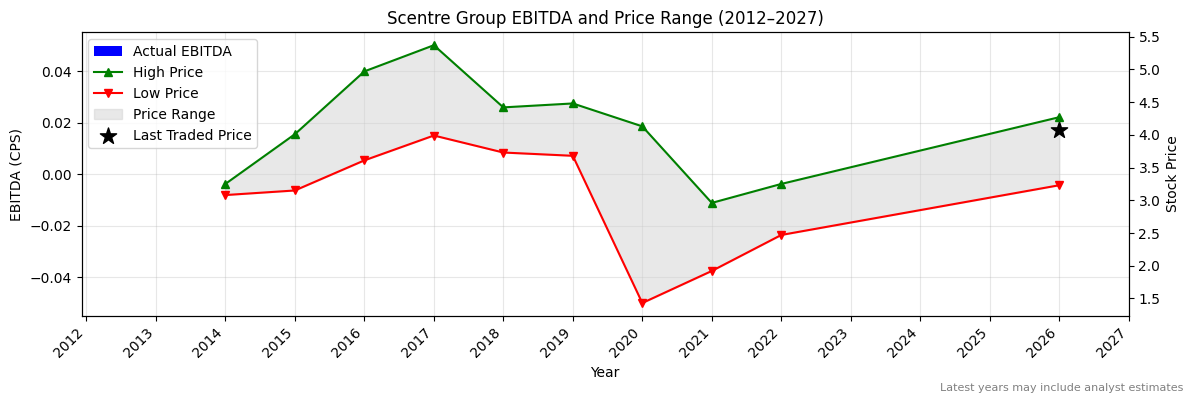
SCG Earnings before Interest, Tax, Depreciation and Amortisation (EBITDA) Per Share (2012–2027)
SCG Normalised Earnings Per Share (EPS) (2012–2027)
❌
Valuation
| Price To Sales |
Price To Book |
PER 2023 |
PER 2024 |
13Y Median PER Low |
PER 2025e |
13Y Median PER High |
PER 2026e |
Last Updated |
| 7.9 |
1.2 |
19.4 |
18.5 |
13.2 |
18.5 |
18.2 |
17.7 |
3/4/22 |
SCG Yearly Price Earnings Ratio (PER) Highs and Lows
❌
SCG Weekly Price Chart with Average True Range (ATR) Trailing Stop (10-Year View)
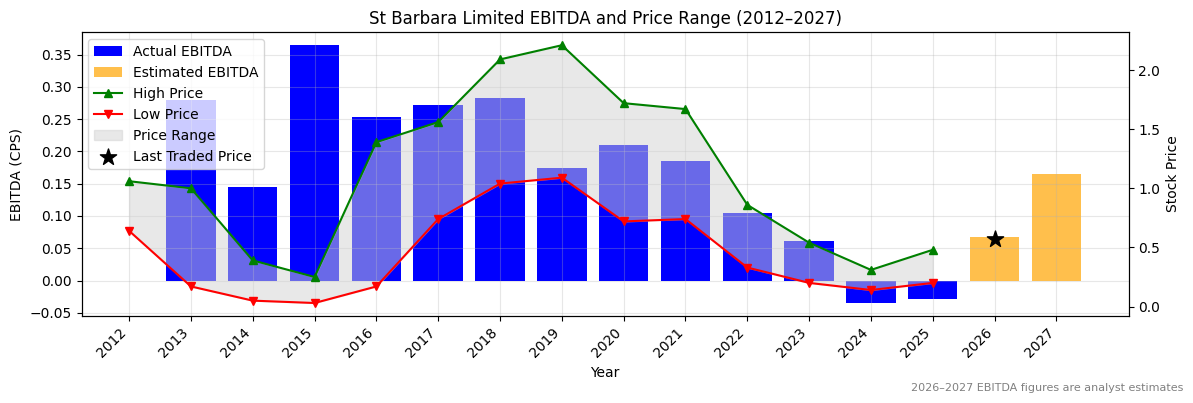
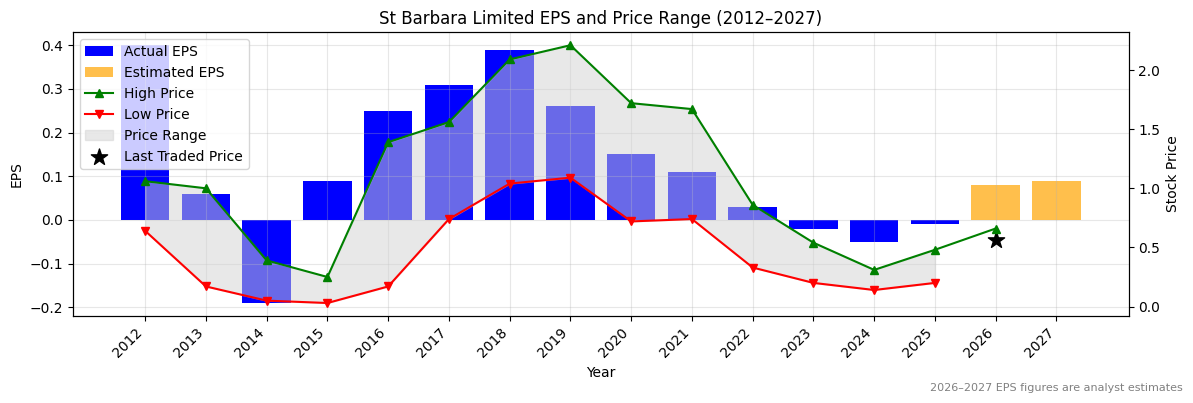
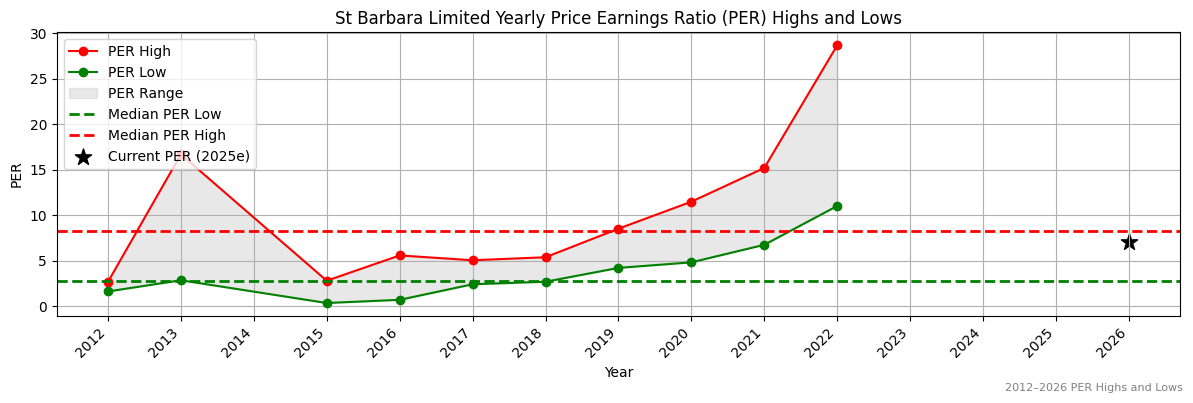
Ticker code: SBM
SBM Red Flags & Risk Indicators
❌
⚠️ RED FLAGS: 4 identified
- Negative Operating Cash Flow
- Low Operating Margin
- Falling Earnings
- Risk Of Capital Raise
Income Statement
| Revenue 2024 Per Share |
Revenue 2025e Per Share |
Revenue 2026e Per Share |
Revenue 24 to 25e [%] |
Revenue 25e to 26e [%] |
EBITDA 2024 Per Share |
EBITDA 2025e Per Share |
EBITDA 2026e Per Share |
EBITDA 24 to 25e [%] |
EBITDA 25e to 26e [%] |
| 0.27335 |
0.2316 |
0.25961 |
-15.3 |
12.1 |
-0.03482 |
-0.0293 |
0.06712 |
15.8 |
329.1 |
SBM Revenue Per Share (2012–2027)
❌
SBM Earnings before Interest, Tax, Depreciation and Amortisation (EBITDA) Per Share (2012–2027)
✅
SBM Normalised Earnings Per Share (EPS) (2012–2027)
✅✅
Valuation
| Price To Sales |
Price To Book |
PER 2023 |
PER 2024 |
13Y Median PER Low |
PER 2025e |
13Y Median PER High |
PER 2026e |
Last Updated |
| 2.9 |
1.5 |
-25.7 |
-10.3 |
2.8 |
-51.5 |
8.3 |
6.4 |
4/10/25 |
SBM Yearly Price Earnings Ratio (PER) Highs and Lows
✅✅
SBM Weekly Price Chart with Average True Range (ATR) Trailing Stop (10-Year View)
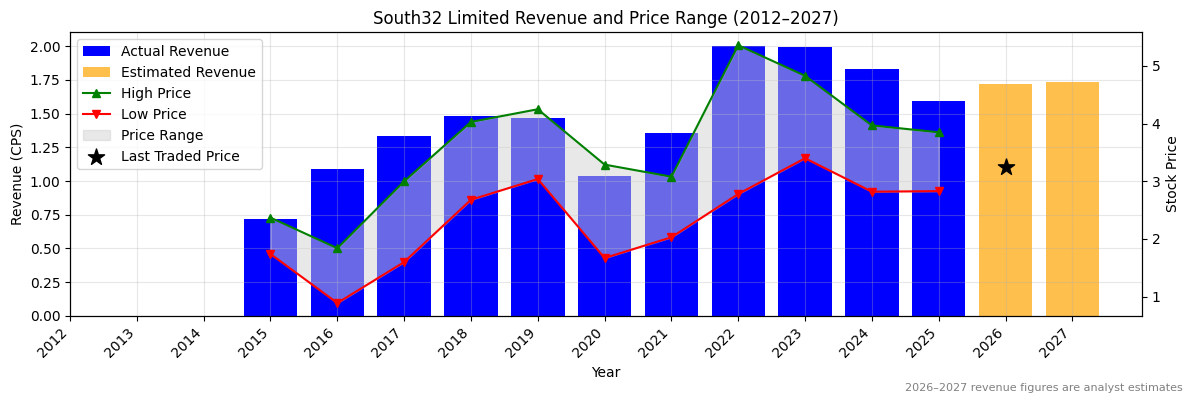
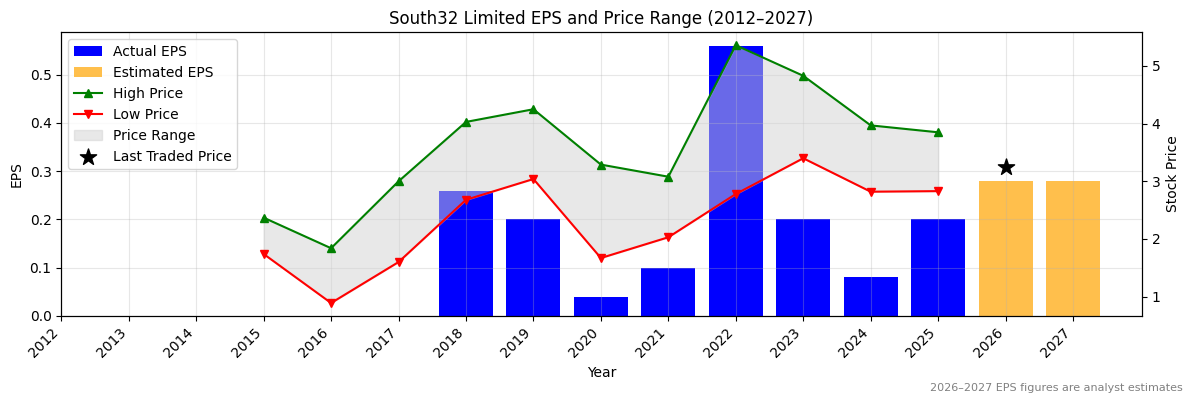
Ticker code: S32
S32 Red Flags & Risk Indicators
❌
⚠️ RED FLAGS: 3 identified
- Low Operating Margin
- Increasing Shorts
- Falling Earnings
Income Statement
| Revenue 2024 Per Share |
Revenue 2025e Per Share |
Revenue 2026e Per Share |
Revenue 24 to 25e [%] |
Revenue 25e to 26e [%] |
EBITDA 2024 Per Share |
EBITDA 2025e Per Share |
EBITDA 2026e Per Share |
EBITDA 24 to 25e [%] |
EBITDA 25e to 26e [%] |
| 1.83163 |
1.59582 |
1.71708 |
-12.9 |
7.6 |
0.39785 |
0.47781 |
0.54846 |
20.1 |
14.8 |
S32 Revenue Per Share (2012–2027)
❌
S32 Earnings before Interest, Tax, Depreciation and Amortisation (EBITDA) Per Share (2012–2027)
✅✅
S32 Normalised Earnings Per Share (EPS) (2012–2027)
✅✅
Valuation
| Price To Sales |
Price To Book |
PER 2023 |
PER 2024 |
13Y Median PER Low |
PER 2025e |
13Y Median PER High |
PER 2026e |
Last Updated |
| 2.4 |
1.6 |
15.9 |
39.6 |
16.1 |
15.9 |
22.7 |
11.3 |
11/3/25 |
S32 Yearly Price Earnings Ratio (PER) Highs and Lows
✅✅
S32 Weekly Price Chart with Average True Range (ATR) Trailing Stop (10-Year View)
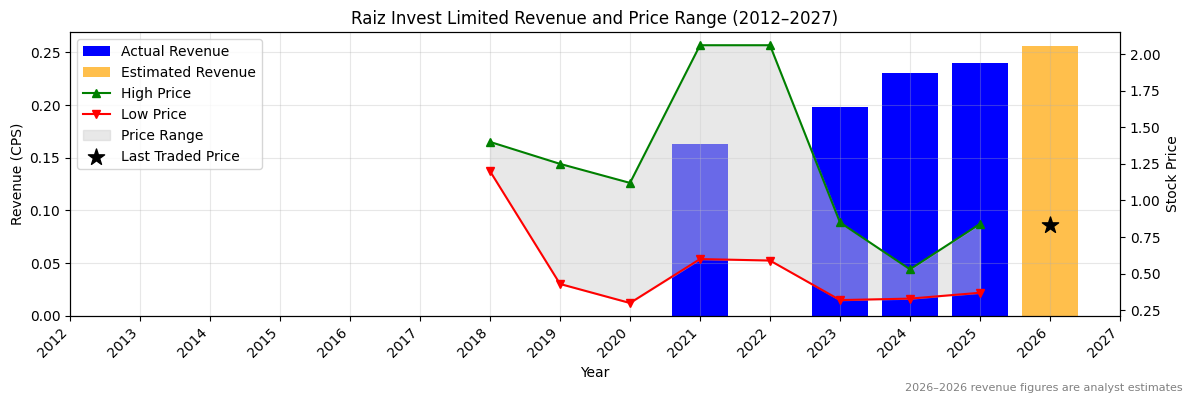
Ticker code: RZI
RZI Red Flags & Risk Indicators
⚠️
⚠️ RED FLAGS: 1 identified
Income Statement
| Revenue 2024 Per Share |
Revenue 2025e Per Share |
Revenue 2026e Per Share |
Revenue 24 to 25e [%] |
Revenue 25e to 26e [%] |
EBITDA 2024 Per Share |
EBITDA 2025e Per Share |
EBITDA 2026e Per Share |
EBITDA 24 to 25e [%] |
EBITDA 25e to 26e [%] |
| 0.23044 |
0.23988 |
0.25619 |
4.1 |
6.8 |
0.01257 |
0.03988 |
0.04744 |
217.3 |
19.0 |
RZI Revenue Per Share (2012–2027)
✅
RZI Earnings before Interest, Tax, Depreciation and Amortisation (EBITDA) Per Share (2012–2027)
✅✅
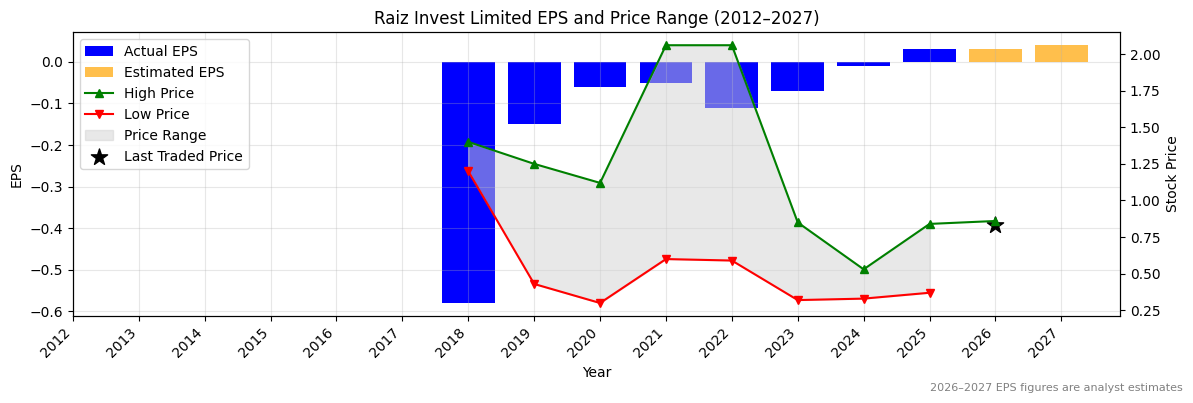
RZI Normalised Earnings Per Share (EPS) (2012–2027)
✅✅
Valuation
| Price To Sales |
Price To Book |
PER 2023 |
PER 2024 |
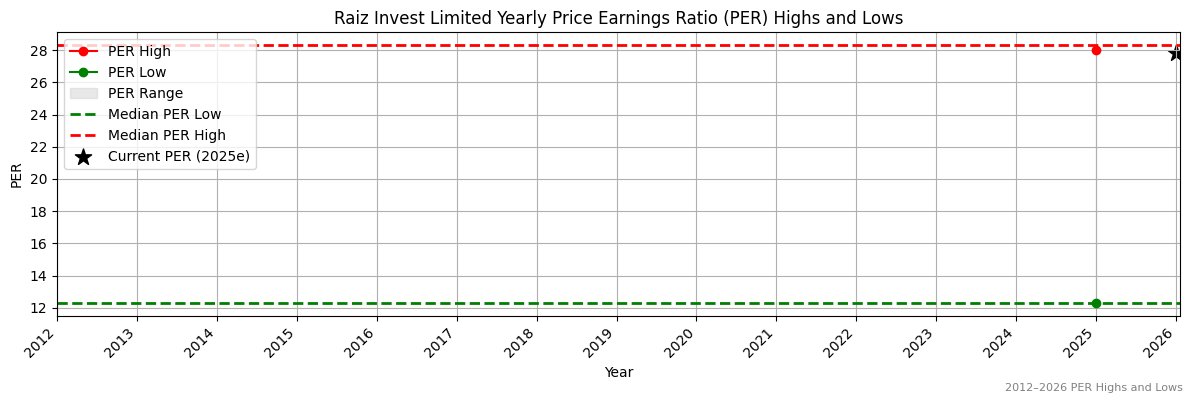
13Y Median PER Low |
PER 2025e |
13Y Median PER High |
PER 2026e |
Last Updated |
| 3.9 |
2.4 |
-12.9 |
-90.0 |
12.3 |
30.0 |
29.3 |
30.0 |
4/10/25 |
RZI Yearly Price Earnings Ratio (PER) Highs and Lows
❌
RZI Weekly Price Chart with Average True Range (ATR) Trailing Stop (10-Year View)
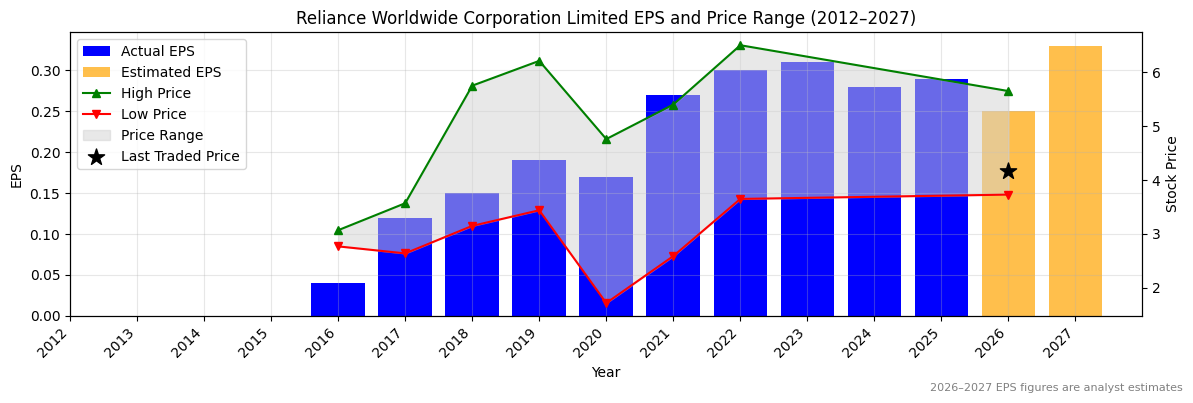
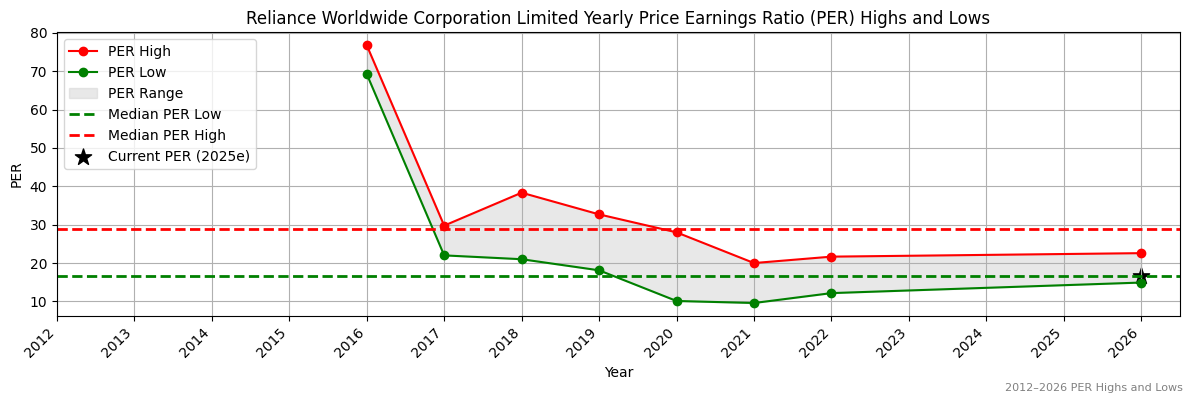
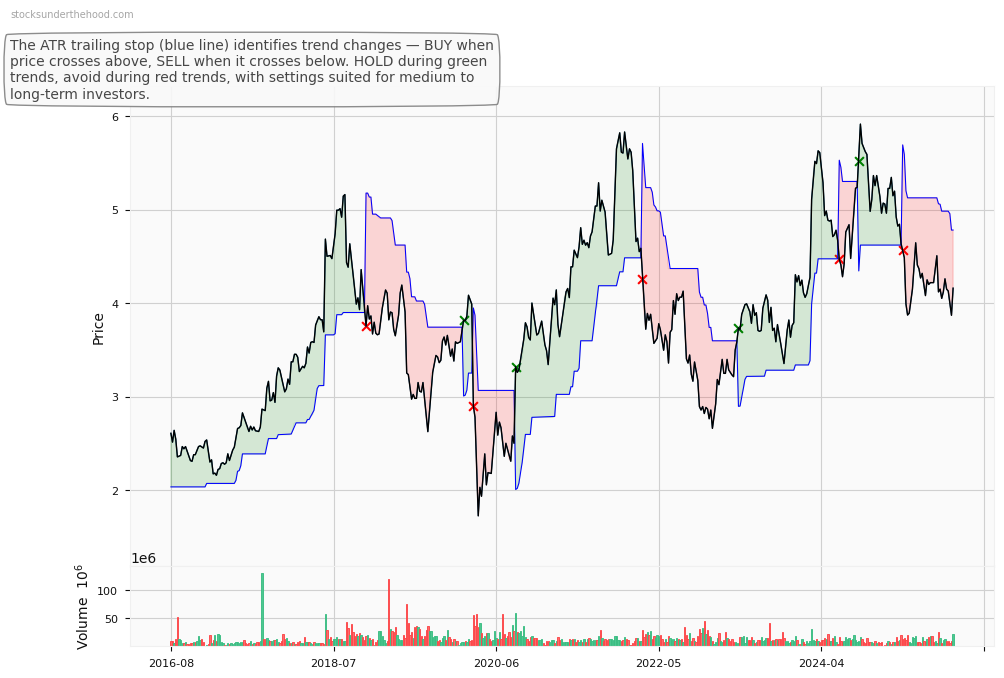
Ticker code: RWC
RWC Red Flags & Risk Indicators
⚠️
⚠️ RED FLAGS: 1 identified
Income Statement
| Revenue 2024 Per Share |
Revenue 2025e Per Share |
Revenue 2026e Per Share |
Revenue 24 to 25e [%] |
Revenue 25e to 26e [%] |
EBITDA 2024 Per Share |
EBITDA 2025e Per Share |
EBITDA 2026e Per Share |
EBITDA 24 to 25e [%] |
EBITDA 25e to 26e [%] |
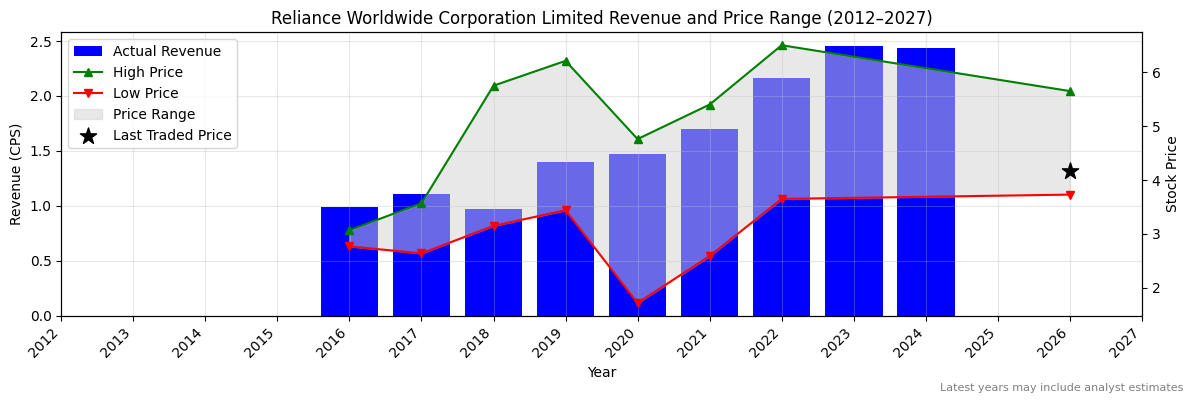
| 2.43355 |
None |
None |
None |
None |
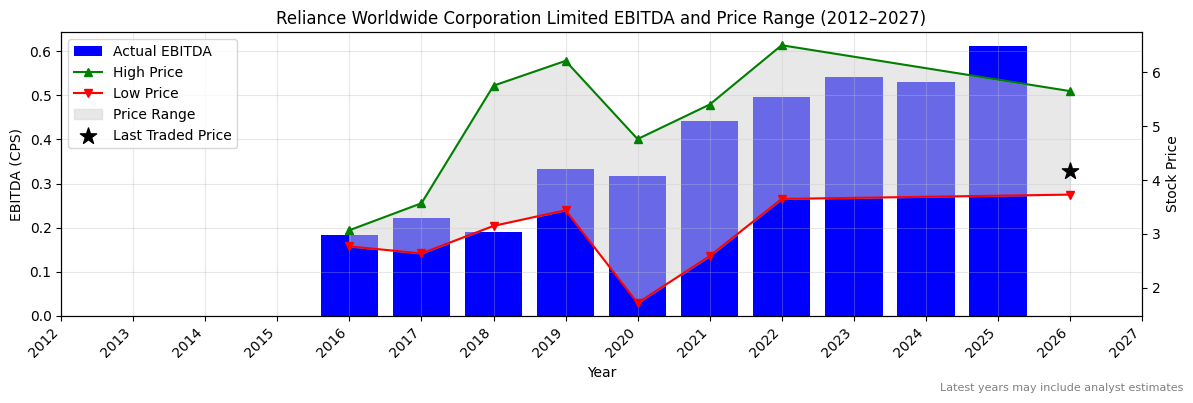
0.52983 |
0.61226 |
None |
15.6 |
None |
RWC Revenue Per Share (2012–2027)
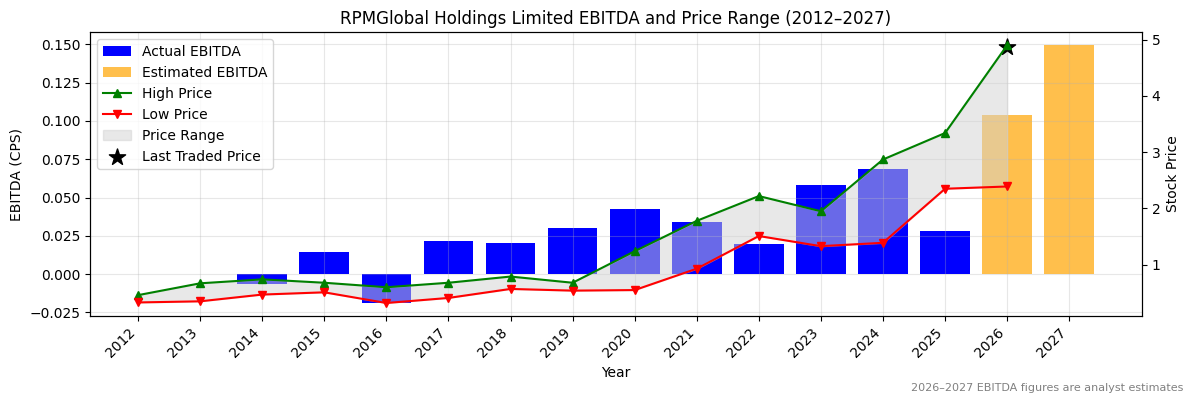
RWC Earnings before Interest, Tax, Depreciation and Amortisation (EBITDA) Per Share (2012–2027)
✅
RWC Normalised Earnings Per Share (EPS) (2012–2027)
✅
Valuation
| Price To Sales |
Price To Book |
PER 2023 |
PER 2024 |
13Y Median PER Low |
PER 2025e |
13Y Median PER High |
PER 2026e |
Last Updated |
| 2.4 |
2.3 |
13.4 |
14.8 |
16.5 |
14.3 |
28.9 |
16.6 |
21/2/24 |
RWC Yearly Price Earnings Ratio (PER) Highs and Lows
✅✅
RWC Weekly Price Chart with Average True Range (ATR) Trailing Stop (10-Year View)
Ticker code: RUL
RUL Red Flags & Risk Indicators
❌
⚠️ RED FLAGS: 5 identified
- Negative Operating Cash Flow
- Falling Earnings
- Falling Revenues
- High Relative Valuation
- Falling EBITDA Margins
Income Statement
| Revenue 2024 Per Share |
Revenue 2025e Per Share |
Revenue 2026e Per Share |
Revenue 24 to 25e [%] |
Revenue 25e to 26e [%] |
EBITDA 2024 Per Share |
EBITDA 2025e Per Share |
EBITDA 2026e Per Share |
EBITDA 24 to 25e [%] |
EBITDA 25e to 26e [%] |
| 0.50748 |
0.53739 |
0.40495 |
5.9 |
-24.6 |
0.06852 |
0.02809 |
0.10383 |
-59.0 |
269.7 |
RUL Revenue Per Share (2012–2027)
✅
RUL Earnings before Interest, Tax, Depreciation and Amortisation (EBITDA) Per Share (2012–2027)
❌
RUL Normalised Earnings Per Share (EPS) (2012–2027)
✅✅
Valuation
| Price To Sales |
Price To Book |
PER 2023 |
PER 2024 |
13Y Median PER Low |
PER 2025e |
13Y Median PER High |
PER 2026e |
Last Updated |
| 14.6 |
11.7 |
243.5 |
121.7 |
47.4 |
97.4 |
84.6 |
97.4 |
4/10/25 |
RUL Yearly Price Earnings Ratio (PER) Highs and Lows
❌
RUL Weekly Price Chart with Average True Range (ATR) Trailing Stop (10-Year View)
Ticker code: RTR
RTR Red Flags & Risk Indicators
❌
⚠️ RED FLAGS: 5 identified
- Negative Operating Cash Flow
- Large Share Issuance
- Zero Revenue
- Falling Earnings
- Risk Of Capital Raise
Income Statement
| Revenue 2024 Per Share |
Revenue 2025e Per Share |
Revenue 2026e Per Share |
Revenue 24 to 25e [%] |
Revenue 25e to 26e [%] |
EBITDA 2024 Per Share |
EBITDA 2025e Per Share |
EBITDA 2026e Per Share |
EBITDA 24 to 25e [%] |
EBITDA 25e to 26e [%] |
| None |
None |
None |
None |
None |
-0.00384 |
-0.00545 |
None |
-41.8 |
None |
RTR Revenue Per Share (2012–2027)
RTR Earnings before Interest, Tax, Depreciation and Amortisation (EBITDA) Per Share (2012–2027)
❌
RTR Normalised Earnings Per Share (EPS) (2012–2027)
Valuation
| Price To Sales |
Price To Book |
PER 2023 |
PER 2024 |
13Y Median PER Low |
PER 2025e |
13Y Median PER High |
PER 2026e |
Last Updated |
| 261.8 |
0.7 |
-3.9 |
None |
1.1 |
-3.9 |
2.7 |
2.0 |
9/4/24 |
RTR Yearly Price Earnings Ratio (PER) Highs and Lows
✅✅
RTR Weekly Price Chart with Average True Range (ATR) Trailing Stop (10-Year View)
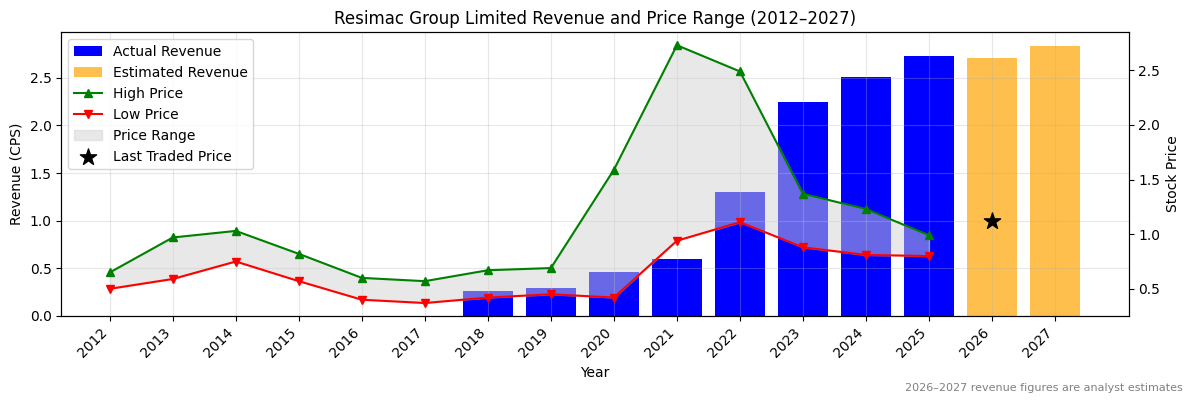
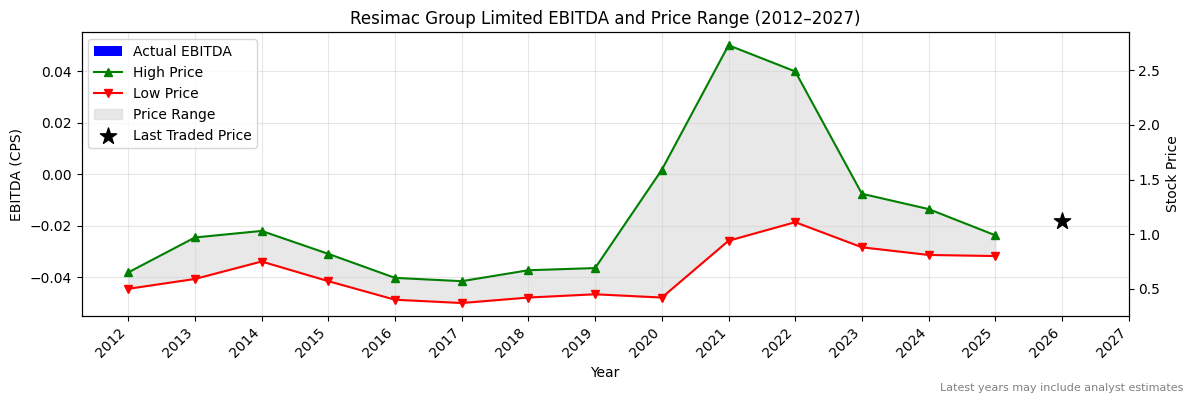
Ticker code: RSG
RSG Red Flags & Risk Indicators
⚠️
⚠️ RED FLAGS: 1 identified
Income Statement
| Revenue 2024 Per Share |
Revenue 2025e Per Share |
Revenue 2026e Per Share |
Revenue 24 to 25e [%] |
Revenue 25e to 26e [%] |
EBITDA 2024 Per Share |
EBITDA 2025e Per Share |
EBITDA 2026e Per Share |
EBITDA 24 to 25e [%] |
EBITDA 25e to 26e [%] |
| 0.60174 |
0.62944 |
0.6286 |
4.6 |
-0.1 |
0.24069 |
0.29669 |
0.29599 |
23.3 |
-0.2 |
RSG Revenue Per Share (2012–2027)
✅
RSG Earnings before Interest, Tax, Depreciation and Amortisation (EBITDA) Per Share (2012–2027)
✅✅
RSG Normalised Earnings Per Share (EPS) (2012–2027)
✅✅
Valuation
| Price To Sales |
Price To Book |
PER 2023 |
PER 2024 |
13Y Median PER Low |
PER 2025e |
13Y Median PER High |
PER 2026e |
Last Updated |
| 2.2 |
3.2 |
8.7 |
-47.7 |
5.9 |
9.5 |
13.3 |
10.6 |
23/7/25 |
RSG Yearly Price Earnings Ratio (PER) Highs and Lows
✅
RSG Weekly Price Chart with Average True Range (ATR) Trailing Stop (10-Year View)
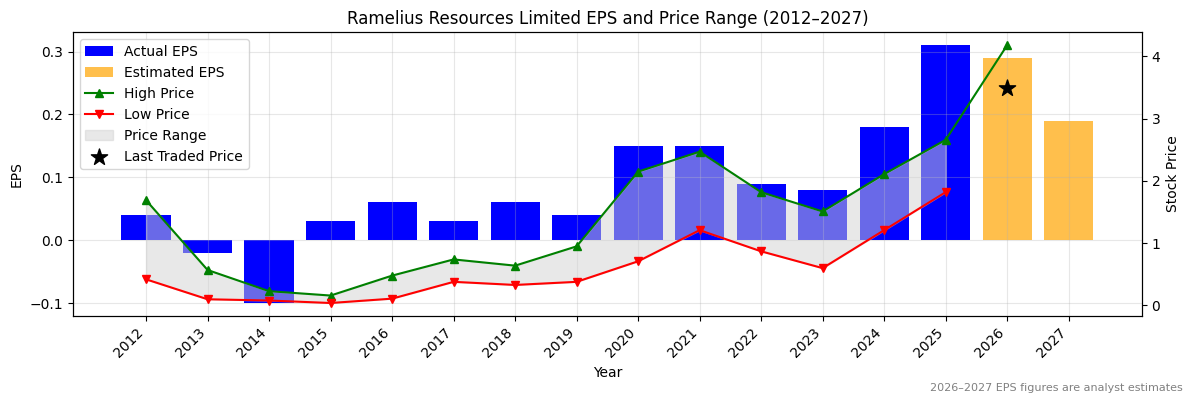
Ticker code: RRL
RRL Red Flags & Risk Indicators
✅
⚠️ RED FLAGS: 0 identified
No red flags detected.
Income Statement
| Revenue 2024 Per Share |
Revenue 2025e Per Share |
Revenue 2026e Per Share |
Revenue 24 to 25e [%] |
Revenue 25e to 26e [%] |
EBITDA 2024 Per Share |
EBITDA 2025e Per Share |
EBITDA 2026e Per Share |
EBITDA 24 to 25e [%] |
EBITDA 25e to 26e [%] |
| 1.67193 |
2.18113 |
2.63577 |
30.5 |
20.8 |
0.55739 |
1.03261 |
1.42977 |
85.3 |
38.5 |
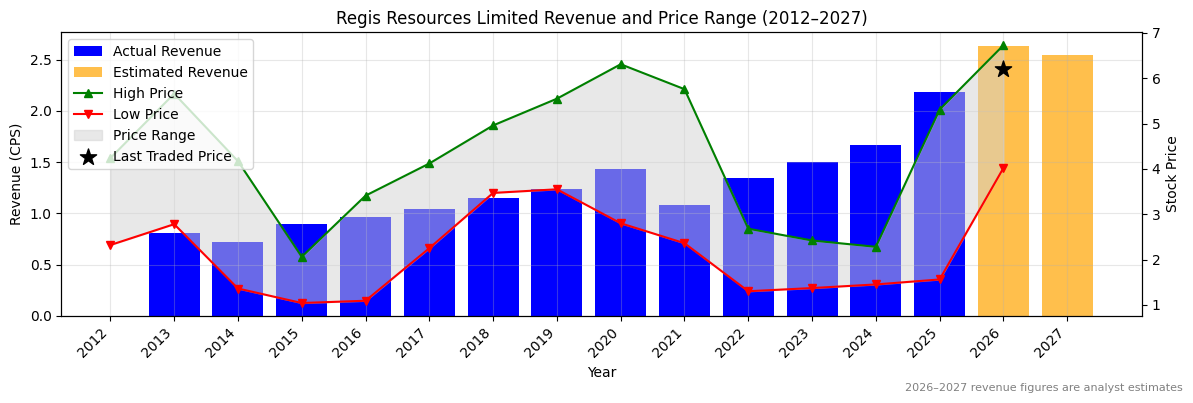
RRL Revenue Per Share (2012–2027)
✅✅
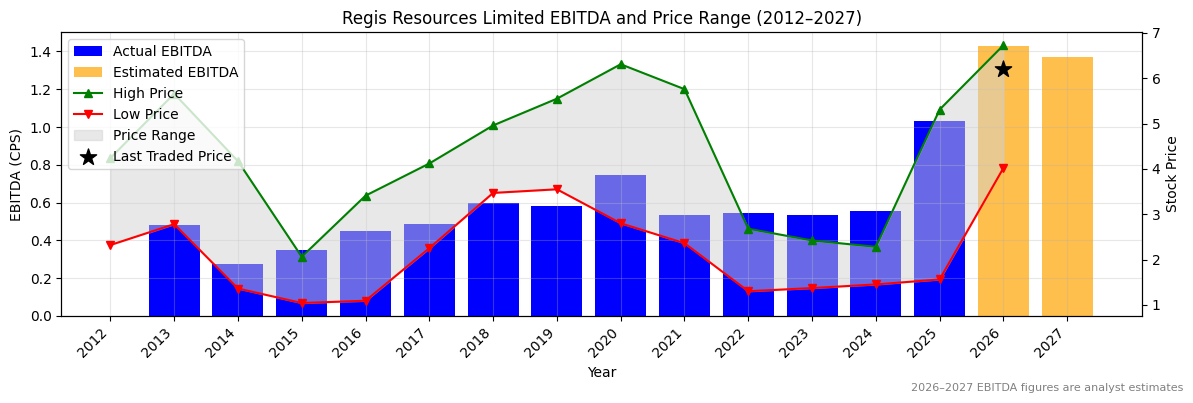
RRL Earnings before Interest, Tax, Depreciation and Amortisation (EBITDA) Per Share (2012–2027)
✅✅
RRL Normalised Earnings Per Share (EPS) (2012–2027)
✅✅
Valuation
| Price To Sales |
Price To Book |
PER 2023 |
PER 2024 |
13Y Median PER Low |
PER 2025e |
13Y Median PER High |
PER 2026e |
Last Updated |
| 3.0 |
3.0 |
-214.7 |
64.4 |
9.2 |
18.9 |
16.8 |
11.7 |
4/10/25 |
RRL Yearly Price Earnings Ratio (PER) Highs and Lows
❌
RRL Weekly Price Chart with Average True Range (ATR) Trailing Stop (10-Year View)
Ticker code: RMS
RMS Red Flags & Risk Indicators
✅
⚠️ RED FLAGS: 0 identified
No red flags detected.
Income Statement
| Revenue 2024 Per Share |
Revenue 2025e Per Share |
Revenue 2026e Per Share |
Revenue 24 to 25e [%] |
Revenue 25e to 26e [%] |
EBITDA 2024 Per Share |
EBITDA 2025e Per Share |
EBITDA 2026e Per Share |
EBITDA 24 to 25e [%] |
EBITDA 25e to 26e [%] |
| 0.77215 |
1.03093 |
0.49469 |
33.5 |
-52.0 |
0.40437 |
0.70933 |
0.36198 |
75.4 |
-49.0 |
RMS Revenue Per Share (2012–2027)
✅✅
RMS Earnings before Interest, Tax, Depreciation and Amortisation (EBITDA) Per Share (2012–2027)
✅✅
RMS Normalised Earnings Per Share (EPS) (2012–2027)
✅✅
Valuation
| Price To Sales |
Price To Book |
PER 2023 |
PER 2024 |
13Y Median PER Low |
PER 2025e |
13Y Median PER High |
PER 2026e |
Last Updated |
| 5.3 |
2.0 |
41.5 |
18.4 |
7.1 |
10.7 |
14.4 |
11.4 |
4/10/25 |
RMS Yearly Price Earnings Ratio (PER) Highs and Lows
✅
RMS Weekly Price Chart with Average True Range (ATR) Trailing Stop (10-Year View)
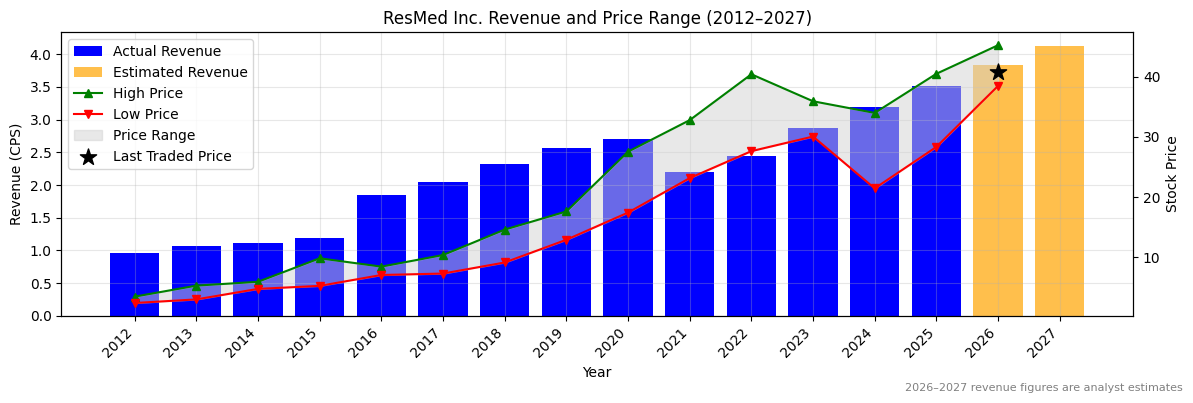
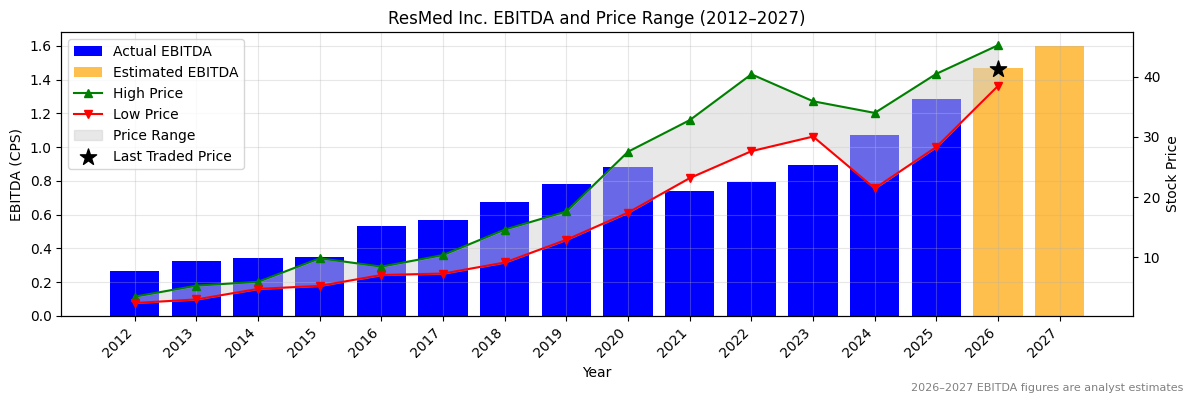
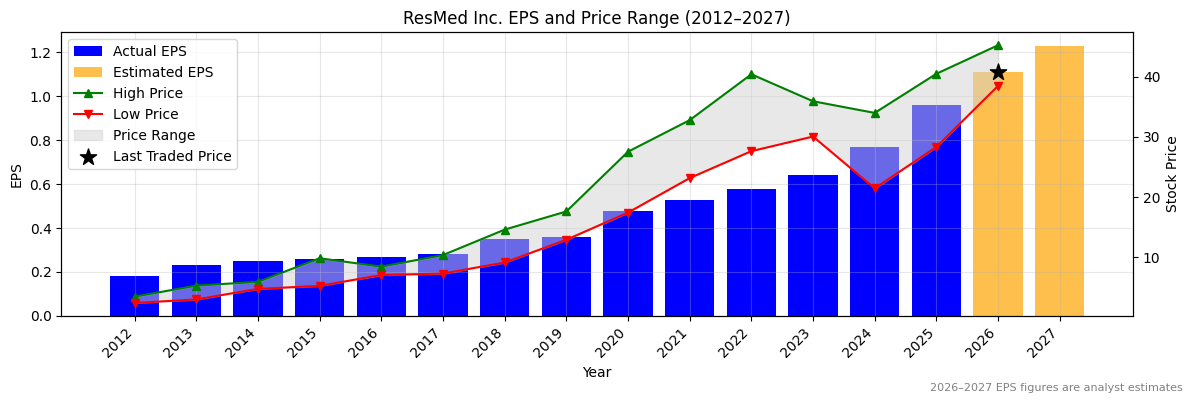
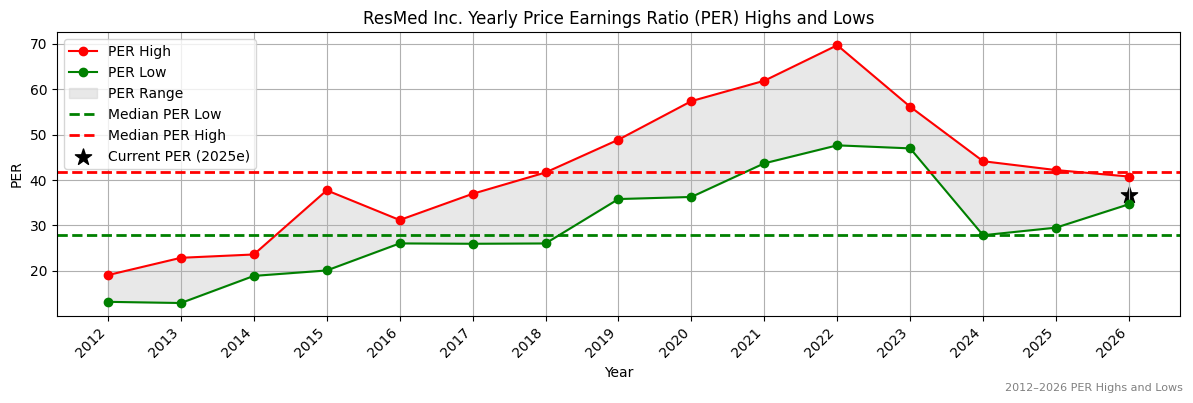
Ticker code: RMD
RMD Red Flags & Risk Indicators
⚠️
⚠️ RED FLAGS: 1 identified
Income Statement
| Revenue 2024 Per Share |
Revenue 2025e Per Share |
Revenue 2026e Per Share |
Revenue 24 to 25e [%] |
Revenue 25e to 26e [%] |
EBITDA 2024 Per Share |
EBITDA 2025e Per Share |
EBITDA 2026e Per Share |
EBITDA 24 to 25e [%] |
EBITDA 25e to 26e [%] |
| 3.18945 |
3.50938 |
3.83968 |
10.0 |
9.4 |
1.07266 |
1.28722 |
1.47096 |
20.0 |
14.3 |
RMD Revenue Per Share (2012–2027)
✅
RMD Earnings before Interest, Tax, Depreciation and Amortisation (EBITDA) Per Share (2012–2027)
✅
RMD Normalised Earnings Per Share (EPS) (2012–2027)
✅✅
Valuation
| Price To Sales |
Price To Book |
PER 2023 |
PER 2024 |
13Y Median PER Low |
PER 2025e |
13Y Median PER High |
PER 2026e |
Last Updated |
| 11.0 |
1.0 |
60.8 |
50.5 |
27.8 |
40.5 |
41.7 |
35.0 |
17/9/25 |
RMD Yearly Price Earnings Ratio (PER) Highs and Lows
✅
RMD Weekly Price Chart with Average True Range (ATR) Trailing Stop (10-Year View)
Ticker code: RMC
RMC Red Flags & Risk Indicators
⚠️
⚠️ RED FLAGS: 2 identified
- Falling Earnings
- More Net Debt Than Equity
Income Statement
| Revenue 2024 Per Share |
Revenue 2025e Per Share |
Revenue 2026e Per Share |
Revenue 24 to 25e [%] |
Revenue 25e to 26e [%] |
EBITDA 2024 Per Share |
EBITDA 2025e Per Share |
EBITDA 2026e Per Share |
EBITDA 24 to 25e [%] |
EBITDA 25e to 26e [%] |
| 2.50417 |
2.72397 |
2.70959 |
8.8 |
-0.5 |
None |
None |
None |
None |
None |
RMC Revenue Per Share (2012–2027)
✅
RMC Earnings before Interest, Tax, Depreciation and Amortisation (EBITDA) Per Share (2012–2027)
RMC Normalised Earnings Per Share (EPS) (2012–2027)
✅✅
Valuation
| Price To Sales |
Price To Book |
PER 2023 |
PER 2024 |
13Y Median PER Low |
PER 2025e |
13Y Median PER High |
PER 2026e |
Last Updated |
| 2.7 |
1.2 |
7.1 |
12.6 |
7.3 |
10.3 |
11.3 |
8.1 |
5/5/24 |
RMC Yearly Price Earnings Ratio (PER) Highs and Lows
✅
RMC Weekly Price Chart with Average True Range (ATR) Trailing Stop (10-Year View)
Ticker code: RKT
RKT Red Flags & Risk Indicators
✅
⚠️ RED FLAGS: 0 identified
No red flags detected.
Income Statement
| Revenue 2024 Per Share |
Revenue 2025e Per Share |
Revenue 2026e Per Share |
Revenue 24 to 25e [%] |
Revenue 25e to 26e [%] |
EBITDA 2024 Per Share |
EBITDA 2025e Per Share |
EBITDA 2026e Per Share |
EBITDA 24 to 25e [%] |
EBITDA 25e to 26e [%] |
| None |
None |
None |
None |
None |
None |
None |
None |
None |
None |
RKT Revenue Per Share (2012–2027)
RKT Earnings before Interest, Tax, Depreciation and Amortisation (EBITDA) Per Share (2012–2027)
RKT Normalised Earnings Per Share (EPS) (2012–2027)
Valuation
| Price To Sales |
Price To Book |
PER 2023 |
PER 2024 |
13Y Median PER Low |
PER 2025e |
13Y Median PER High |
PER 2026e |
Last Updated |
| 2.5 |
3.2 |
None |
None |
None |
None |
None |
None |
None |
RKT Yearly Price Earnings Ratio (PER) Highs and Lows
RKT Weekly Price Chart with Average True Range (ATR) Trailing Stop (10-Year View)
Ticker code: RKN
RKN Red Flags & Risk Indicators
⚠️
⚠️ RED FLAGS: 2 identified
- Low Operating Margin
- Falling Earnings
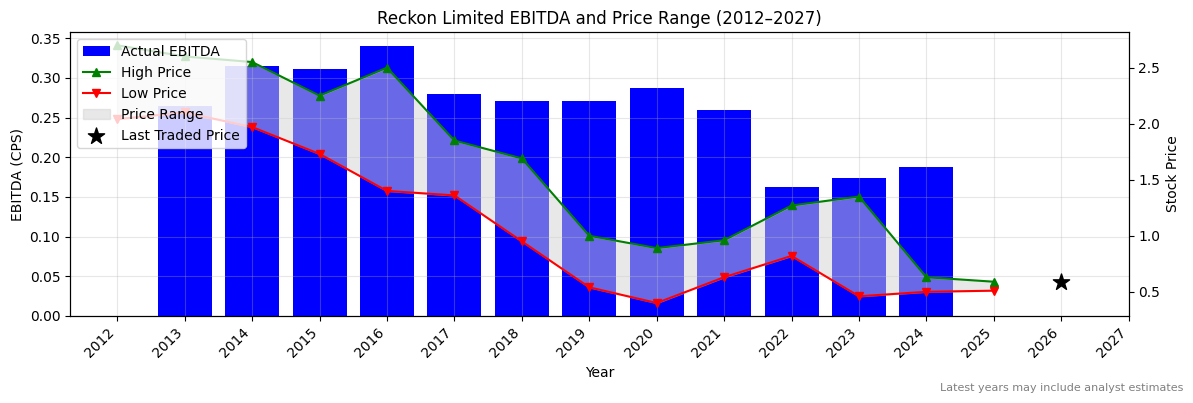
Income Statement
| Revenue 2024 Per Share |
Revenue 2025e Per Share |
Revenue 2026e Per Share |
Revenue 24 to 25e [%] |
Revenue 25e to 26e [%] |
EBITDA 2024 Per Share |
EBITDA 2025e Per Share |
EBITDA 2026e Per Share |
EBITDA 24 to 25e [%] |
EBITDA 25e to 26e [%] |
| 0.48083 |
0.53872 |
0.56666 |
12.0 |
5.2 |
0.18808 |
None |
None |
None |
None |
RKN Revenue Per Share (2012–2027)
✅
RKN Earnings before Interest, Tax, Depreciation and Amortisation (EBITDA) Per Share (2012–2027)
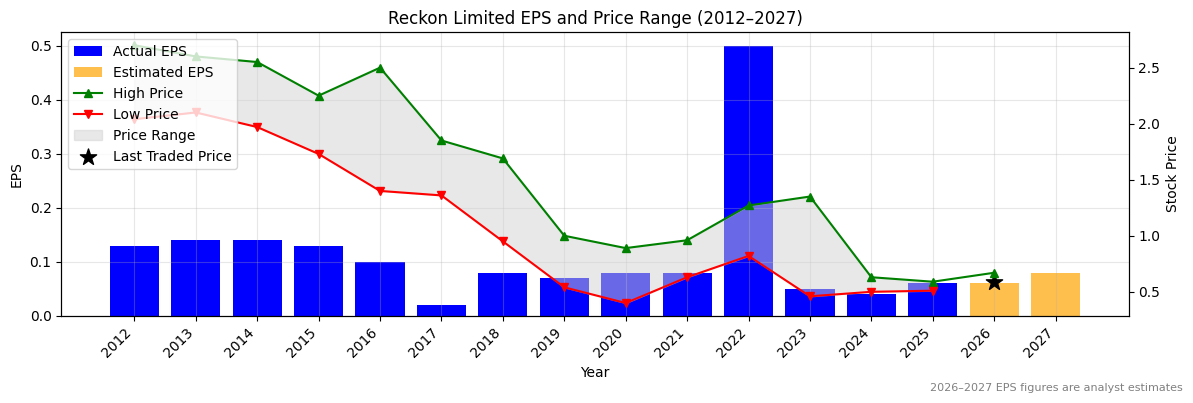
RKN Normalised Earnings Per Share (EPS) (2012–2027)
✅✅
Valuation
| Price To Sales |
Price To Book |
PER 2023 |
PER 2024 |
13Y Median PER Low |
PER 2025e |
13Y Median PER High |
PER 2026e |
Last Updated |
| 1.1 |
2.6 |
11.8 |
14.7 |
12.2 |
9.8 |
17.3 |
9.8 |
14/11/23 |
RKN Yearly Price Earnings Ratio (PER) Highs and Lows
✅✅
RKN Weekly Price Chart with Average True Range (ATR) Trailing Stop (10-Year View)
Ticker code: RIO
RIO Red Flags & Risk Indicators
❌
⚠️ RED FLAGS: 5 identified
- Highly Shorted
- Increasing Shorts
- Falling Revenues
- More Net Debt Than Equity
- High Relative Valuation
Income Statement
| Revenue 2024 Per Share |
Revenue 2025e Per Share |
Revenue 2026e Per Share |
Revenue 24 to 25e [%] |
Revenue 25e to 26e [%] |
EBITDA 2024 Per Share |
EBITDA 2025e Per Share |
EBITDA 2026e Per Share |
EBITDA 24 to 25e [%] |
EBITDA 25e to 26e [%] |
| 33.03861 |
32.06677 |
143.16454 |
-2.9 |
346.5 |
14.35503 |
13.86707 |
63.66177 |
-3.4 |
359.1 |
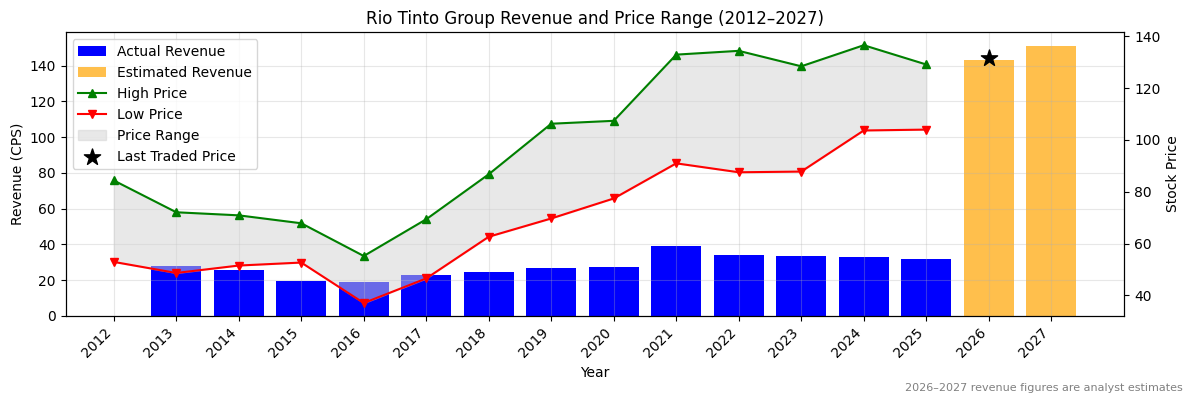
RIO Revenue Per Share (2012–2027)
❌
RIO Earnings before Interest, Tax, Depreciation and Amortisation (EBITDA) Per Share (2012–2027)
❌
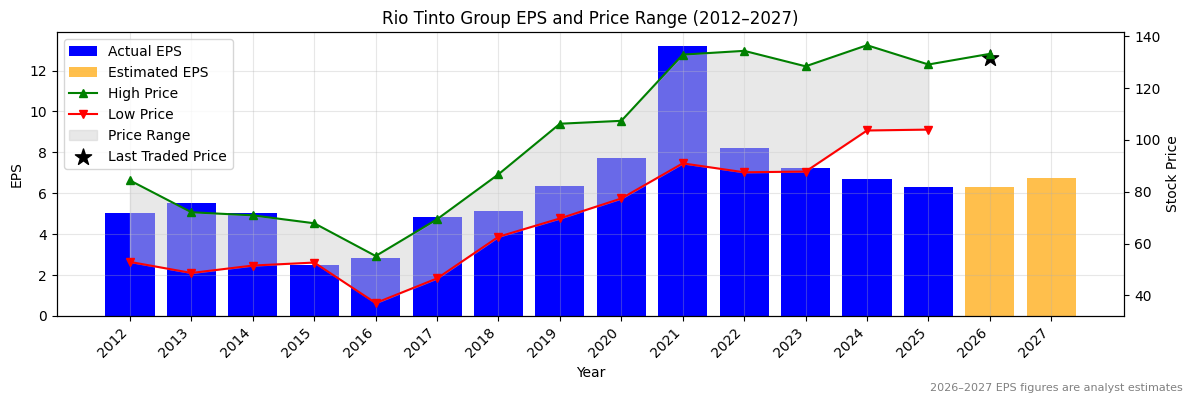
RIO Normalised Earnings Per Share (EPS) (2012–2027)
❌
Valuation
| Price To Sales |
Price To Book |
PER 2023 |
PER 2024 |
13Y Median PER Low |
PER 2025e |
13Y Median PER High |
PER 2026e |
Last Updated |
| 4.0 |
3.7 |
18.3 |
19.8 |
10.8 |
21.1 |
16.8 |
21.1 |
19/5/25 |
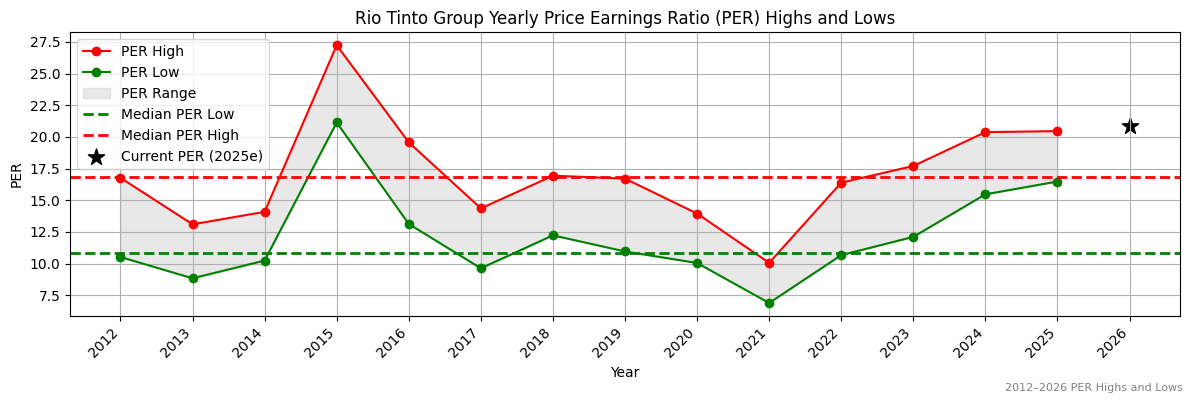
RIO Yearly Price Earnings Ratio (PER) Highs and Lows
❌
RIO Weekly Price Chart with Average True Range (ATR) Trailing Stop (10-Year View)