Ticker code: RIC
RIC Red Flags & Risk Indicators
⚠️
⚠️ RED FLAGS: 1 identified
Income Statement
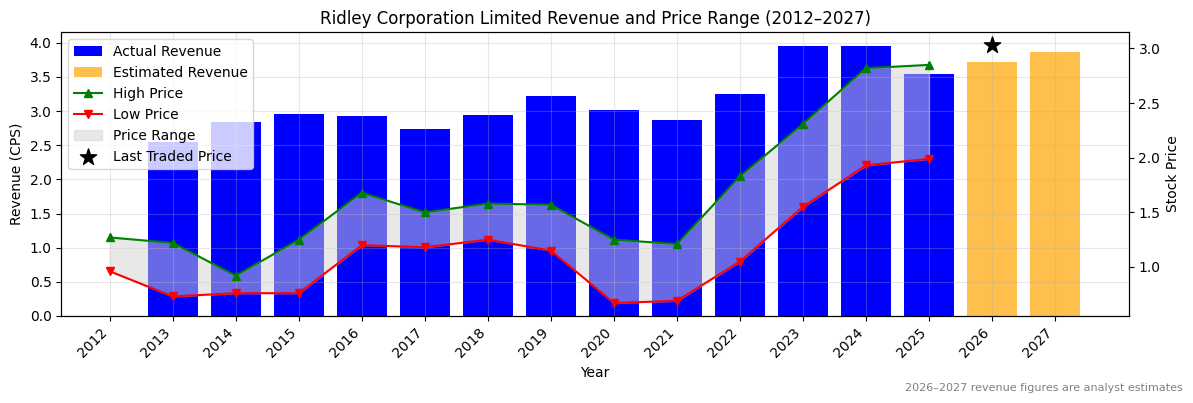
| Revenue 2024 Per Share |
Revenue 2025e Per Share |
Revenue 2026e Per Share |
Revenue 24 to 25e [%] |
Revenue 25e to 26e [%] |
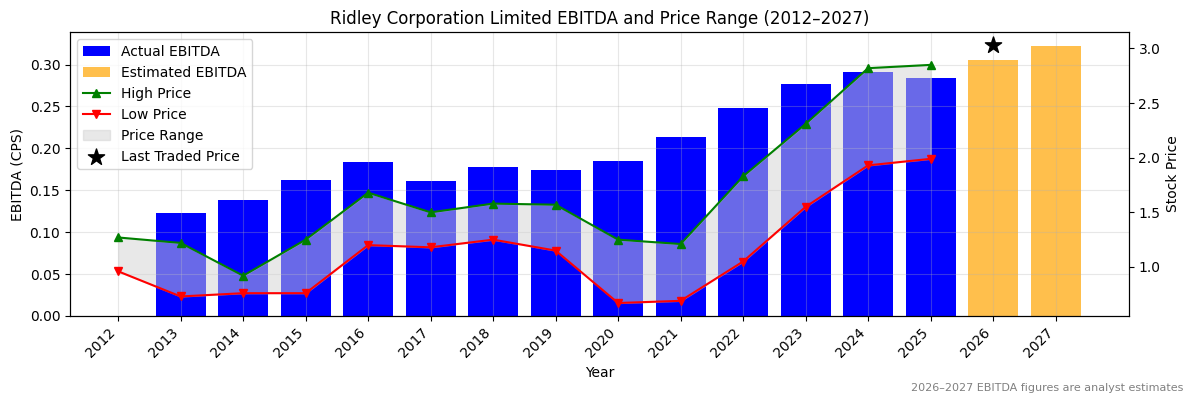
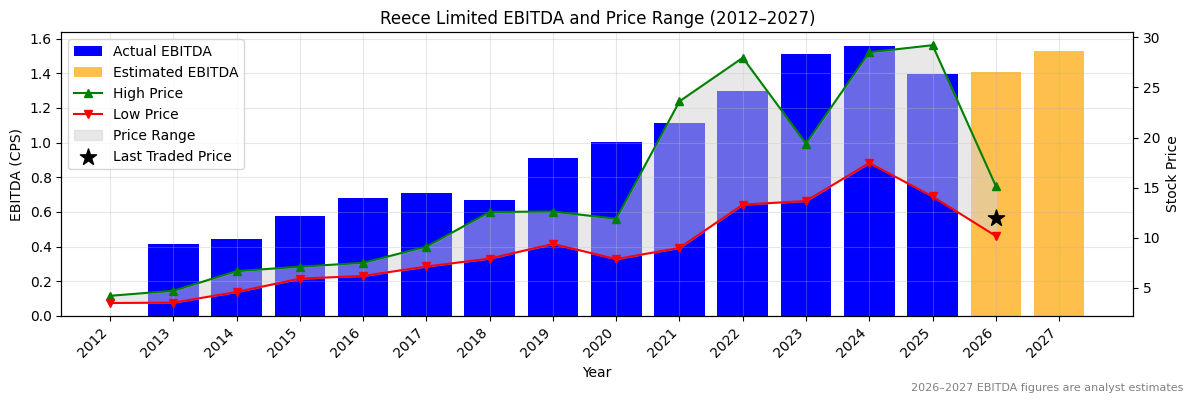
EBITDA 2024 Per Share |
EBITDA 2025e Per Share |
EBITDA 2026e Per Share |
EBITDA 24 to 25e [%] |
EBITDA 25e to 26e [%] |
| 3.95645 |
3.55003 |
3.71516 |
-10.3 |
4.7 |
0.29066 |
0.28406 |
0.30559 |
-2.3 |
7.6 |
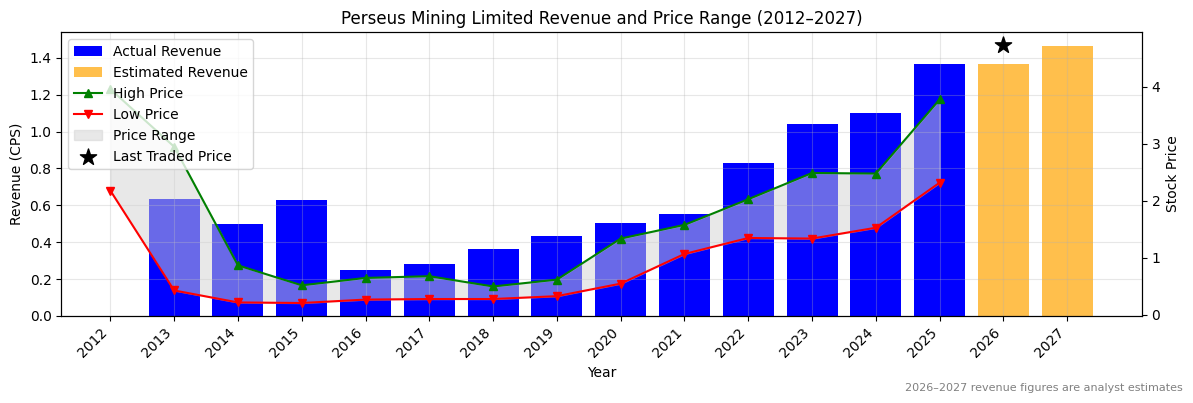
RIC Revenue Per Share (2012–2027)
❌
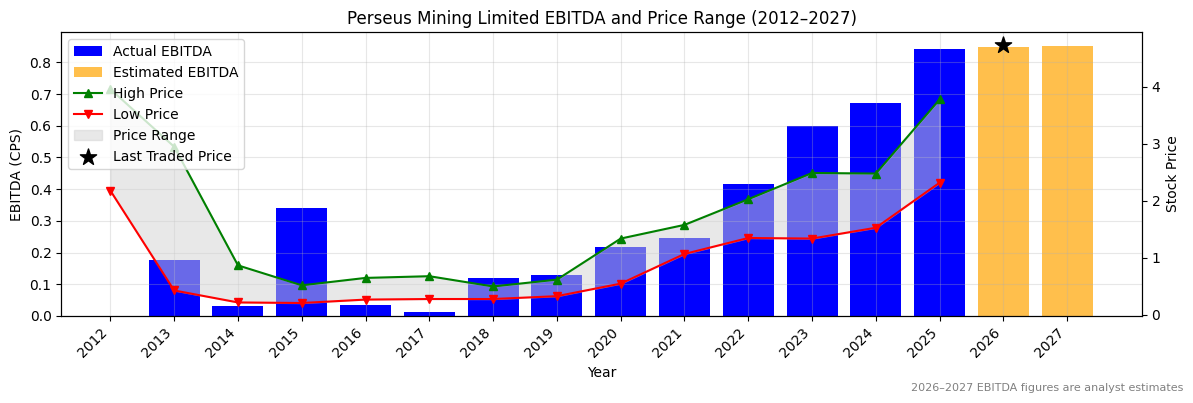
RIC Earnings before Interest, Tax, Depreciation and Amortisation (EBITDA) Per Share (2012–2027)
❌
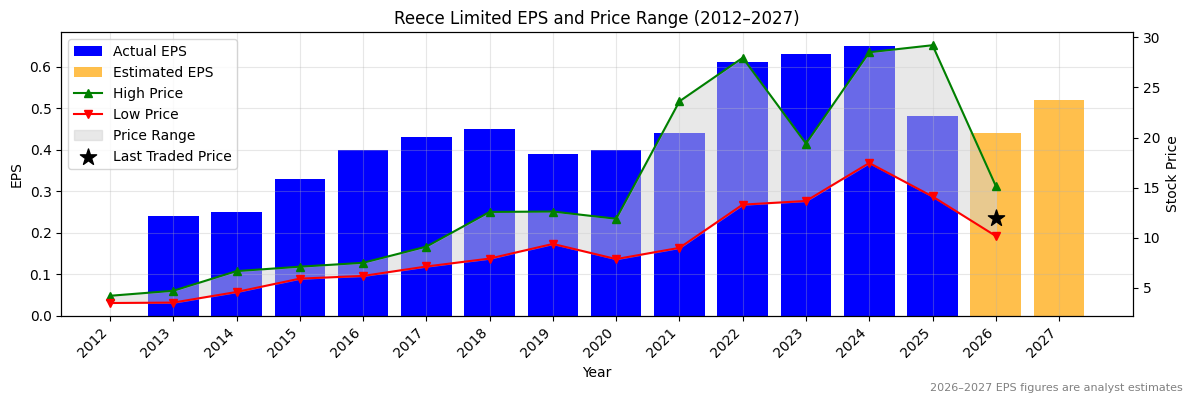
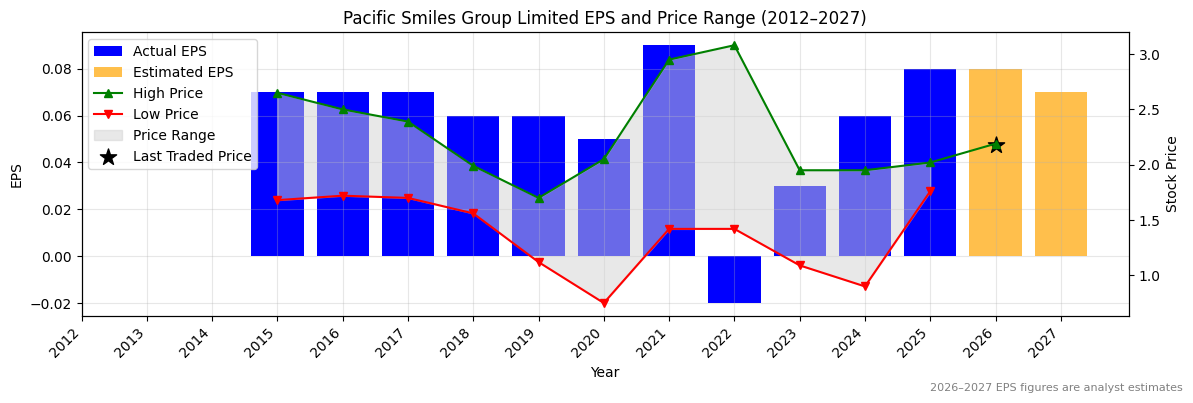
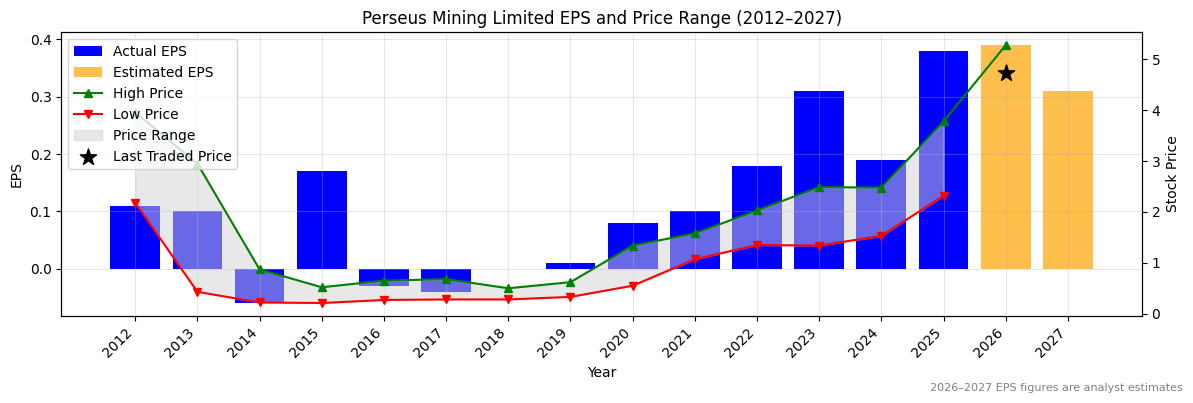
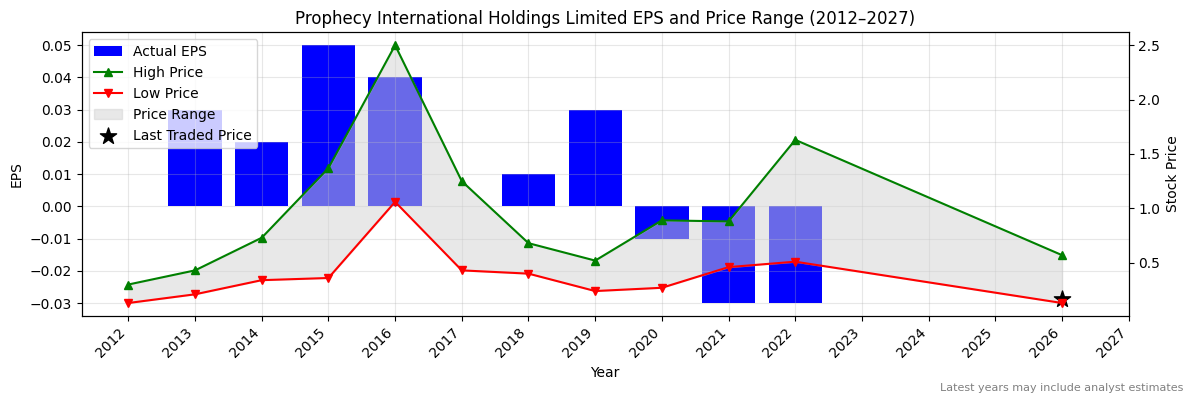
RIC Normalised Earnings Per Share (EPS) (2012–2027)
✅
Valuation
| Price To Sales |
Price To Book |
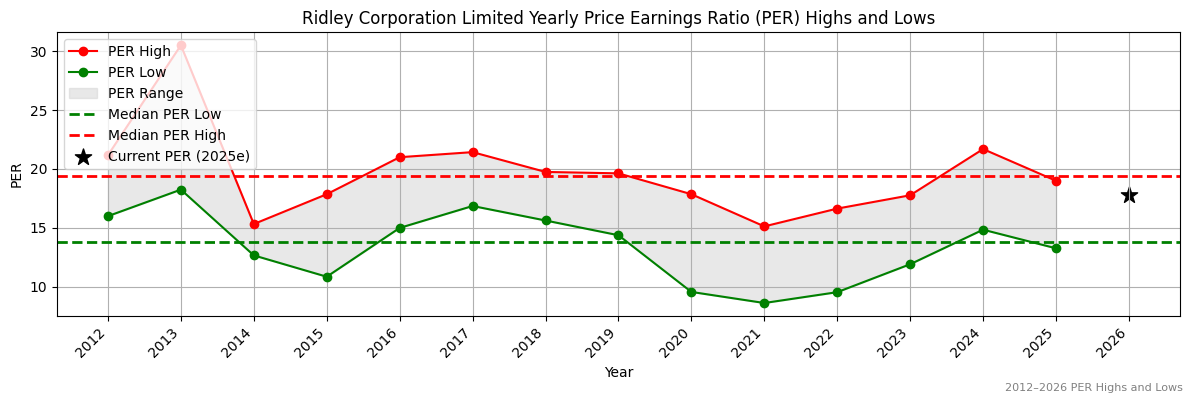
PER 2023 |
PER 2024 |
13Y Median PER Low |
PER 2025e |
13Y Median PER High |
PER 2026e |
Last Updated |
| 0.9 |
2.4 |
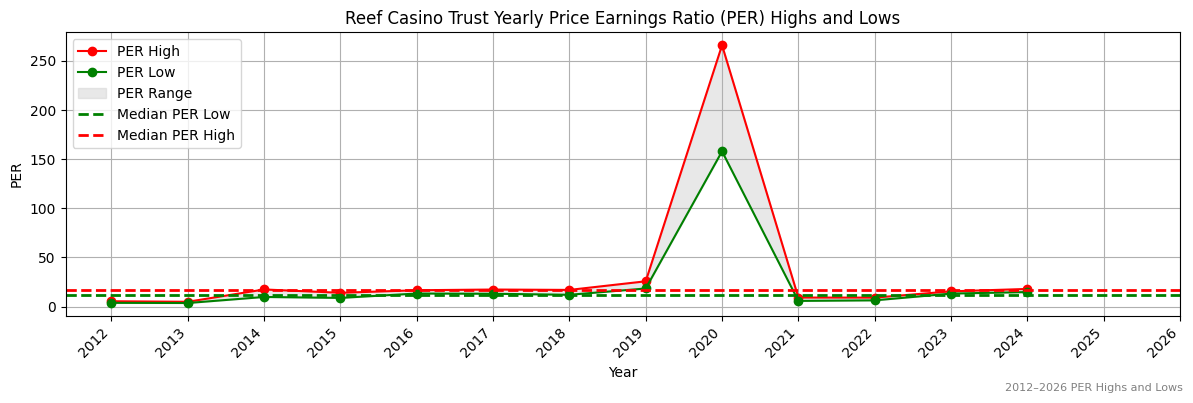
22.8 |
22.8 |
13.8 |
19.7 |
19.4 |
17.4 |
21/2/25 |
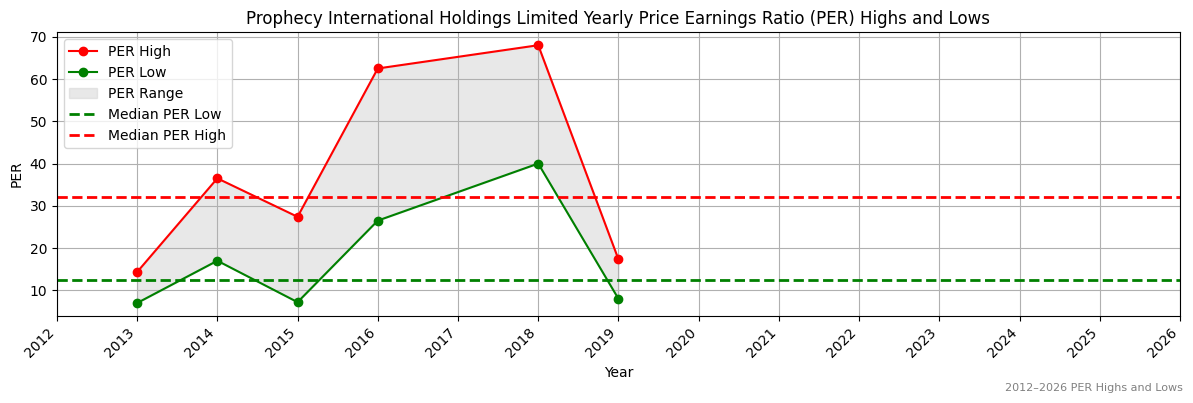
RIC Yearly Price Earnings Ratio (PER) Highs and Lows
❌
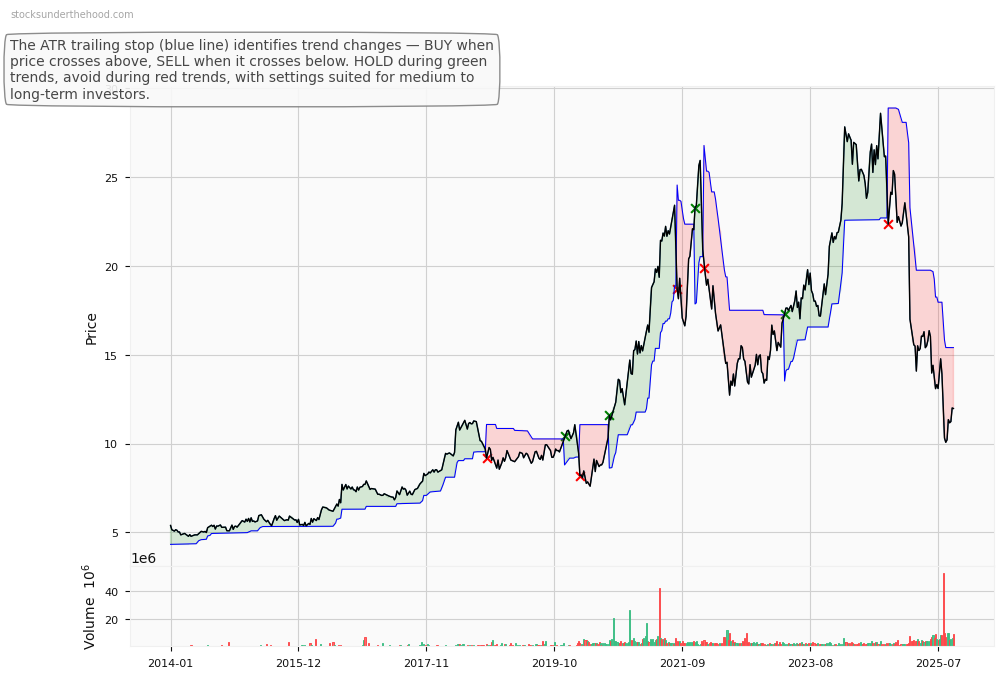
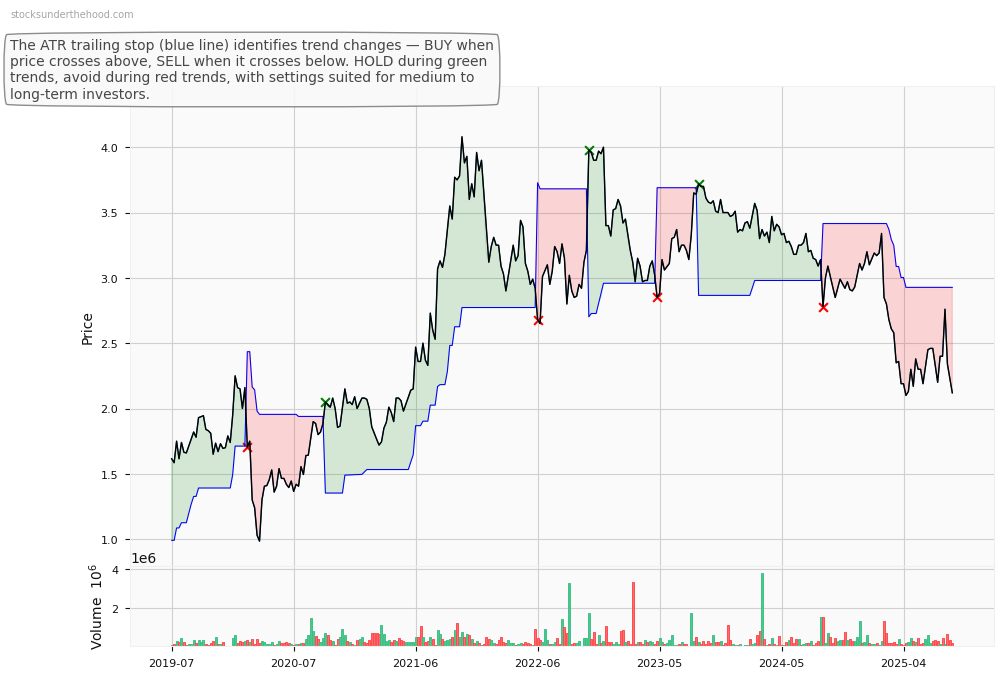
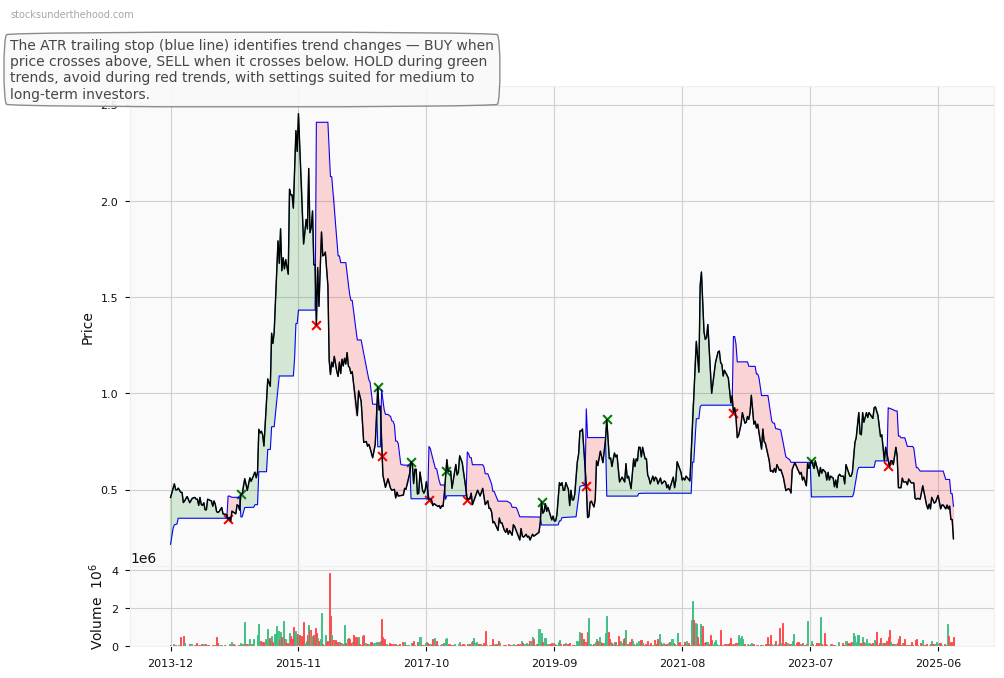
RIC Weekly Price Chart with Average True Range (ATR) Trailing Stop (10-Year View)
Ticker code: RHC
RHC Red Flags & Risk Indicators
⚠️
⚠️ RED FLAGS: 2 identified
- Falling Earnings
- More Net Debt Than Equity
Income Statement
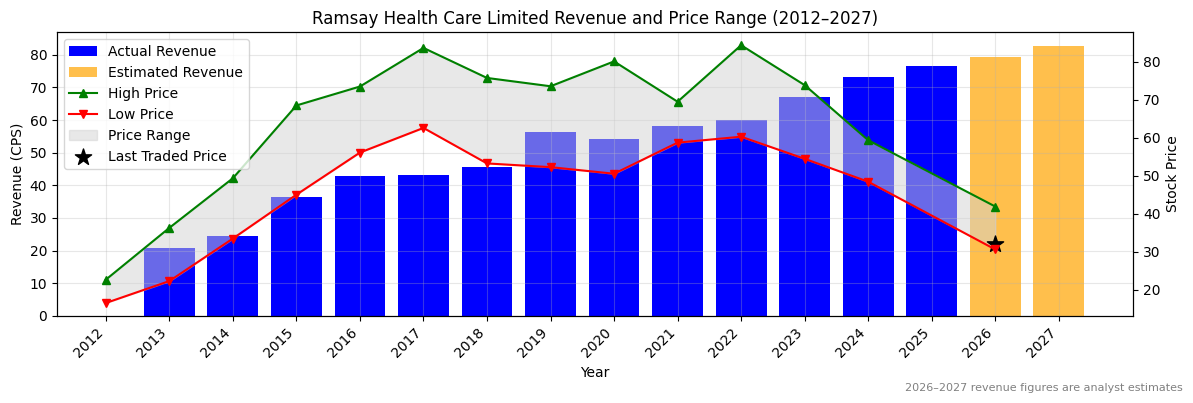
| Revenue 2024 Per Share |
Revenue 2025e Per Share |
Revenue 2026e Per Share |
Revenue 24 to 25e [%] |
Revenue 25e to 26e [%] |
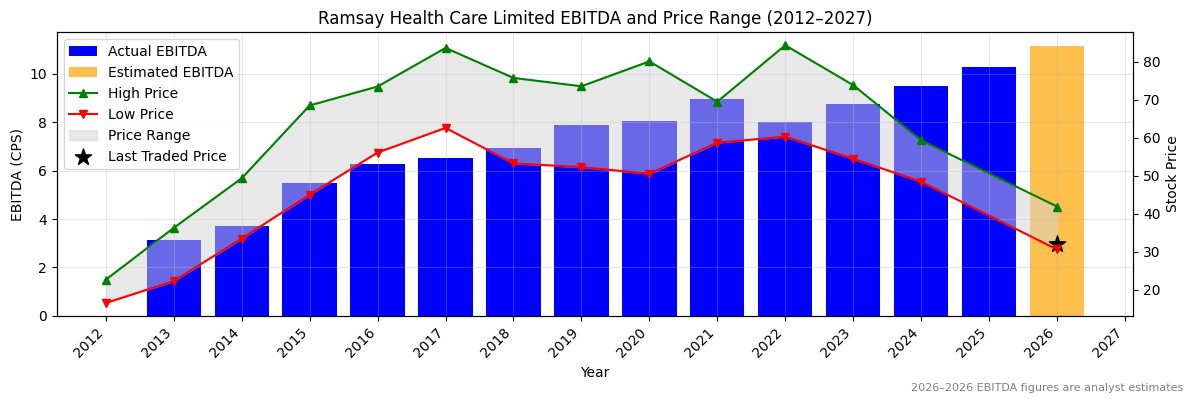
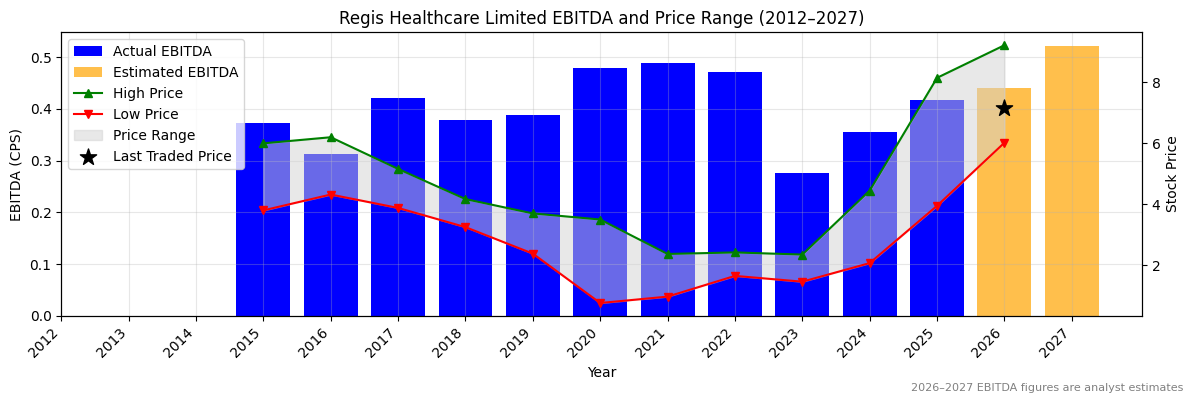
EBITDA 2024 Per Share |
EBITDA 2025e Per Share |
EBITDA 2026e Per Share |
EBITDA 24 to 25e [%] |
EBITDA 25e to 26e [%] |
| 73.30905 |
76.72688 |
79.44637 |
4.7 |
3.5 |
9.49381 |
10.2892 |
11.14995 |
8.4 |
8.4 |
RHC Revenue Per Share (2012–2027)
✅
RHC Earnings before Interest, Tax, Depreciation and Amortisation (EBITDA) Per Share (2012–2027)
✅
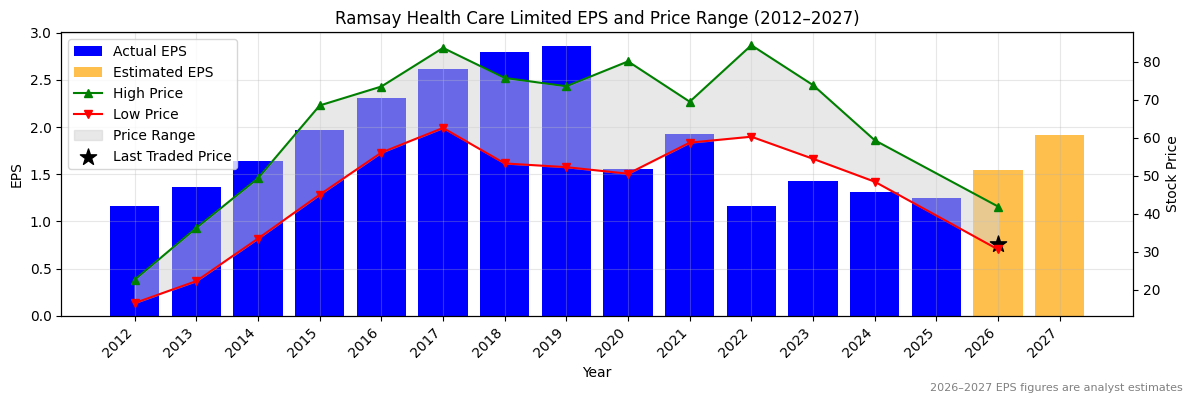
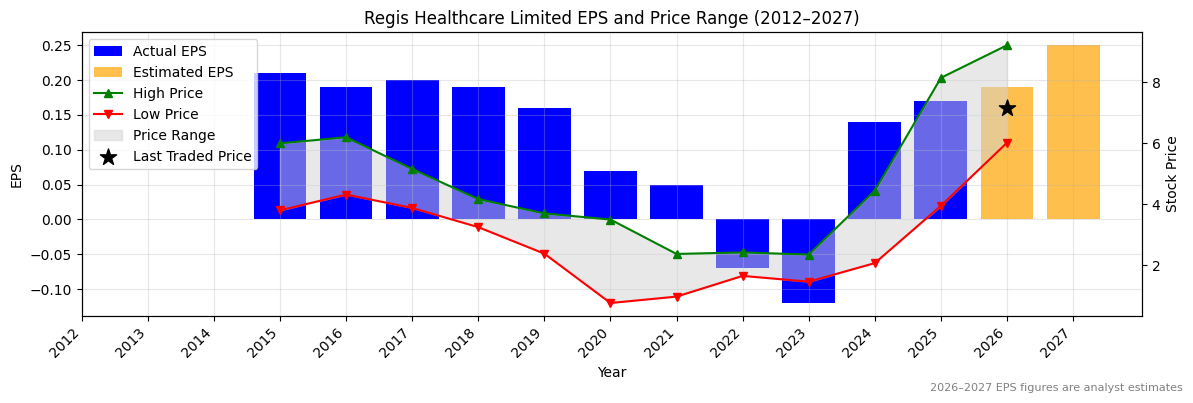
RHC Normalised Earnings Per Share (EPS) (2012–2027)
❌
Valuation
| Price To Sales |
Price To Book |
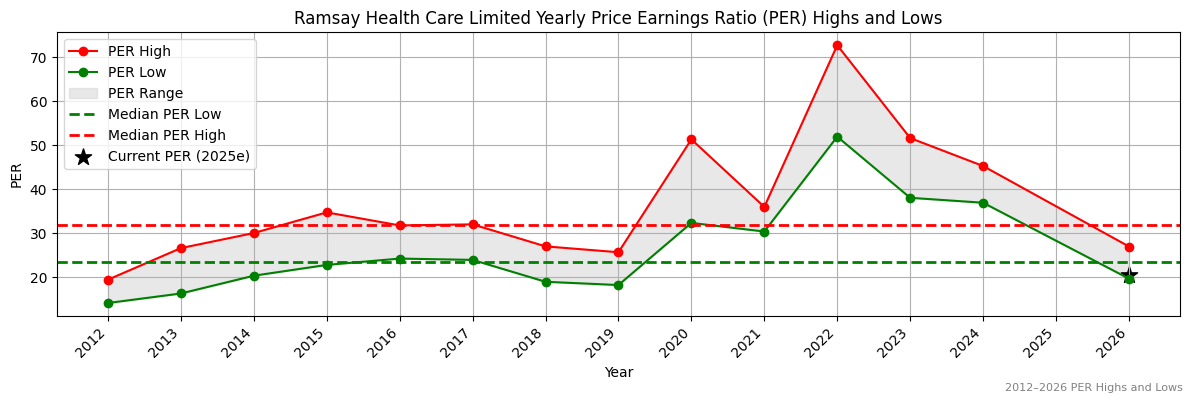
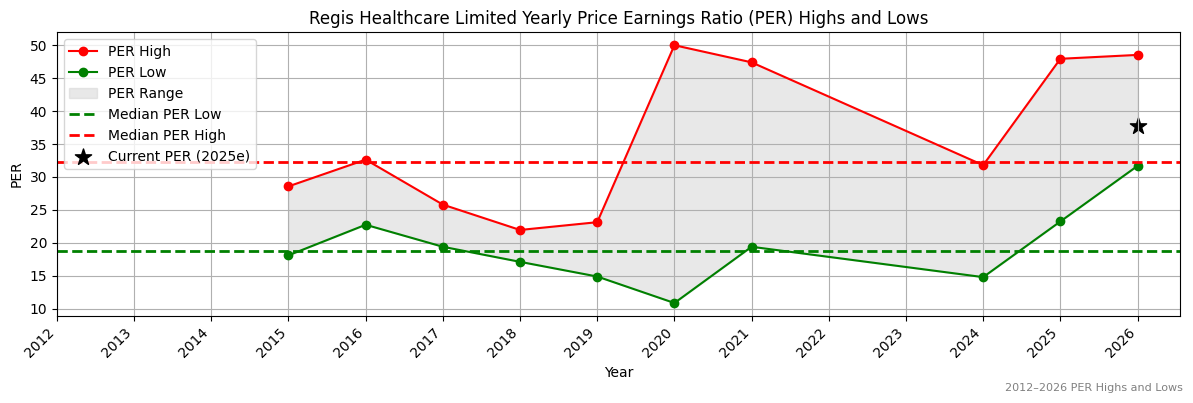
PER 2023 |
PER 2024 |
13Y Median PER Low |
PER 2025e |
13Y Median PER High |
PER 2026e |
Last Updated |
| 0.4 |
1.5 |
22.3 |
24.3 |
23.4 |
25.5 |
31.9 |
20.5 |
16/8/24 |
RHC Yearly Price Earnings Ratio (PER) Highs and Lows
✅
RHC Weekly Price Chart with Average True Range (ATR) Trailing Stop (10-Year View)
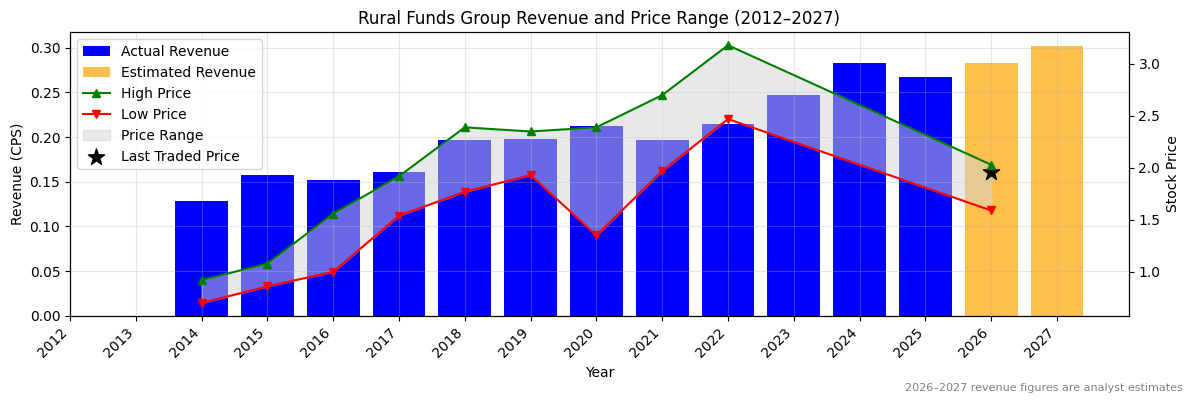
Ticker code: RFG
RFG Red Flags & Risk Indicators
❌
⚠️ RED FLAGS: 3 identified
- Large Share Issuance
- Falling Earnings
- Falling EBITDA Margins
Income Statement
| Revenue 2024 Per Share |
Revenue 2025e Per Share |
Revenue 2026e Per Share |
Revenue 24 to 25e [%] |
Revenue 25e to 26e [%] |
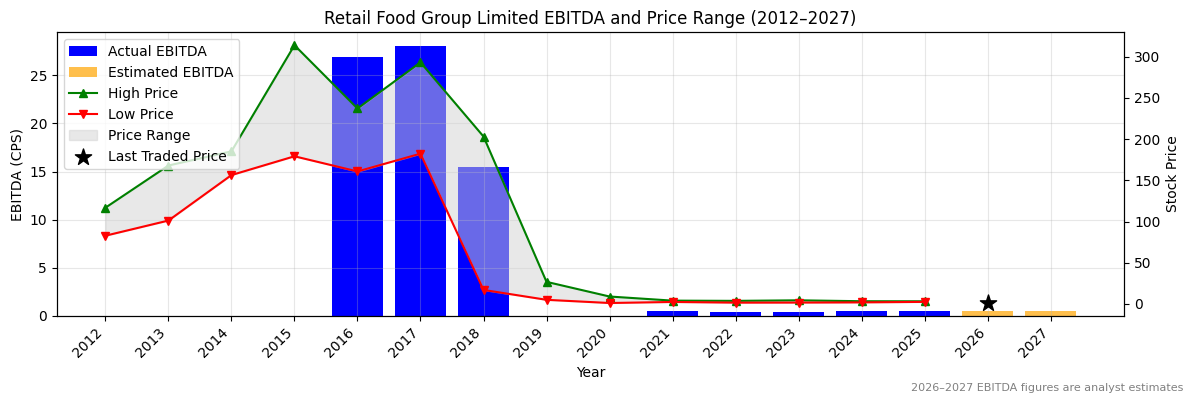
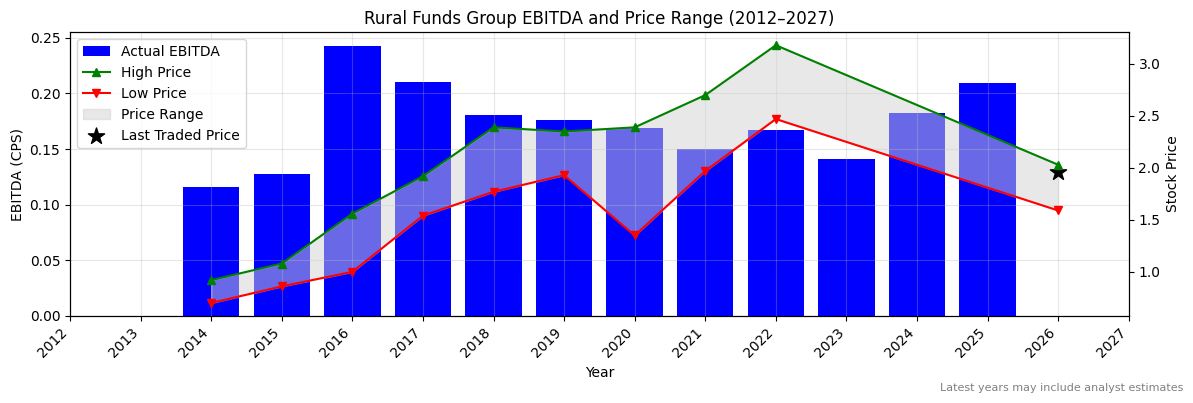
EBITDA 2024 Per Share |
EBITDA 2025e Per Share |
EBITDA 2026e Per Share |
EBITDA 24 to 25e [%] |
EBITDA 25e to 26e [%] |
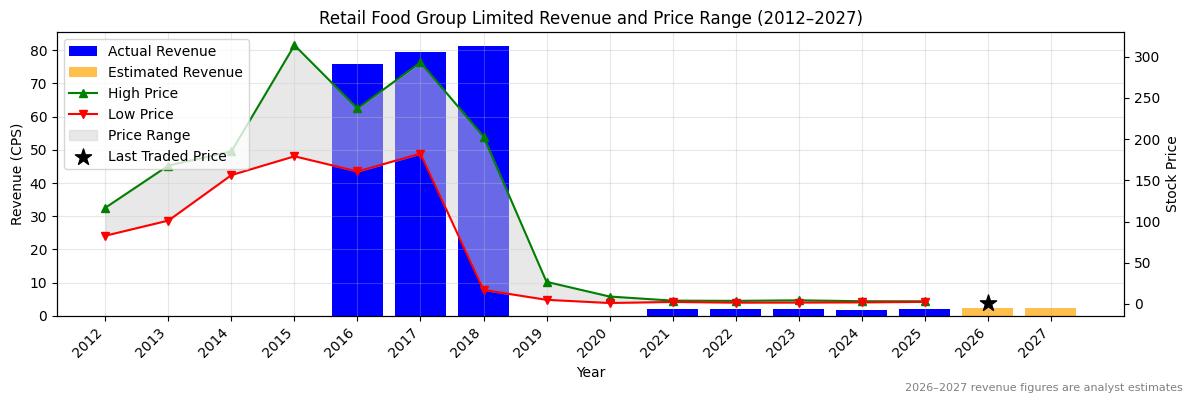
| 1.84727 |
2.11785 |
2.30555 |
14.6 |
8.9 |
0.46945 |
0.46704 |
0.50373 |
-0.5 |
7.9 |
RFG Revenue Per Share (2012–2027)
✅
RFG Earnings before Interest, Tax, Depreciation and Amortisation (EBITDA) Per Share (2012–2027)
❌
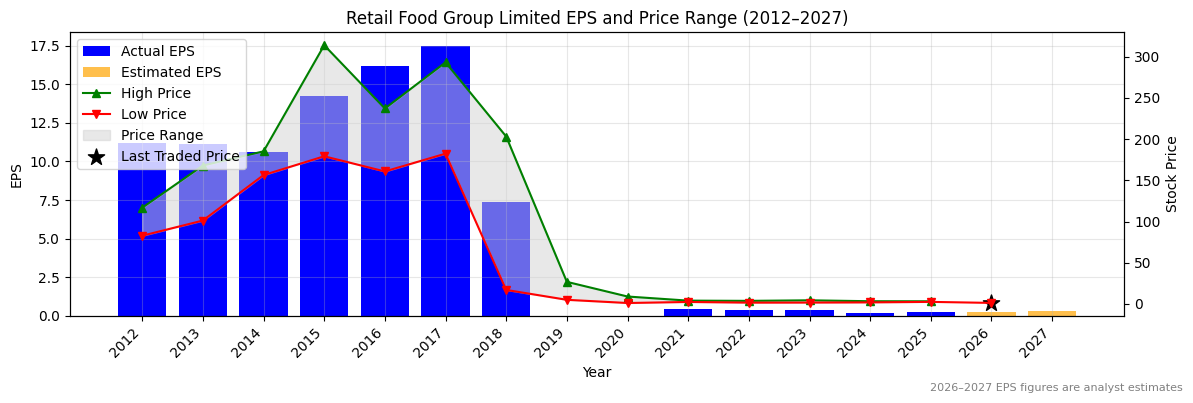
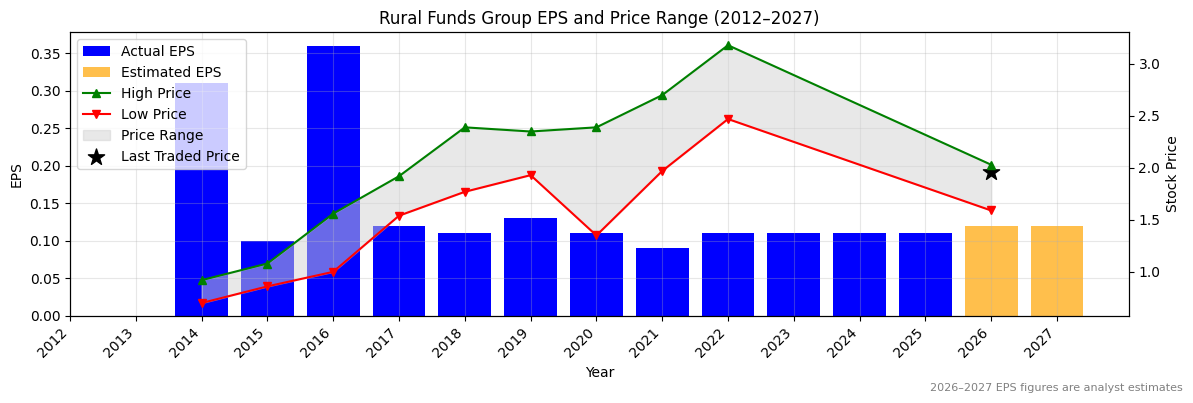
RFG Normalised Earnings Per Share (EPS) (2012–2027)
✅
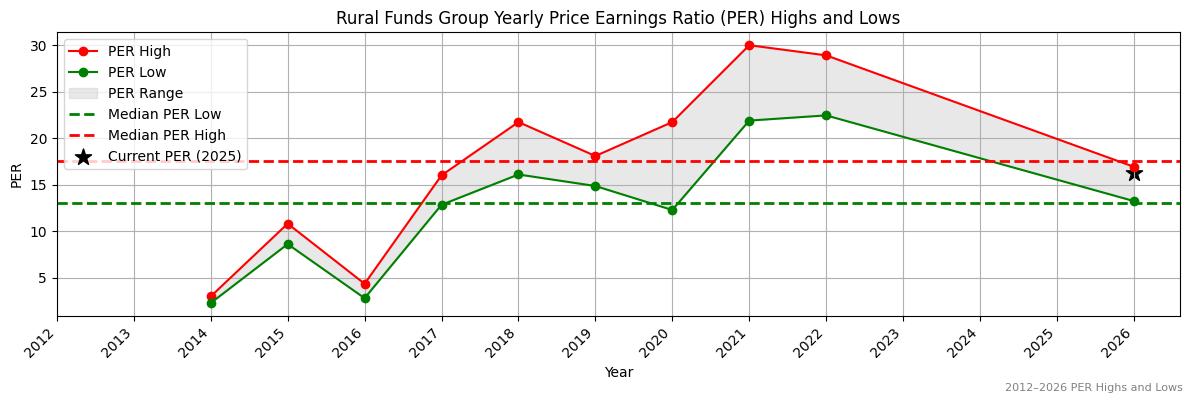
Valuation
| Price To Sales |
Price To Book |
PER 2023 |
PER 2024 |
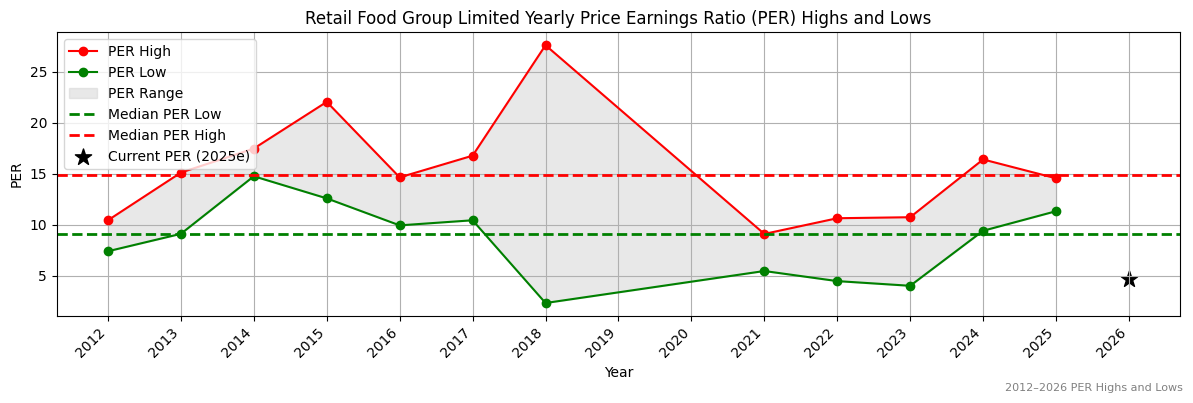
13Y Median PER Low |
PER 2025e |
13Y Median PER High |
PER 2026e |
Last Updated |
| 0.7 |
0.5 |
3.6 |
7.4 |
9.1 |
6.7 |
14.9 |
5.4 |
29/3/24 |
RFG Yearly Price Earnings Ratio (PER) Highs and Lows
✅✅
RFG Weekly Price Chart with Average True Range (ATR) Trailing Stop (10-Year View)
Ticker code: RGN
RGN Red Flags & Risk Indicators
✅
⚠️ RED FLAGS: 0 identified
No red flags detected.
Income Statement
| Revenue 2024 Per Share |
Revenue 2025e Per Share |
Revenue 2026e Per Share |
Revenue 24 to 25e [%] |
Revenue 25e to 26e [%] |
EBITDA 2024 Per Share |
EBITDA 2025e Per Share |
EBITDA 2026e Per Share |
EBITDA 24 to 25e [%] |
EBITDA 25e to 26e [%] |
| None |
None |
None |
None |
None |
None |
None |
None |
None |
None |
RGN Revenue Per Share (2012–2027)
RGN Earnings before Interest, Tax, Depreciation and Amortisation (EBITDA) Per Share (2012–2027)
RGN Normalised Earnings Per Share (EPS) (2012–2027)
Valuation
| Price To Sales |
Price To Book |
PER 2023 |
PER 2024 |
13Y Median PER Low |
PER 2025e |
13Y Median PER High |
PER 2026e |
Last Updated |
| 7.4 |
1.0 |
None |
None |
None |
None |
None |
None |
None |
RGN Yearly Price Earnings Ratio (PER) Highs and Lows
RGN Weekly Price Chart with Average True Range (ATR) Trailing Stop (10-Year View)
Ticker code: RFF
RFF Red Flags & Risk Indicators
⚠️
⚠️ RED FLAGS: 2 identified
- Highly Shorted
- Falling Earnings
Income Statement
| Revenue 2024 Per Share |
Revenue 2025e Per Share |
Revenue 2026e Per Share |
Revenue 24 to 25e [%] |
Revenue 25e to 26e [%] |
EBITDA 2024 Per Share |
EBITDA 2025e Per Share |
EBITDA 2026e Per Share |
EBITDA 24 to 25e [%] |
EBITDA 25e to 26e [%] |
| 0.28276 |
0.26692 |
0.2831 |
-5.6 |
6.1 |
0.182 |
0.20943 |
None |
15.1 |
None |
RFF Revenue Per Share (2012–2027)
❌
RFF Earnings before Interest, Tax, Depreciation and Amortisation (EBITDA) Per Share (2012–2027)
✅
RFF Normalised Earnings Per Share (EPS) (2012–2027)
❌
Valuation
| Price To Sales |
Price To Book |
PER 2023 |
PER 2024 |
13Y Median PER Low |
PER 2025e |
13Y Median PER High |
PER 2026e |
Last Updated |
| 5.6 |
0.7 |
17.4 |
17.4 |
13.0 |
17.4 |
17.5 |
15.9 |
5/5/24 |
RFF Yearly Price Earnings Ratio (PER) Highs and Lows
✅
RFF Weekly Price Chart with Average True Range (ATR) Trailing Stop (10-Year View)
Ticker code: REH
REH Red Flags & Risk Indicators
❌
⚠️ RED FLAGS: 3 identified
- Increasing Shorts
- Falling Earnings
- Falling EBITDA Margins
Income Statement
| Revenue 2024 Per Share |
Revenue 2025e Per Share |
Revenue 2026e Per Share |
Revenue 24 to 25e [%] |
Revenue 25e to 26e [%] |
EBITDA 2024 Per Share |
EBITDA 2025e Per Share |
EBITDA 2026e Per Share |
EBITDA 24 to 25e [%] |
EBITDA 25e to 26e [%] |
| 14.09442 |
13.89876 |
14.43552 |
-1.4 |
3.9 |
1.55855 |
1.39404 |
1.40741 |
-10.6 |
1.0 |
REH Revenue Per Share (2012–2027)
❌
REH Earnings before Interest, Tax, Depreciation and Amortisation (EBITDA) Per Share (2012–2027)
❌
REH Normalised Earnings Per Share (EPS) (2012–2027)
❌
Valuation
| Price To Sales |
Price To Book |
PER 2023 |
PER 2024 |
13Y Median PER Low |
PER 2025e |
13Y Median PER High |
PER 2026e |
Last Updated |
| 0.8 |
1.9 |
18.6 |
18.0 |
20.1 |
24.4 |
30.3 |
26.6 |
22/10/25 |
REH Yearly Price Earnings Ratio (PER) Highs and Lows
✅
REH Weekly Price Chart with Average True Range (ATR) Trailing Stop (10-Year View)
Ticker code: REG
REG Red Flags & Risk Indicators
❌
⚠️ RED FLAGS: 4 identified
- Increasing Shorts
- Negative Equity
- More Net Debt Than Equity
- High Relative Valuation
Income Statement
| Revenue 2024 Per Share |
Revenue 2025e Per Share |
Revenue 2026e Per Share |
Revenue 24 to 25e [%] |
Revenue 25e to 26e [%] |
EBITDA 2024 Per Share |
EBITDA 2025e Per Share |
EBITDA 2026e Per Share |
EBITDA 24 to 25e [%] |
EBITDA 25e to 26e [%] |
| 3.71532 |
4.29253 |
4.38058 |
15.5 |
2.1 |
0.35615 |
0.41796 |
0.43964 |
17.4 |
5.2 |
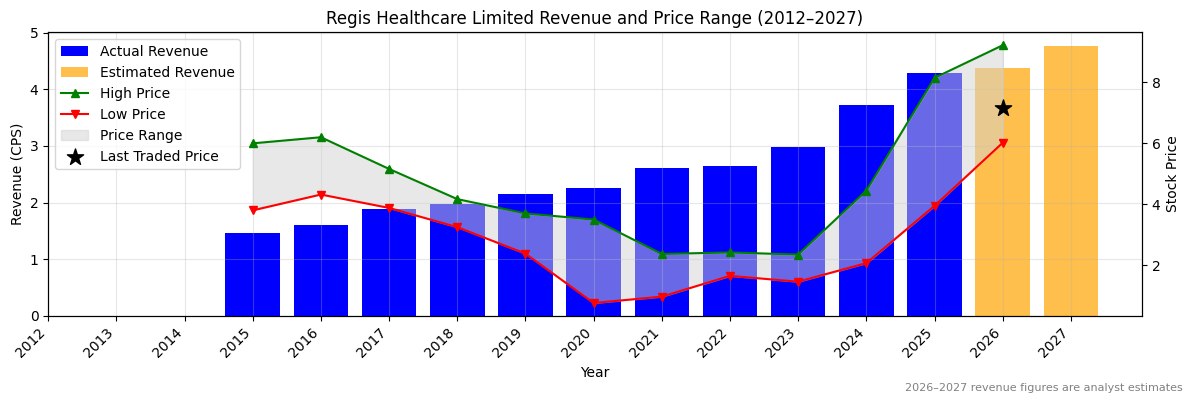
REG Revenue Per Share (2012–2027)
✅
REG Earnings before Interest, Tax, Depreciation and Amortisation (EBITDA) Per Share (2012–2027)
✅
REG Normalised Earnings Per Share (EPS) (2012–2027)
✅✅
Valuation
| Price To Sales |
Price To Book |
PER 2023 |
PER 2024 |
13Y Median PER Low |
PER 2025e |
13Y Median PER High |
PER 2026e |
Last Updated |
| 1.9 |
-132.3 |
-61.7 |
52.9 |
18.7 |
43.6 |
32.2 |
39.0 |
11/10/25 |
REG Yearly Price Earnings Ratio (PER) Highs and Lows
❌
REG Weekly Price Chart with Average True Range (ATR) Trailing Stop (10-Year View)
Ticker code: REA
REA Red Flags & Risk Indicators
⚠️
⚠️ RED FLAGS: 1 identified
Income Statement
| Revenue 2024 Per Share |
Revenue 2025e Per Share |
Revenue 2026e Per Share |
Revenue 24 to 25e [%] |
Revenue 25e to 26e [%] |
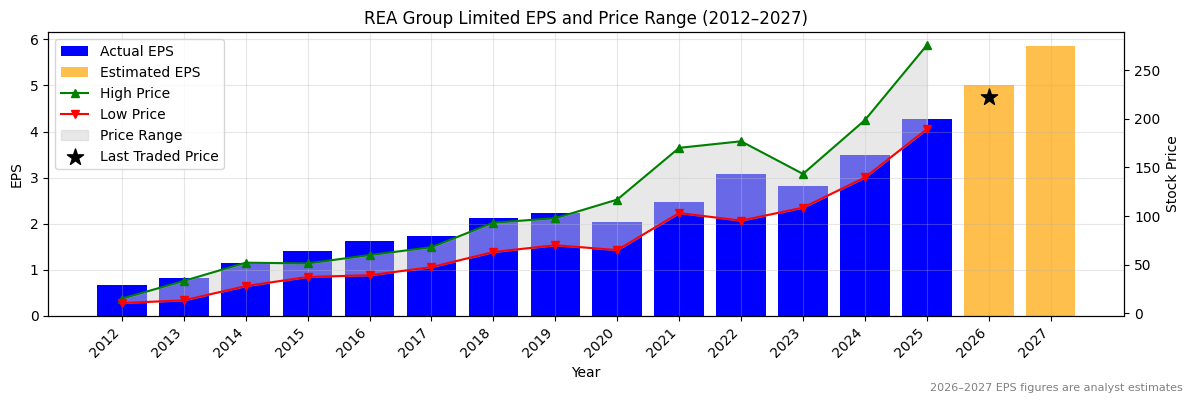
EBITDA 2024 Per Share |
EBITDA 2025e Per Share |
EBITDA 2026e Per Share |
EBITDA 24 to 25e [%] |
EBITDA 25e to 26e [%] |
| 10.99773 |
12.66313 |
14.01097 |
15.1 |
10.6 |
6.04542 |
7.1408 |
8.18864 |
18.1 |
14.7 |
REA Revenue Per Share (2012–2027)
✅
REA Earnings before Interest, Tax, Depreciation and Amortisation (EBITDA) Per Share (2012–2027)
✅
REA Normalised Earnings Per Share (EPS) (2012–2027)
✅✅
Valuation
| Price To Sales |
Price To Book |
PER 2023 |
PER 2024 |
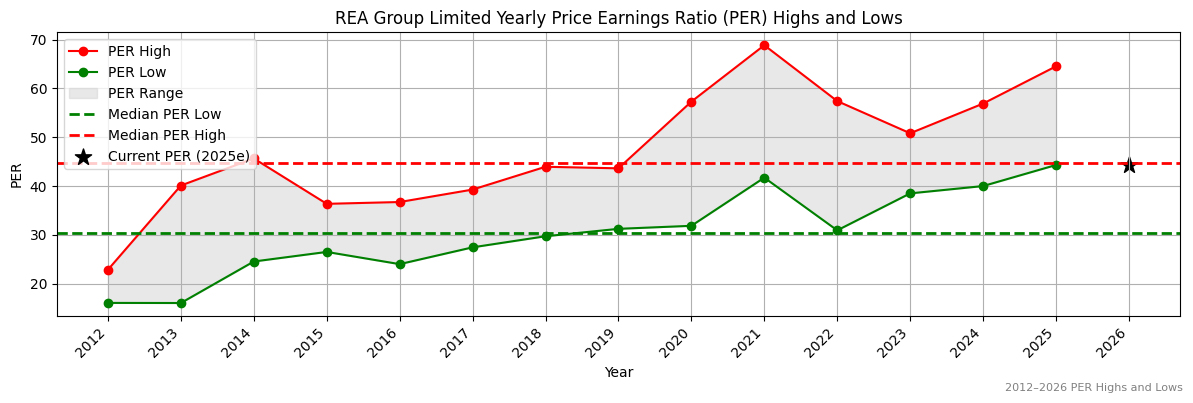
13Y Median PER Low |
PER 2025e |
13Y Median PER High |
PER 2026e |
Last Updated |
| 14.8 |
14.7 |
75.6 |
61.1 |
30.3 |
49.9 |
44.8 |
42.6 |
20/10/25 |
REA Yearly Price Earnings Ratio (PER) Highs and Lows
❌
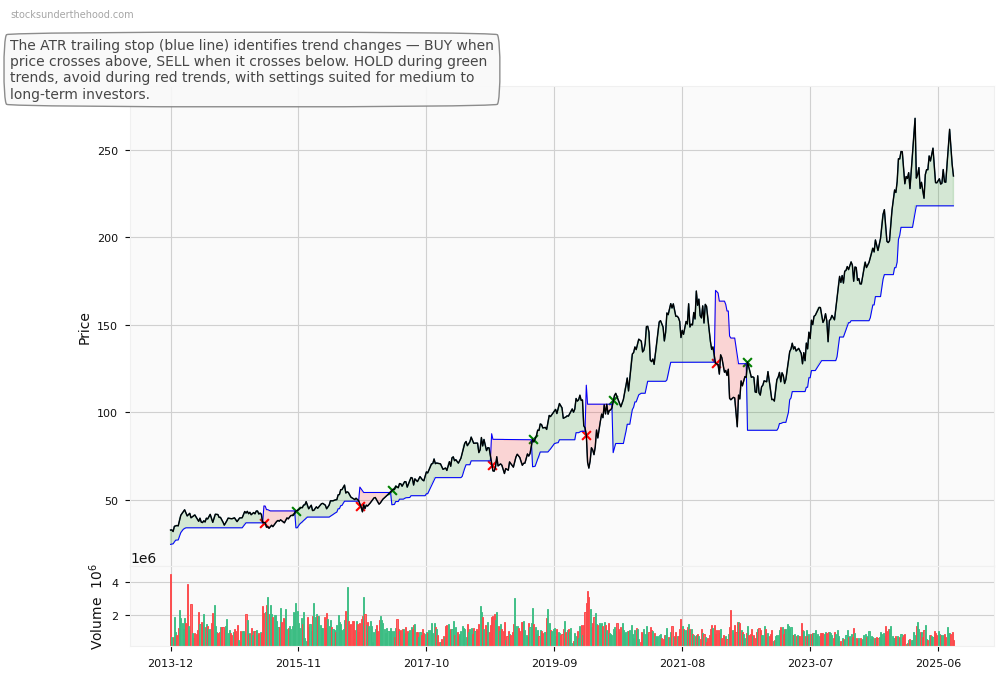
REA Weekly Price Chart with Average True Range (ATR) Trailing Stop (10-Year View)
Ticker code: RDY
RDY Red Flags & Risk Indicators
❌
⚠️ RED FLAGS: 3 identified
- Increasing Shorts
- Falling Earnings
- Falling EBITDA Margins
Income Statement
| Revenue 2024 Per Share |
Revenue 2025e Per Share |
Revenue 2026e Per Share |
Revenue 24 to 25e [%] |
Revenue 25e to 26e [%] |
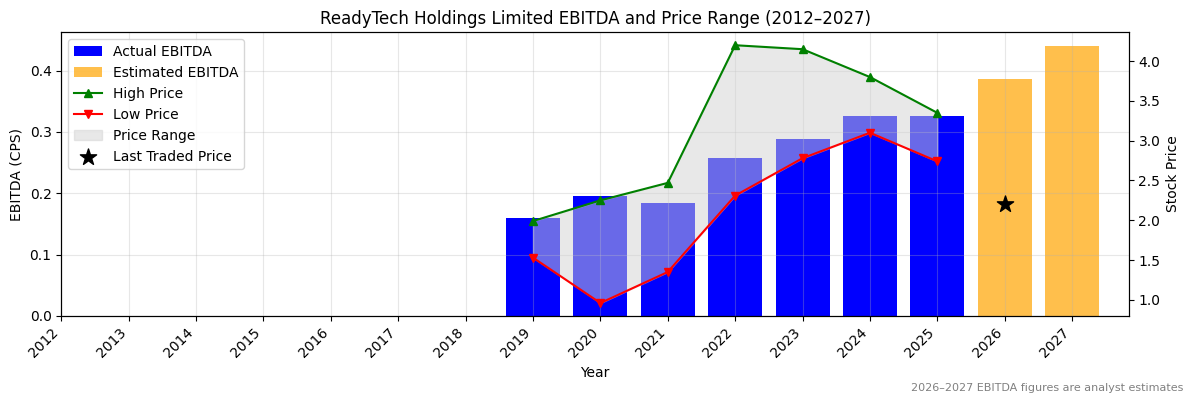
EBITDA 2024 Per Share |
EBITDA 2025e Per Share |
EBITDA 2026e Per Share |
EBITDA 24 to 25e [%] |
EBITDA 25e to 26e [%] |
| 0.95681 |
1.00207 |
1.12937 |
4.7 |
12.7 |
0.32622 |
0.32631 |
0.3866 |
0.0 |
18.5 |
RDY Revenue Per Share (2012–2027)
✅
RDY Earnings before Interest, Tax, Depreciation and Amortisation (EBITDA) Per Share (2012–2027)
❌
RDY Normalised Earnings Per Share (EPS) (2012–2027)
❌
Valuation
| Price To Sales |
Price To Book |
PER 2023 |
PER 2024 |
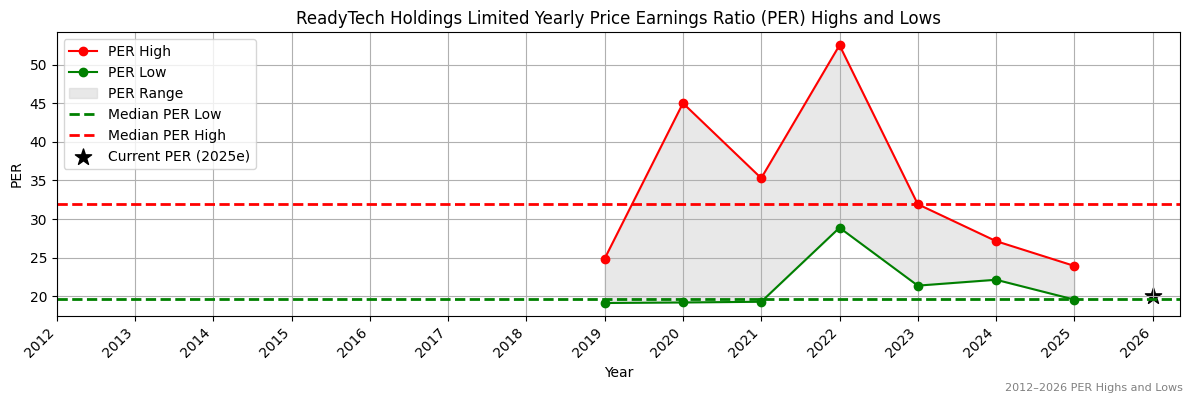
13Y Median PER Low |
PER 2025e |
13Y Median PER High |
PER 2026e |
Last Updated |
| 2.2 |
1.9 |
16.8 |
15.6 |
19.6 |
15.6 |
31.9 |
19.9 |
27/5/25 |
RDY Yearly Price Earnings Ratio (PER) Highs and Lows
✅✅
RDY Weekly Price Chart with Average True Range (ATR) Trailing Stop (10-Year View)
Ticker code: RCT
RCT Red Flags & Risk Indicators
❌
⚠️ RED FLAGS: 4 identified
- Falling Earnings
- Falling Revenues
- High Price to Book vs ROE
- High Relative Valuation
Income Statement
| Revenue 2024 Per Share |
Revenue 2025e Per Share |
Revenue 2026e Per Share |
Revenue 24 to 25e [%] |
Revenue 25e to 26e [%] |
EBITDA 2024 Per Share |
EBITDA 2025e Per Share |
EBITDA 2026e Per Share |
EBITDA 24 to 25e [%] |
EBITDA 25e to 26e [%] |
| 0.53764 |
None |
None |
None |
None |
0.32387 |
None |
None |
None |
None |
RCT Revenue Per Share (2012–2027)
RCT Earnings before Interest, Tax, Depreciation and Amortisation (EBITDA) Per Share (2012–2027)
RCT Normalised Earnings Per Share (EPS) (2012–2027)
Valuation
| Price To Sales |
Price To Book |
PER 2023 |
PER 2024 |
13Y Median PER Low |
PER 2025e |
13Y Median PER High |
PER 2026e |
Last Updated |
| 7.1 |
9.0 |
16.5 |
18.2 |
12.1 |
None |
16.7 |
None |
10/5/25 |
RCT Yearly Price Earnings Ratio (PER) Highs and Lows
RCT Weekly Price Chart with Average True Range (ATR) Trailing Stop (10-Year View)
Ticker code: QUB
QUB Red Flags & Risk Indicators
⚠️
⚠️ RED FLAGS: 2 identified
- Falling Earnings
- Falling EBITDA Margins
Income Statement
| Revenue 2024 Per Share |
Revenue 2025e Per Share |
Revenue 2026e Per Share |
Revenue 24 to 25e [%] |
Revenue 25e to 26e [%] |
EBITDA 2024 Per Share |
EBITDA 2025e Per Share |
EBITDA 2026e Per Share |
EBITDA 24 to 25e [%] |
EBITDA 25e to 26e [%] |
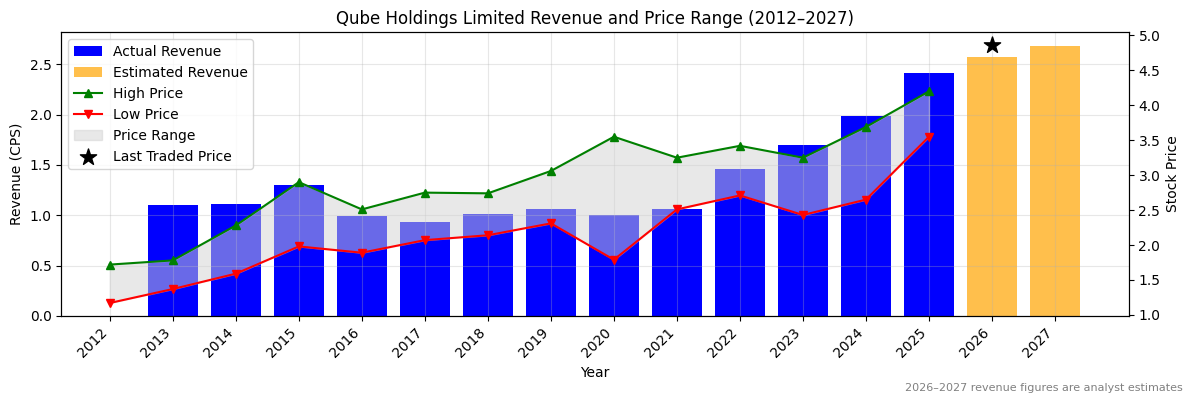
| 1.9828 |
2.41428 |
2.56994 |
21.8 |
6.4 |
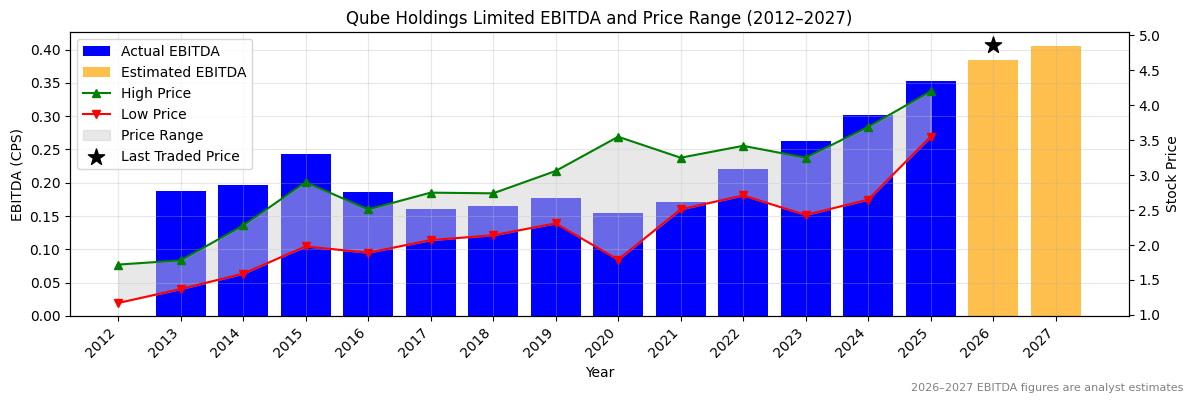
0.30226 |
0.35327 |
0.38453 |
16.9 |
8.8 |
QUB Revenue Per Share (2012–2027)
✅✅
QUB Earnings before Interest, Tax, Depreciation and Amortisation (EBITDA) Per Share (2012–2027)
✅
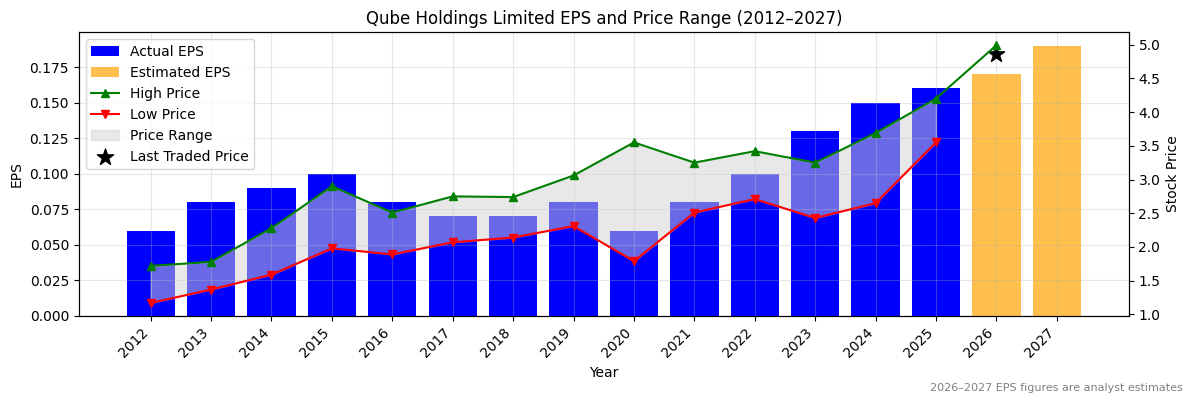
QUB Normalised Earnings Per Share (EPS) (2012–2027)
✅
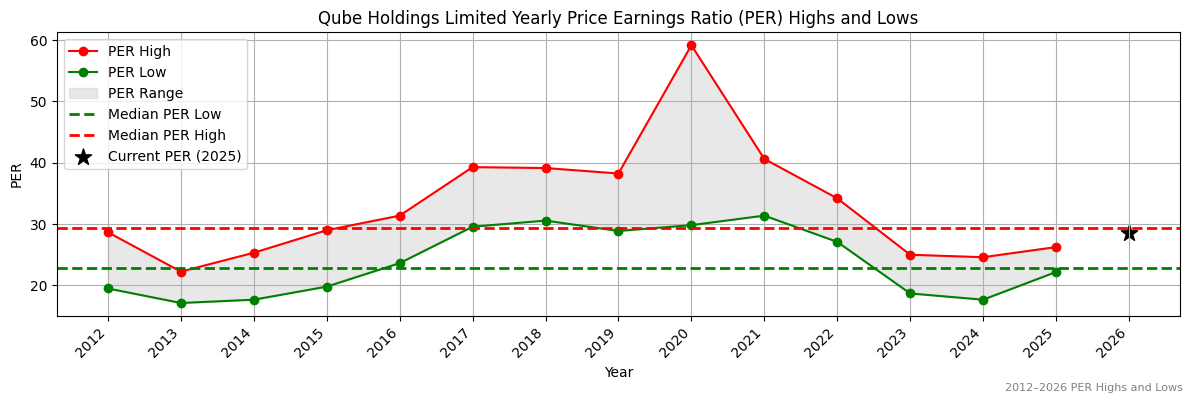
Valuation
| Price To Sales |
Price To Book |
PER 2023 |
PER 2024 |
13Y Median PER Low |
PER 2025e |
13Y Median PER High |
PER 2026e |
Last Updated |
| 1.9 |
2.6 |
33.8 |
29.3 |
22.9 |
27.4 |
29.0 |
25.8 |
29/4/25 |
QUB Yearly Price Earnings Ratio (PER) Highs and Lows
✅
QUB Weekly Price Chart with Average True Range (ATR) Trailing Stop (10-Year View)
Ticker code: QBE
QBE Red Flags & Risk Indicators
✅
⚠️ RED FLAGS: 0 identified
No red flags detected.
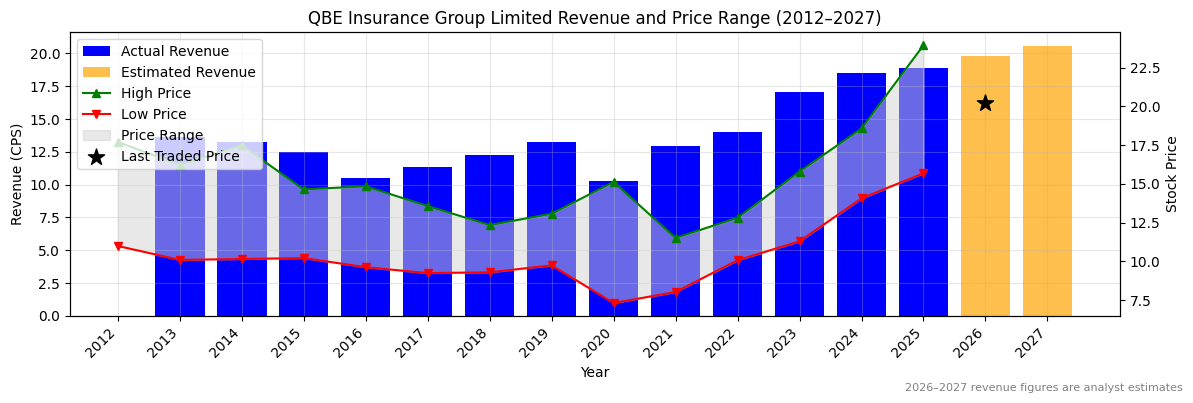
Income Statement
| Revenue 2024 Per Share |
Revenue 2025e Per Share |
Revenue 2026e Per Share |
Revenue 24 to 25e [%] |
Revenue 25e to 26e [%] |
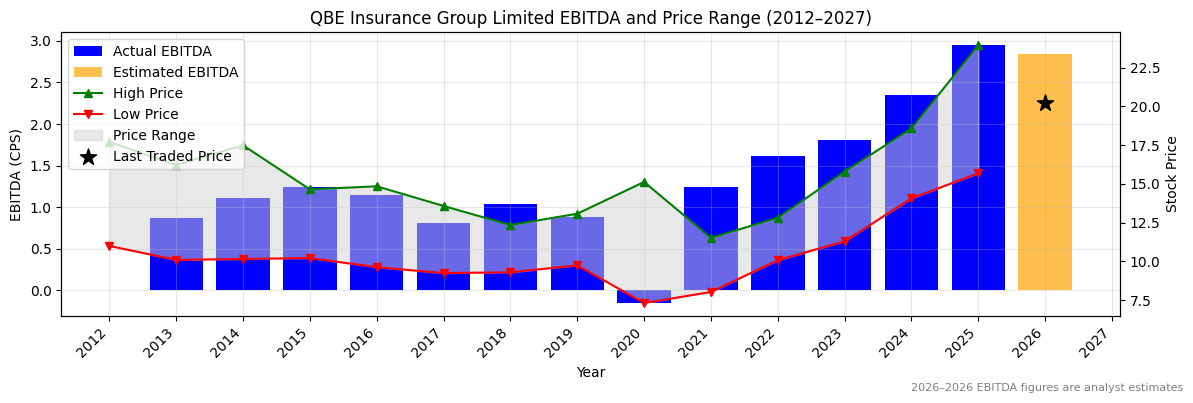
EBITDA 2024 Per Share |
EBITDA 2025e Per Share |
EBITDA 2026e Per Share |
EBITDA 24 to 25e [%] |
EBITDA 25e to 26e [%] |
| 18.50863 |
18.88867 |
19.80267 |
2.1 |
4.8 |
2.35009 |
2.94812 |
2.84681 |
25.4 |
-3.4 |
QBE Revenue Per Share (2012–2027)
✅
QBE Earnings before Interest, Tax, Depreciation and Amortisation (EBITDA) Per Share (2012–2027)
✅✅
QBE Normalised Earnings Per Share (EPS) (2012–2027)
✅
Valuation
| Price To Sales |
Price To Book |
PER 2023 |
PER 2024 |
13Y Median PER Low |
PER 2025e |
13Y Median PER High |
PER 2026e |
Last Updated |
| 1.3 |
2.7 |
14.8 |
11.1 |
11.4 |
10.2 |
16.0 |
10.6 |
3/10/25 |
QBE Yearly Price Earnings Ratio (PER) Highs and Lows
✅✅
QBE Weekly Price Chart with Average True Range (ATR) Trailing Stop (10-Year View)
Ticker code: QAN
QAN Red Flags & Risk Indicators
⚠️
⚠️ RED FLAGS: 1 identified
- More Net Debt Than Equity
Income Statement
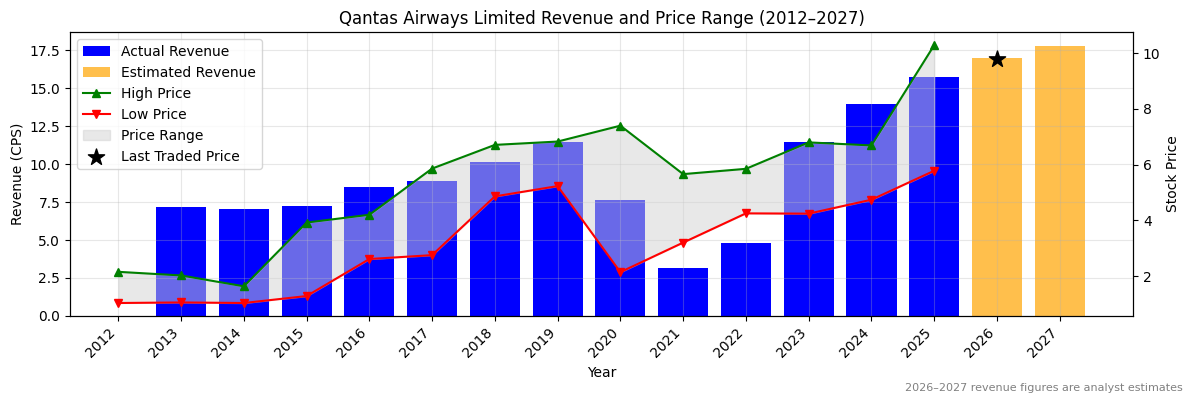
| Revenue 2024 Per Share |
Revenue 2025e Per Share |
Revenue 2026e Per Share |
Revenue 24 to 25e [%] |
Revenue 25e to 26e [%] |
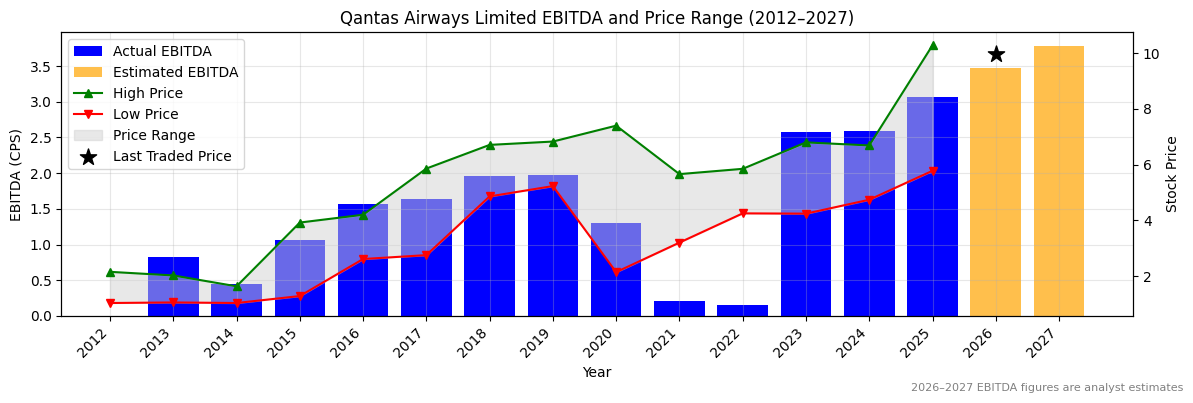
EBITDA 2024 Per Share |
EBITDA 2025e Per Share |
EBITDA 2026e Per Share |
EBITDA 24 to 25e [%] |
EBITDA 25e to 26e [%] |
| 13.98903 |
15.74346 |
16.9774 |
12.5 |
7.8 |
2.58369 |
3.06503 |
3.47137 |
18.6 |
13.3 |
QAN Revenue Per Share (2012–2027)
✅
QAN Earnings before Interest, Tax, Depreciation and Amortisation (EBITDA) Per Share (2012–2027)
✅
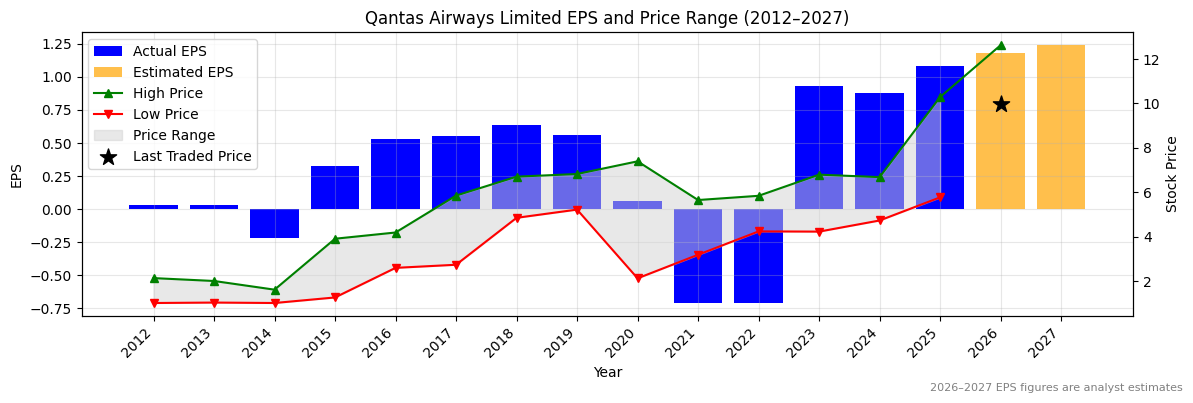
QAN Normalised Earnings Per Share (EPS) (2012–2027)
✅✅
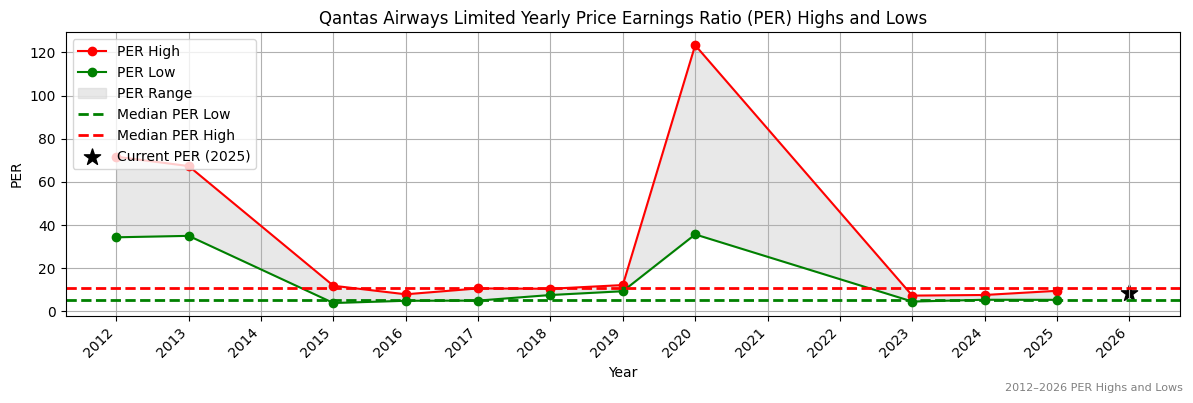
Valuation
| Price To Sales |
Price To Book |
PER 2023 |
PER 2024 |
13Y Median PER Low |
PER 2025e |
13Y Median PER High |
PER 2026e |
Last Updated |
| 0.6 |
19.8 |
11.0 |
11.6 |
5.4 |
9.4 |
10.7 |
8.6 |
26/10/25 |
QAN Yearly Price Earnings Ratio (PER) Highs and Lows
✅
QAN Weekly Price Chart with Average True Range (ATR) Trailing Stop (10-Year View)
Ticker code: PYPL
PYPL Red Flags & Risk Indicators
✅
⚠️ RED FLAGS: 0 identified
No red flags detected.
Income Statement
| Revenue 2024 Per Share |
Revenue 2025e Per Share |
Revenue 2026e Per Share |
Revenue 24 to 25e [%] |
Revenue 25e to 26e [%] |
EBITDA 2024 Per Share |
EBITDA 2025e Per Share |
EBITDA 2026e Per Share |
EBITDA 24 to 25e [%] |
EBITDA 25e to 26e [%] |
| 30.39732 |
35.17449 |
37.41244 |
15.7 |
6.4 |
6.3697 |
7.3033 |
7.99731 |
14.7 |
9.5 |
PYPL Revenue Per Share (2012–2027)
✅
PYPL Earnings before Interest, Tax, Depreciation and Amortisation (EBITDA) Per Share (2012–2027)
✅
PYPL Normalised Earnings Per Share (EPS) (2012–2027)
✅
Valuation
| Price To Sales |
Price To Book |
PER 2023 |
PER 2024 |
13Y Median PER Low |
PER 2025e |
13Y Median PER High |
PER 2026e |
Last Updated |
| 1.9 |
3.2 |
13.3 |
14.6 |
19.7 |
13.0 |
32.1 |
11.8 |
21/4/25 |
PYPL Yearly Price Earnings Ratio (PER) Highs and Lows
✅✅
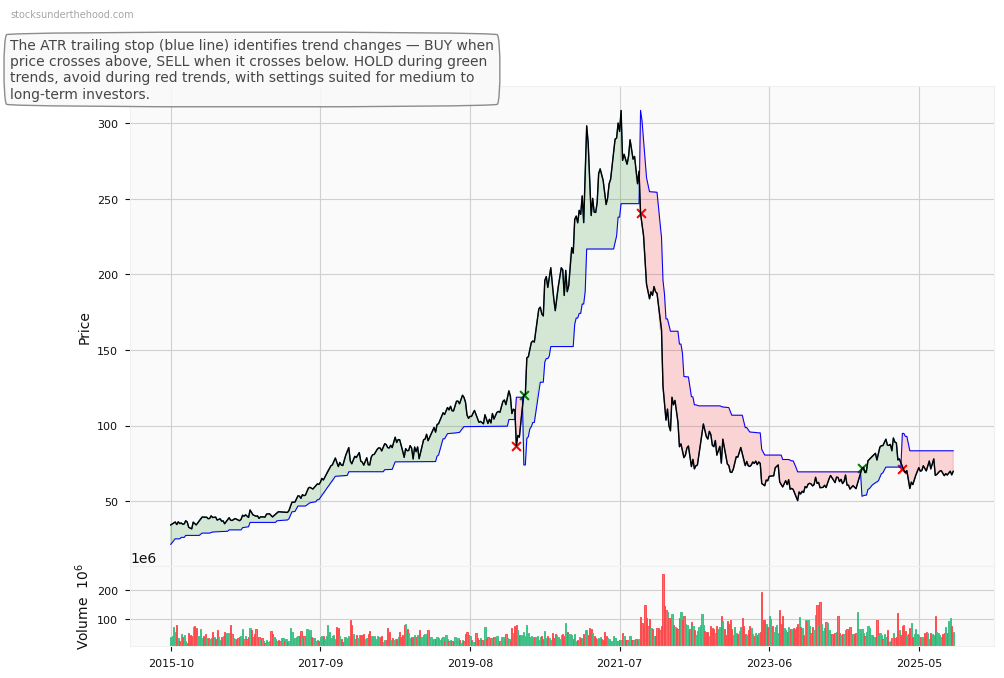
PYPL Weekly Price Chart with Average True Range (ATR) Trailing Stop (10-Year View)
Ticker code: PXA
PXA Red Flags & Risk Indicators
✅
⚠️ RED FLAGS: 0 identified
No red flags detected.
Income Statement
| Revenue 2024 Per Share |
Revenue 2025e Per Share |
Revenue 2026e Per Share |
Revenue 24 to 25e [%] |
Revenue 25e to 26e [%] |
EBITDA 2024 Per Share |
EBITDA 2025e Per Share |
EBITDA 2026e Per Share |
EBITDA 24 to 25e [%] |
EBITDA 25e to 26e [%] |
| None |
None |
None |
None |
None |
None |
None |
None |
None |
None |
PXA Revenue Per Share (2012–2027)
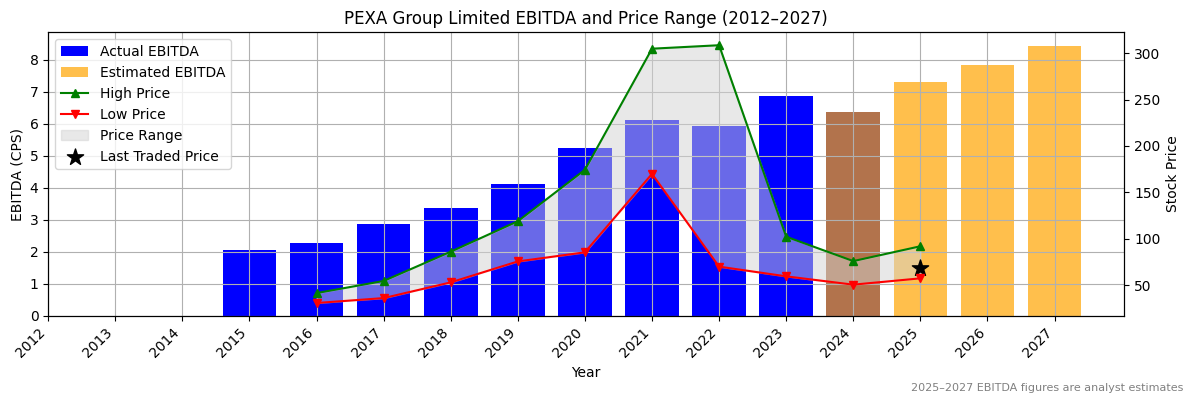
PXA Earnings before Interest, Tax, Depreciation and Amortisation (EBITDA) Per Share (2012–2027)
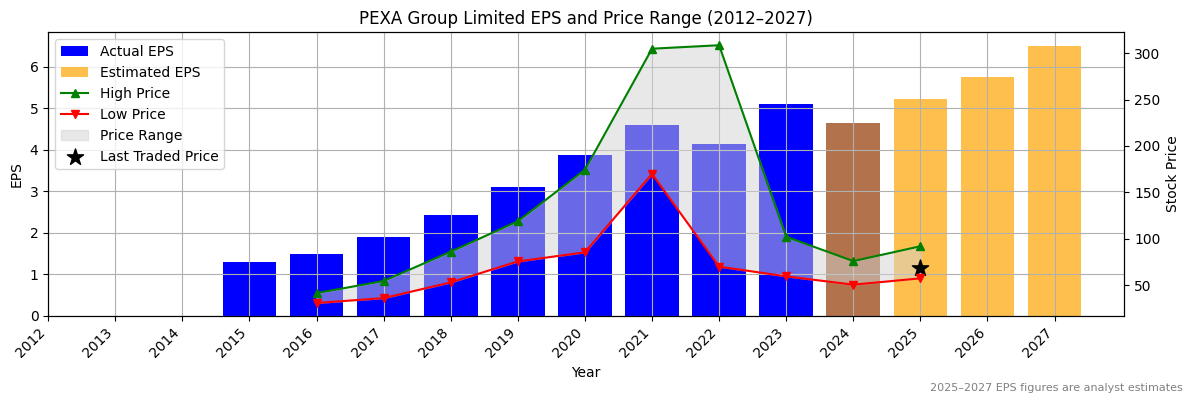
PXA Normalised Earnings Per Share (EPS) (2012–2027)
Valuation
| Price To Sales |
Price To Book |
PER 2023 |
PER 2024 |
13Y Median PER Low |
PER 2025e |
13Y Median PER High |
PER 2026e |
Last Updated |
| 6.8 |
2.3 |
None |
None |
None |
None |
None |
None |
None |
PXA Yearly Price Earnings Ratio (PER) Highs and Lows
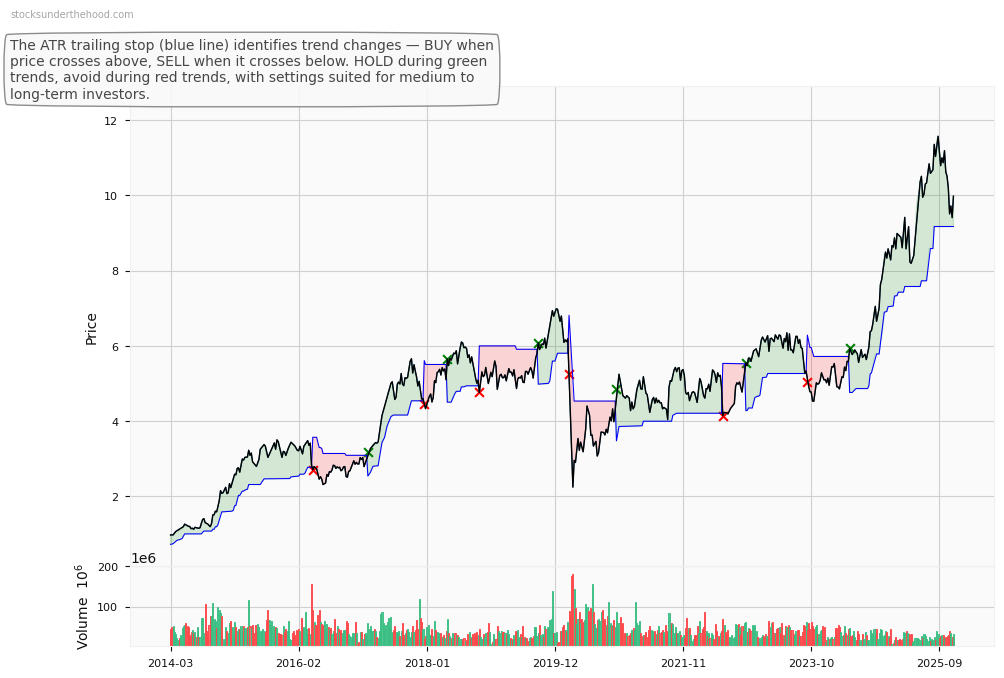
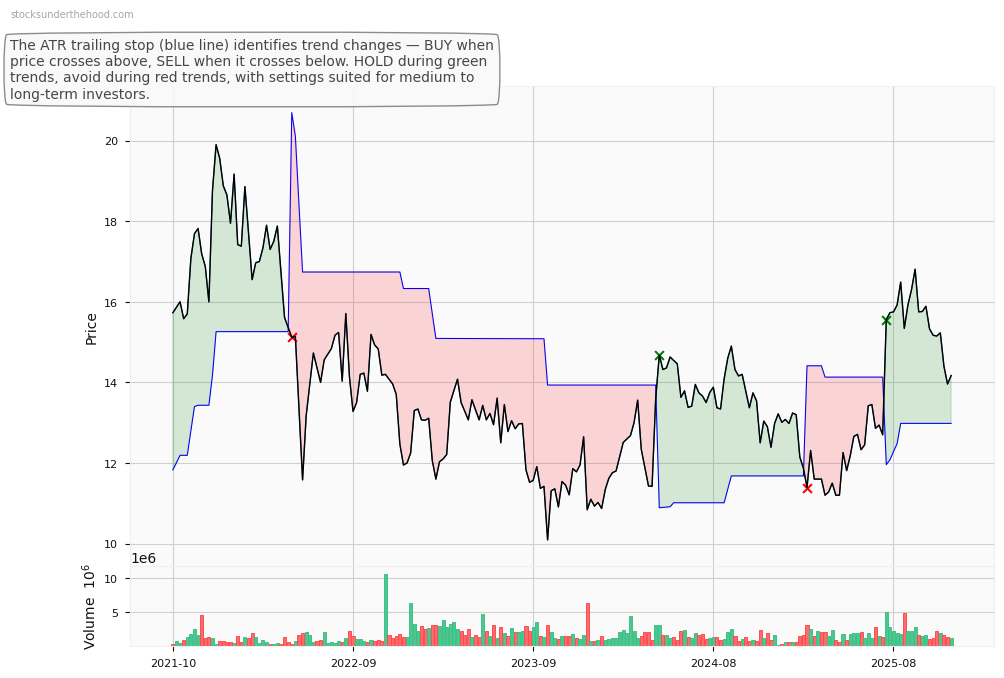
PXA Weekly Price Chart with Average True Range (ATR) Trailing Stop (10-Year View)
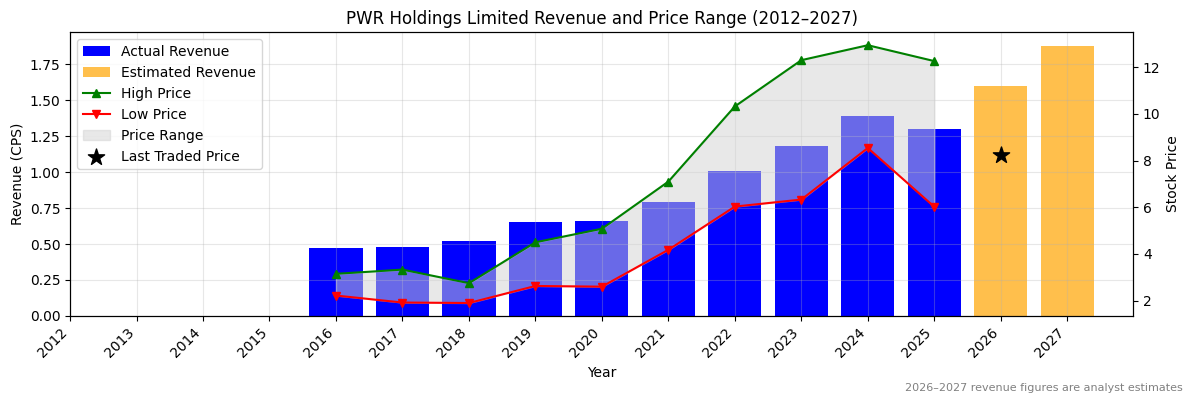
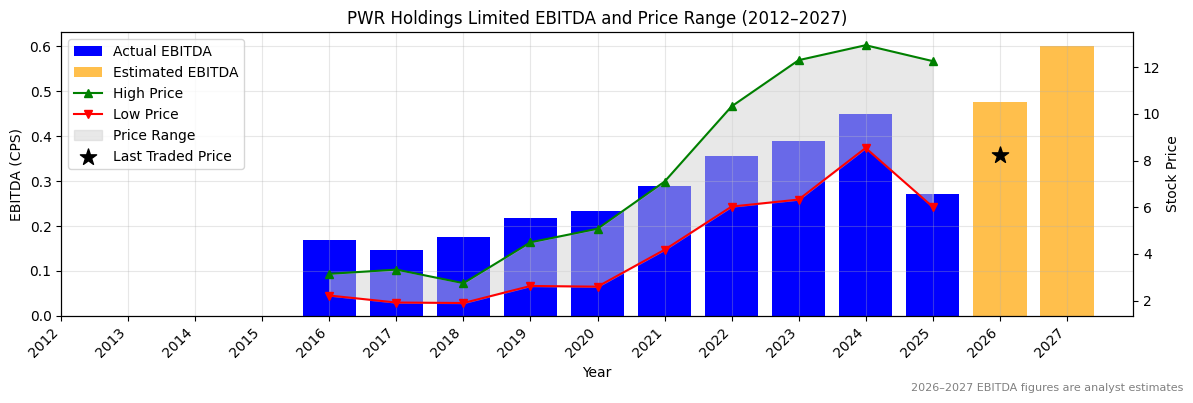
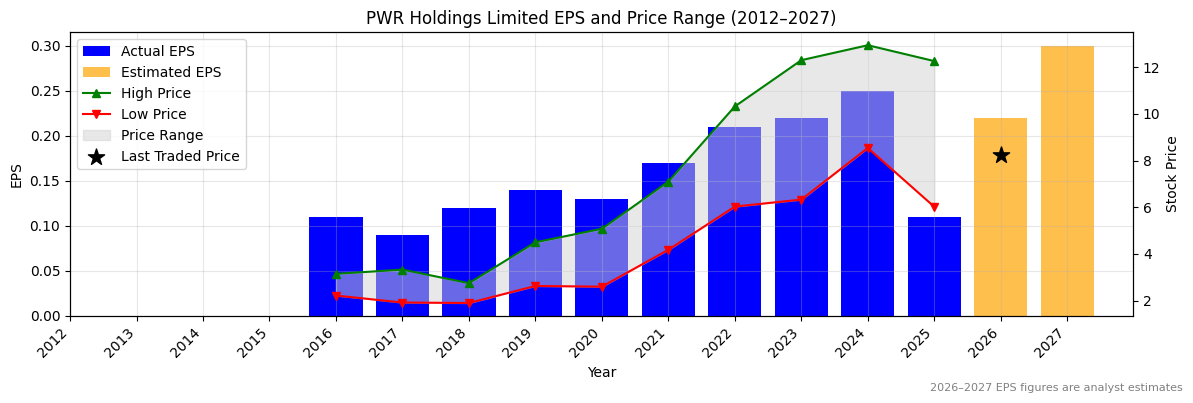
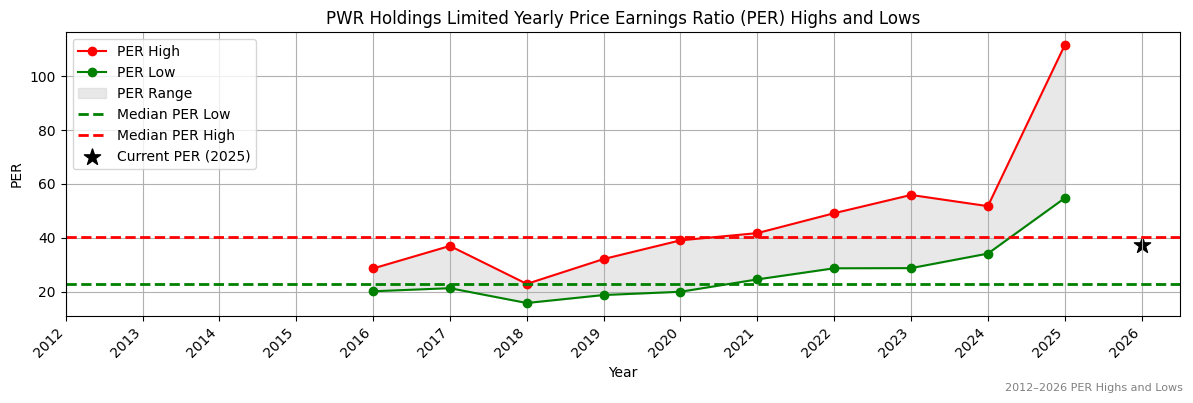
Ticker code: PWH
PWH Red Flags & Risk Indicators
❌
⚠️ RED FLAGS: 5 identified
- Highly Shorted
- Increasing Shorts
- Falling Earnings
- Falling Revenues
- Falling EBITDA Margins
Income Statement
| Revenue 2024 Per Share |
Revenue 2025e Per Share |
Revenue 2026e Per Share |
Revenue 24 to 25e [%] |
Revenue 25e to 26e [%] |
EBITDA 2024 Per Share |
EBITDA 2025e Per Share |
EBITDA 2026e Per Share |
EBITDA 24 to 25e [%] |
EBITDA 25e to 26e [%] |
| 1.38724 |
1.30324 |
1.59653 |
-6.1 |
22.5 |
0.4497 |
0.2708 |
0.47676 |
-39.8 |
76.1 |
PWH Revenue Per Share (2012–2027)
❌
PWH Earnings before Interest, Tax, Depreciation and Amortisation (EBITDA) Per Share (2012–2027)
❌
PWH Normalised Earnings Per Share (EPS) (2012–2027)
❌
Valuation
| Price To Sales |
Price To Book |
PER 2023 |
PER 2024 |
13Y Median PER Low |
PER 2025e |
13Y Median PER High |
PER 2026e |
Last Updated |
| 6.6 |
8.5 |
38.7 |
34.1 |
23.0 |
77.5 |
40.4 |
38.7 |
27/7/25 |
PWH Yearly Price Earnings Ratio (PER) Highs and Lows
❌
PWH Weekly Price Chart with Average True Range (ATR) Trailing Stop (10-Year View)
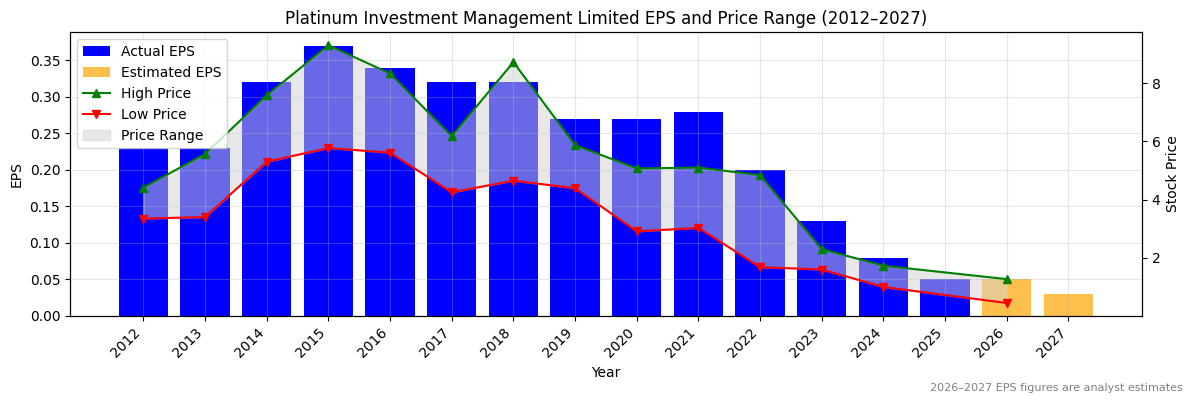
Ticker code: PTM
PTM Red Flags & Risk Indicators
⚠️
⚠️ RED FLAGS: 2 identified
- Falling Earnings
- Falling Revenues
Income Statement
| Revenue 2024 Per Share |
Revenue 2025e Per Share |
Revenue 2026e Per Share |
Revenue 24 to 25e [%] |
Revenue 25e to 26e [%] |
EBITDA 2024 Per Share |
EBITDA 2025e Per Share |
EBITDA 2026e Per Share |
EBITDA 24 to 25e [%] |
EBITDA 25e to 26e [%] |
| 0.29947 |
0.24033 |
0.05706 |
-19.7 |
-76.3 |
0.13979 |
0.11584 |
None |
-17.1 |
None |
PTM Revenue Per Share (2012–2027)
❌
PTM Earnings before Interest, Tax, Depreciation and Amortisation (EBITDA) Per Share (2012–2027)
❌
PTM Normalised Earnings Per Share (EPS) (2012–2027)
❌
Valuation
| Price To Sales |
Price To Book |
PER 2023 |
PER 2024 |
13Y Median PER Low |
PER 2025e |
13Y Median PER High |
PER 2026e |
Last Updated |
| 11.0 |
1.8 |
None |
None |
13.9 |
None |
22.7 |
None |
16/6/24 |
PTM Yearly Price Earnings Ratio (PER) Highs and Lows
PTM Weekly Price Chart with Average True Range (ATR) Trailing Stop (10-Year View)
Ticker code: PSQ
PSQ Red Flags & Risk Indicators
⚠️
⚠️ RED FLAGS: 1 identified
Income Statement
| Revenue 2024 Per Share |
Revenue 2025e Per Share |
Revenue 2026e Per Share |
Revenue 24 to 25e [%] |
Revenue 25e to 26e [%] |
EBITDA 2024 Per Share |
EBITDA 2025e Per Share |
EBITDA 2026e Per Share |
EBITDA 24 to 25e [%] |
EBITDA 25e to 26e [%] |
| 1.12981 |
None |
None |
None |
None |
0.17496 |
0.19558 |
None |
11.8 |
None |
PSQ Revenue Per Share (2012–2027)
PSQ Earnings before Interest, Tax, Depreciation and Amortisation (EBITDA) Per Share (2012–2027)
✅
PSQ Normalised Earnings Per Share (EPS) (2012–2027)
✅✅
Valuation
| Price To Sales |
Price To Book |
PER 2023 |
PER 2024 |
13Y Median PER Low |
PER 2025e |
13Y Median PER High |
PER 2026e |
Last Updated |
| 1.8 |
5.9 |
72.7 |
36.3 |
23.0 |
27.3 |
33.2 |
27.3 |
25/4/24 |
PSQ Yearly Price Earnings Ratio (PER) Highs and Lows
✅
PSQ Weekly Price Chart with Average True Range (ATR) Trailing Stop (10-Year View)
Ticker code: PRU
PRU Red Flags & Risk Indicators
⚠️
⚠️ RED FLAGS: 1 identified
Income Statement
| Revenue 2024 Per Share |
Revenue 2025e Per Share |
Revenue 2026e Per Share |
Revenue 24 to 25e [%] |
Revenue 25e to 26e [%] |
EBITDA 2024 Per Share |
EBITDA 2025e Per Share |
EBITDA 2026e Per Share |
EBITDA 24 to 25e [%] |
EBITDA 25e to 26e [%] |
| 1.10163 |
1.36427 |
1.36494 |
23.8 |
0.0 |
0.67146 |
0.84076 |
0.84773 |
25.2 |
0.8 |
PRU Revenue Per Share (2012–2027)
✅✅
PRU Earnings before Interest, Tax, Depreciation and Amortisation (EBITDA) Per Share (2012–2027)
✅✅
PRU Normalised Earnings Per Share (EPS) (2012–2027)
✅✅
Valuation
| Price To Sales |
Price To Book |
PER 2023 |
PER 2024 |
13Y Median PER Low |
PER 2025e |
13Y Median PER High |
PER 2026e |
Last Updated |
| 5.3 |
3.3 |
15.7 |
25.6 |
7.2 |
12.8 |
13.5 |
12.5 |
4/10/25 |
PRU Yearly Price Earnings Ratio (PER) Highs and Lows
✅
PRU Weekly Price Chart with Average True Range (ATR) Trailing Stop (10-Year View)
Ticker code: PRO
PRO Red Flags & Risk Indicators
❌
⚠️ RED FLAGS: 3 identified
- Falling Earnings
- High Price to Book vs ROE
- High Relative Valuation
Income Statement
| Revenue 2024 Per Share |
Revenue 2025e Per Share |
Revenue 2026e Per Share |
Revenue 24 to 25e [%] |
Revenue 25e to 26e [%] |
EBITDA 2024 Per Share |
EBITDA 2025e Per Share |
EBITDA 2026e Per Share |
EBITDA 24 to 25e [%] |
EBITDA 25e to 26e [%] |
| 0.31505 |
None |
None |
None |
None |
-0.05237 |
None |
None |
None |
None |
PRO Revenue Per Share (2012–2027)
PRO Earnings before Interest, Tax, Depreciation and Amortisation (EBITDA) Per Share (2012–2027)
PRO Normalised Earnings Per Share (EPS) (2012–2027)
Valuation
| Price To Sales |
Price To Book |
PER 2023 |
PER 2024 |
13Y Median PER Low |
PER 2025e |
13Y Median PER High |
PER 2026e |
Last Updated |
| 0.6 |
9.0 |
None |
None |
12.5 |
None |
32.0 |
None |
9/4/24 |
PRO Yearly Price Earnings Ratio (PER) Highs and Lows
PRO Weekly Price Chart with Average True Range (ATR) Trailing Stop (10-Year View)