Ticker code: PRN
PRN Red Flags & Risk Indicators
⚠️
⚠️ RED FLAGS: 2 identified
- Increasing Shorts
- High Relative Valuation
Income Statement
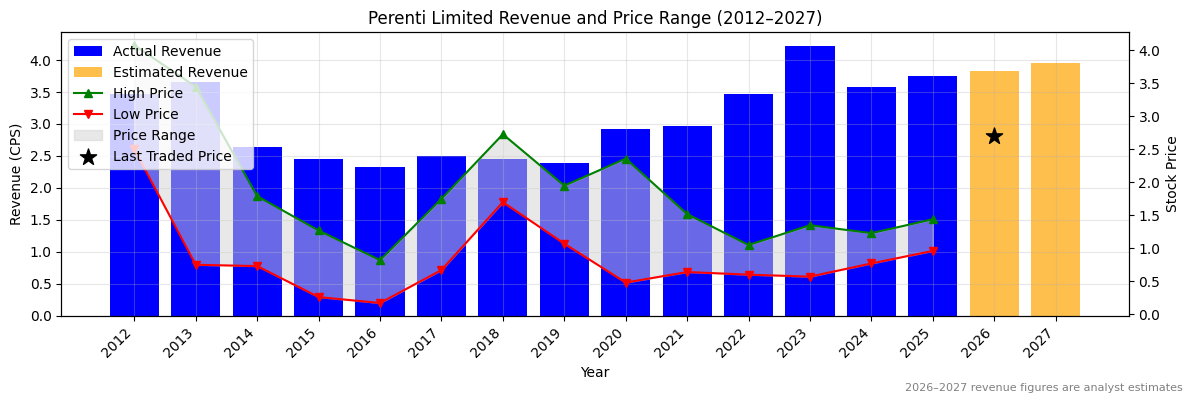
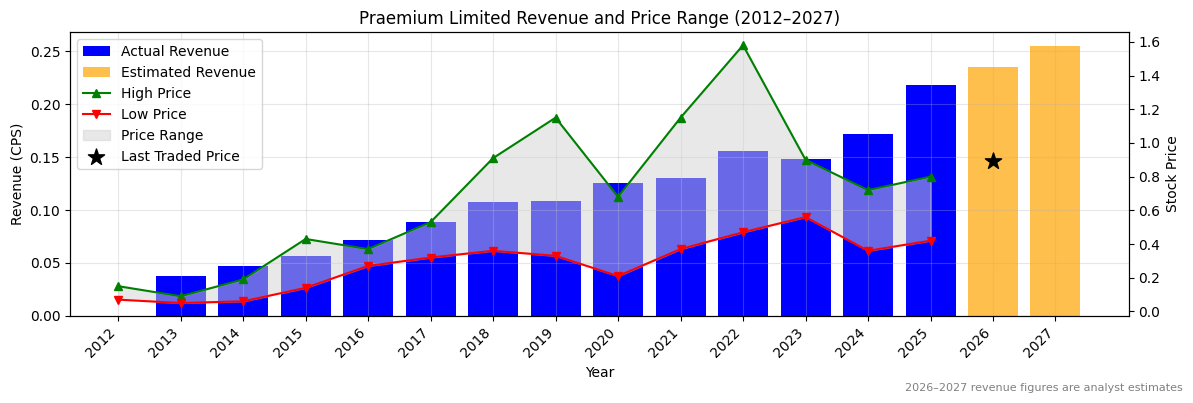
| Revenue 2024 Per Share |
Revenue 2025e Per Share |
Revenue 2026e Per Share |
Revenue 24 to 25e [%] |
Revenue 25e to 26e [%] |
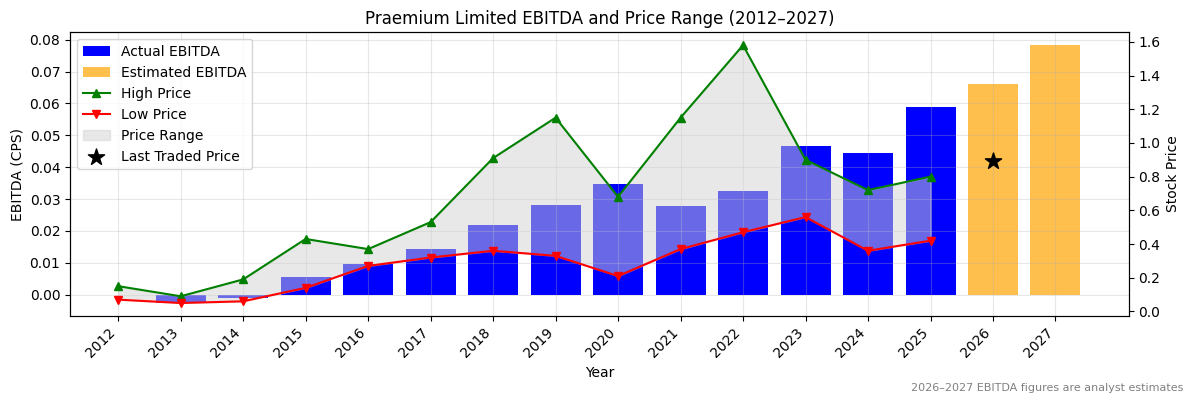
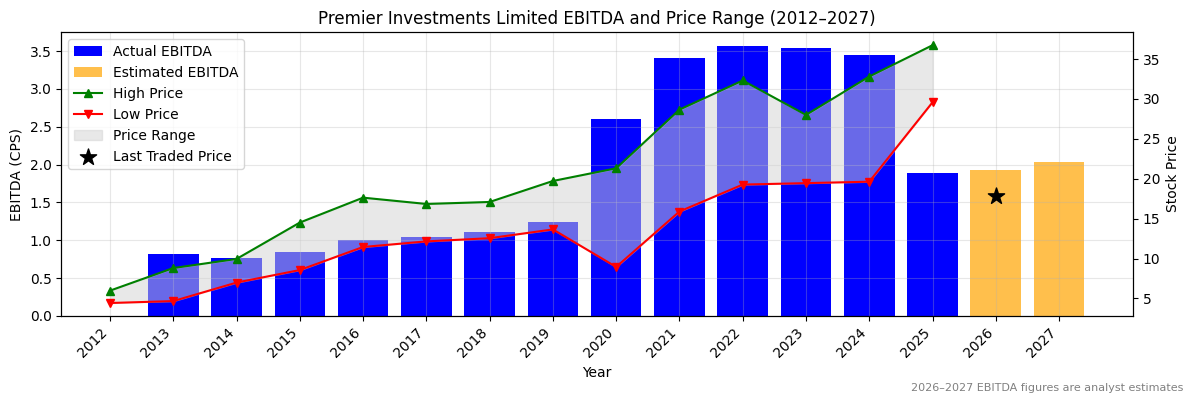
EBITDA 2024 Per Share |
EBITDA 2025e Per Share |
EBITDA 2026e Per Share |
EBITDA 24 to 25e [%] |
EBITDA 25e to 26e [%] |
| 3.58276 |
3.75063 |
3.82265 |
4.7 |
1.9 |
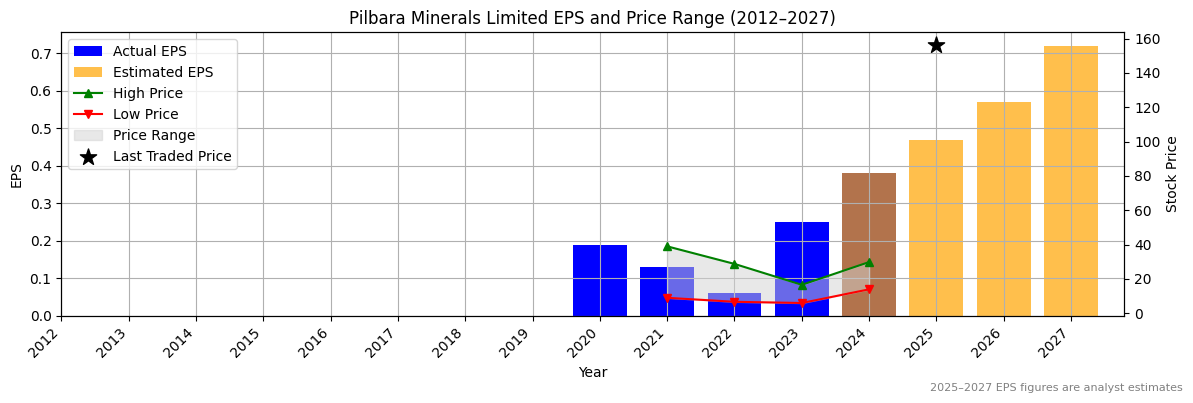
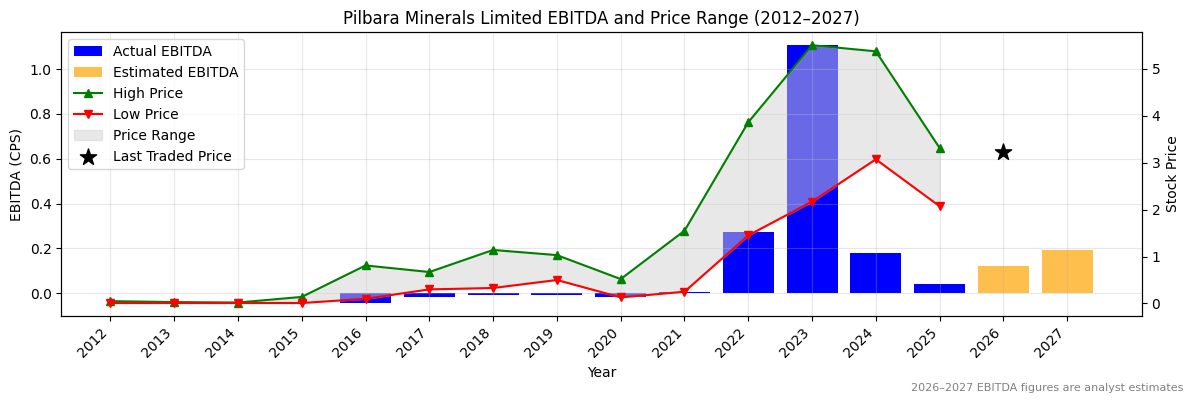
0.69104 |
0.71987 |
0.7357 |
4.2 |
2.2 |
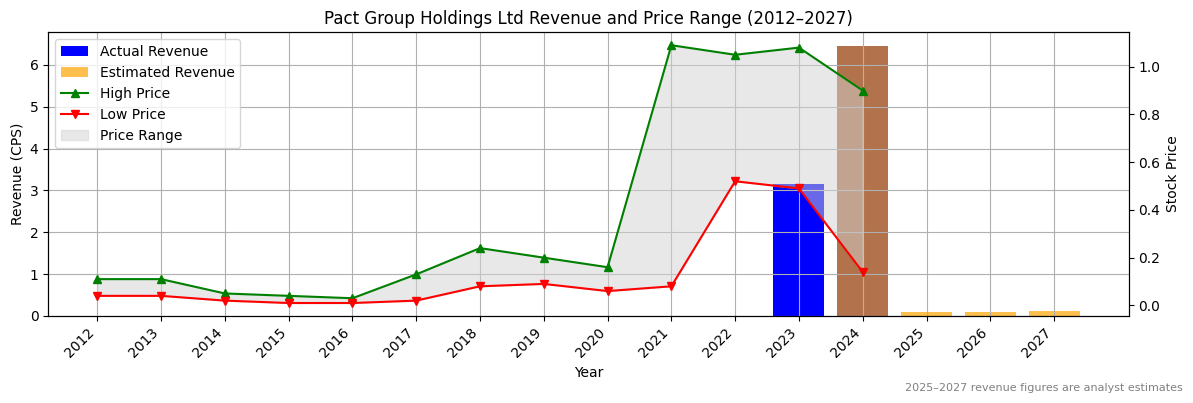
PRN Revenue Per Share (2012–2027)
✅
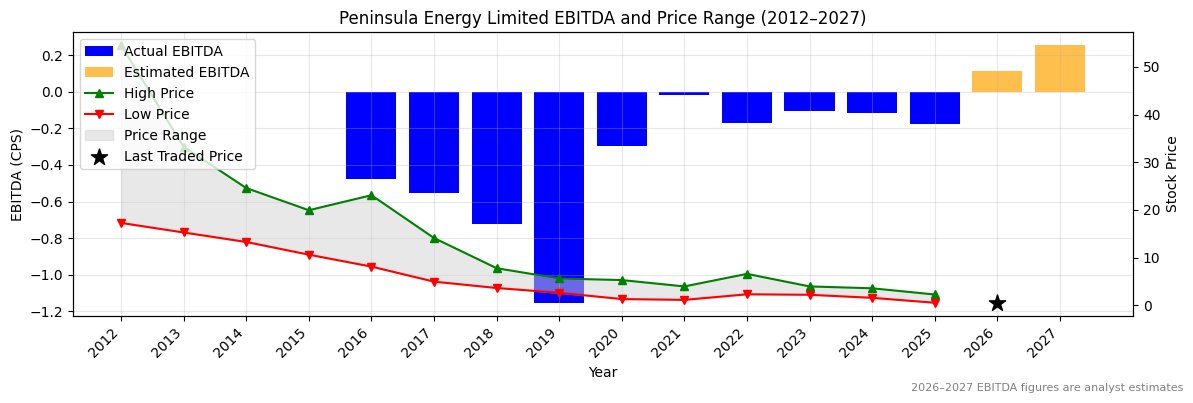
PRN Earnings before Interest, Tax, Depreciation and Amortisation (EBITDA) Per Share (2012–2027)
✅
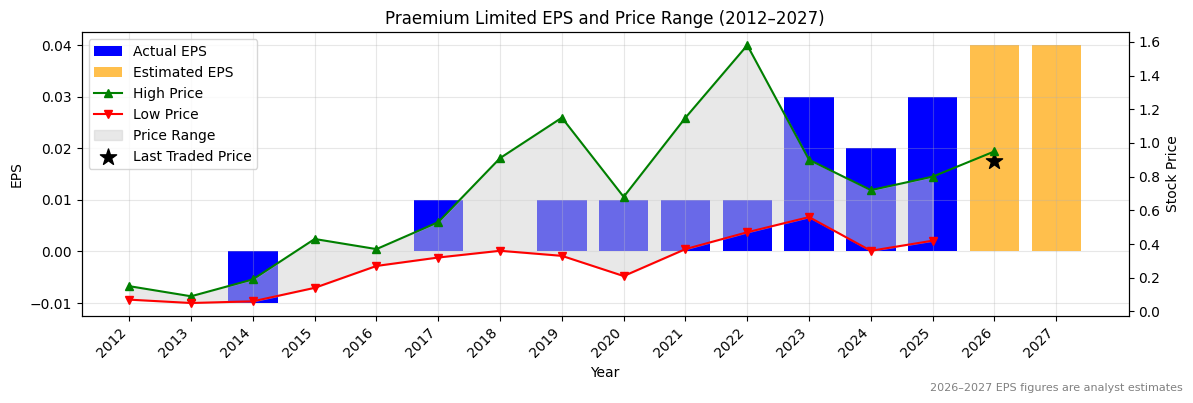
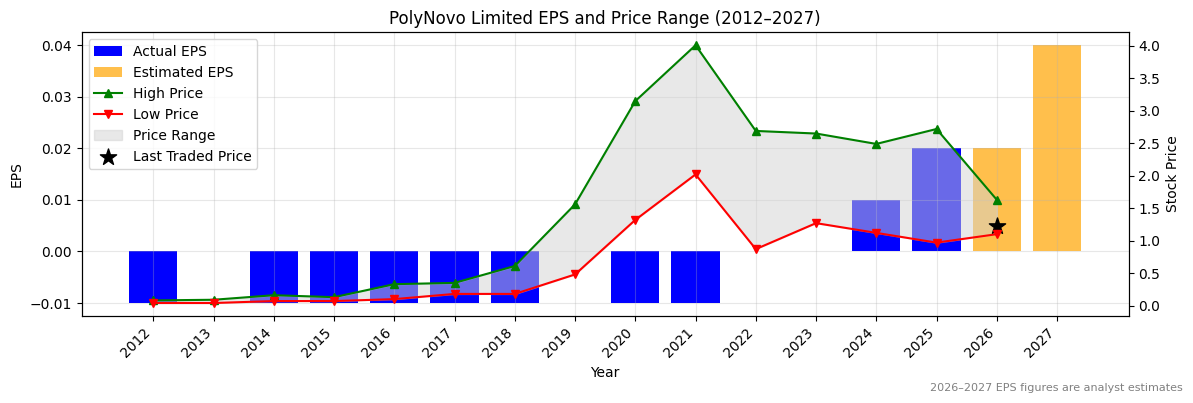
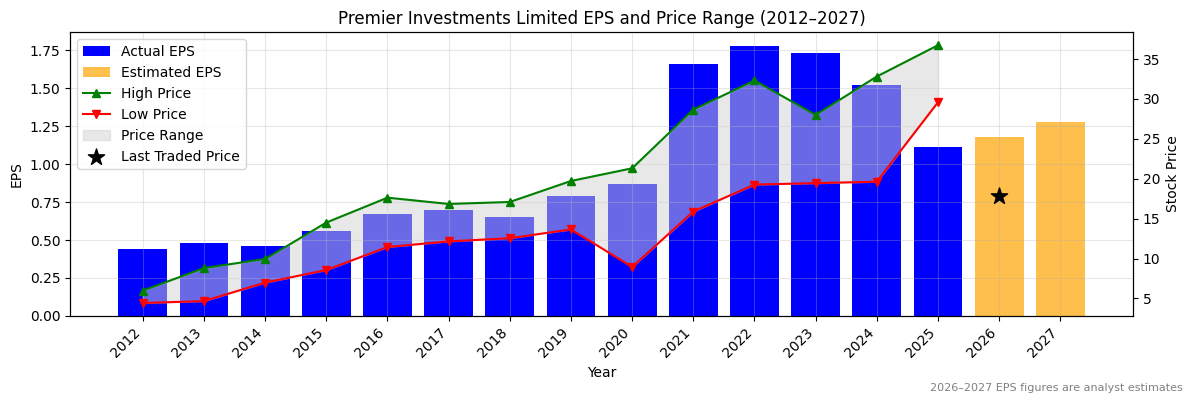
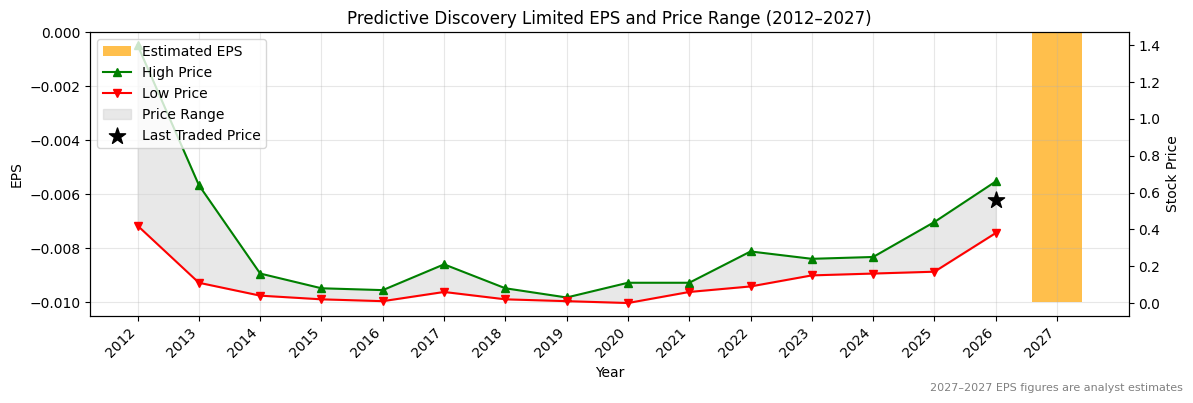
PRN Normalised Earnings Per Share (EPS) (2012–2027)
✅
Valuation
| Price To Sales |
Price To Book |
PER 2023 |
PER 2024 |
13Y Median PER Low |
PER 2025e |
13Y Median PER High |
PER 2026e |
Last Updated |
| 0.7 |
1.4 |
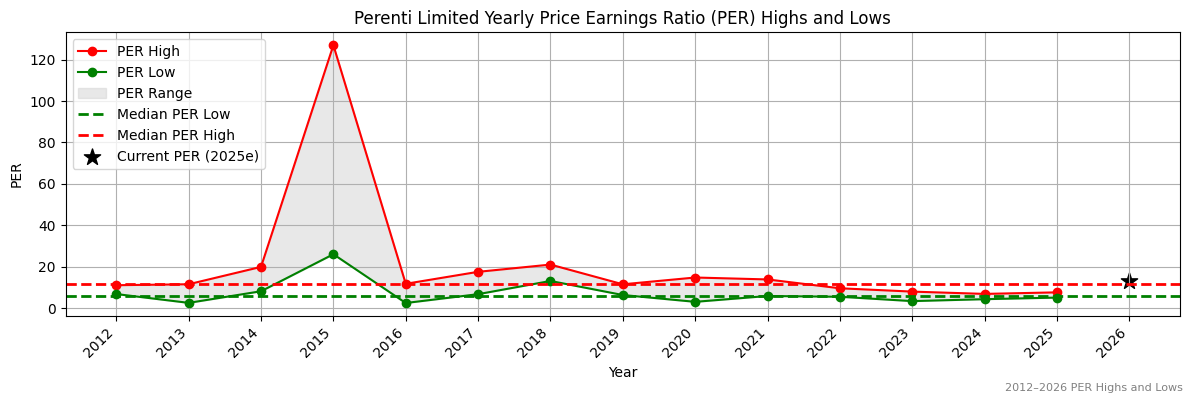
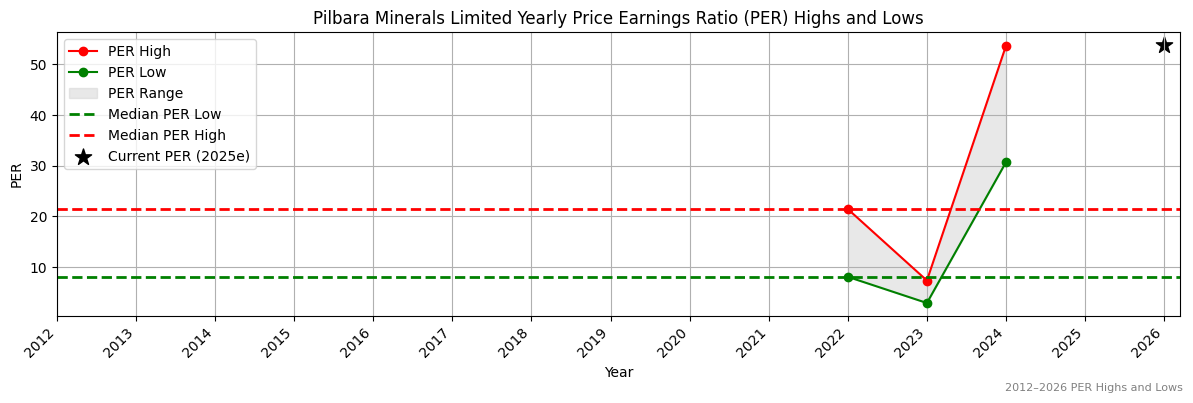
15.9 |
15.1 |
5.6 |
14.3 |
11.7 |
12.9 |
10/10/25 |
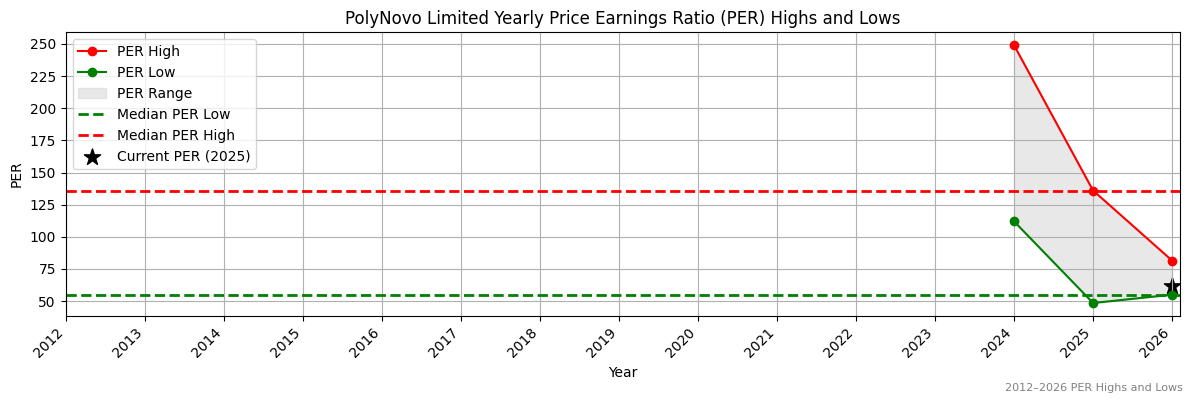
PRN Yearly Price Earnings Ratio (PER) Highs and Lows
❌
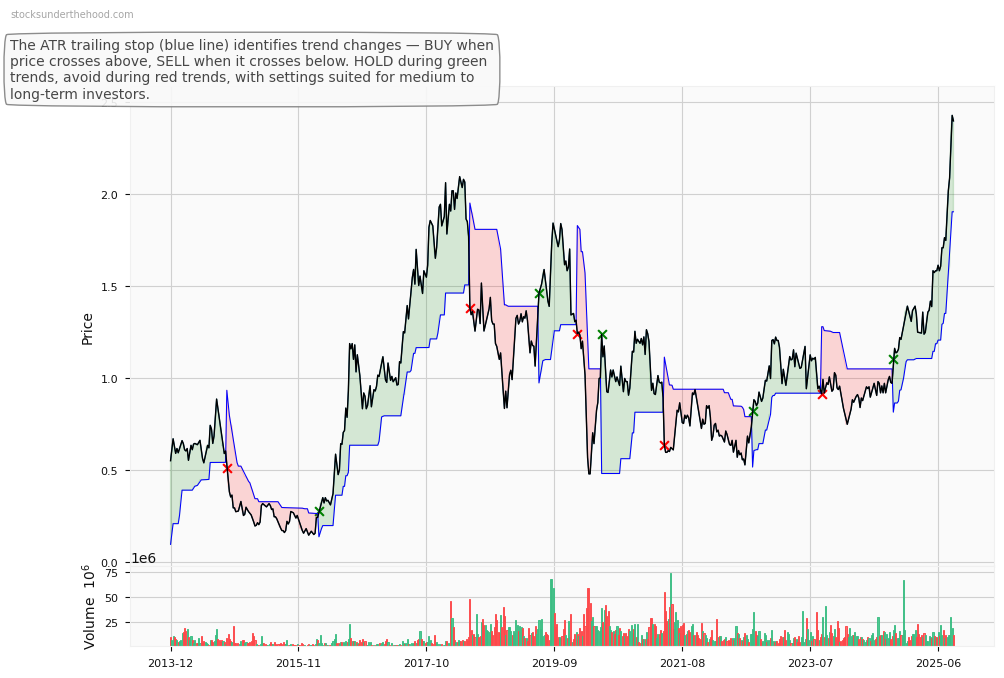
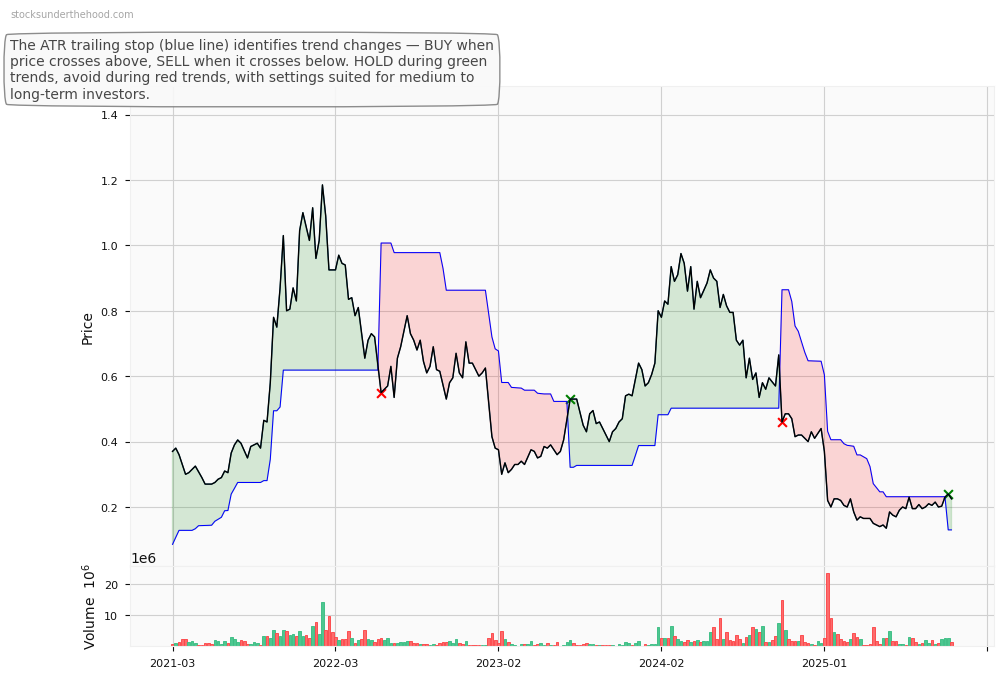
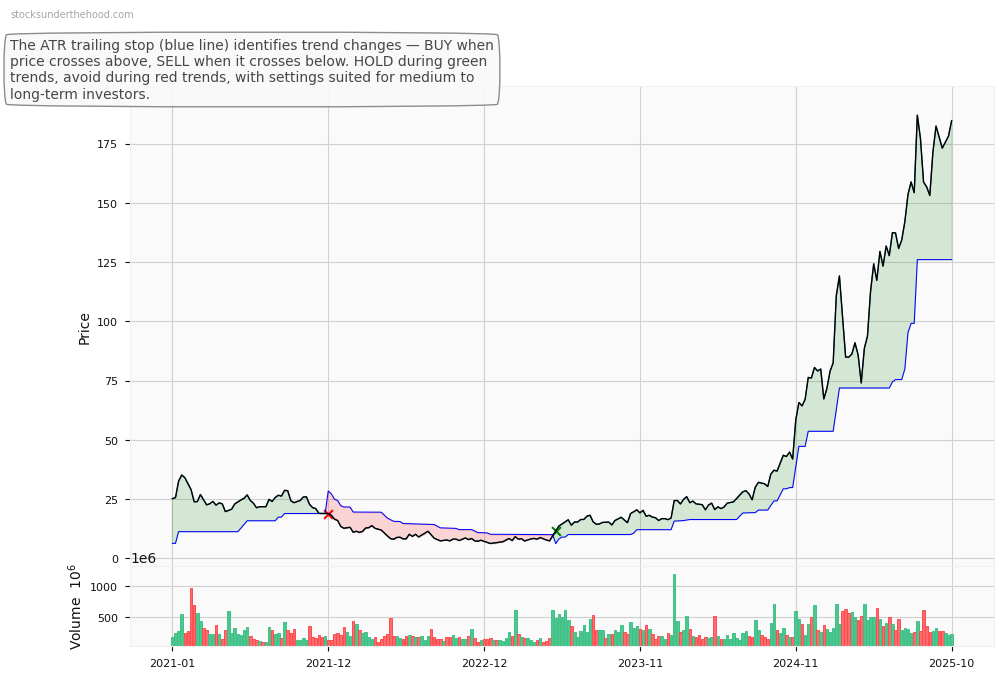
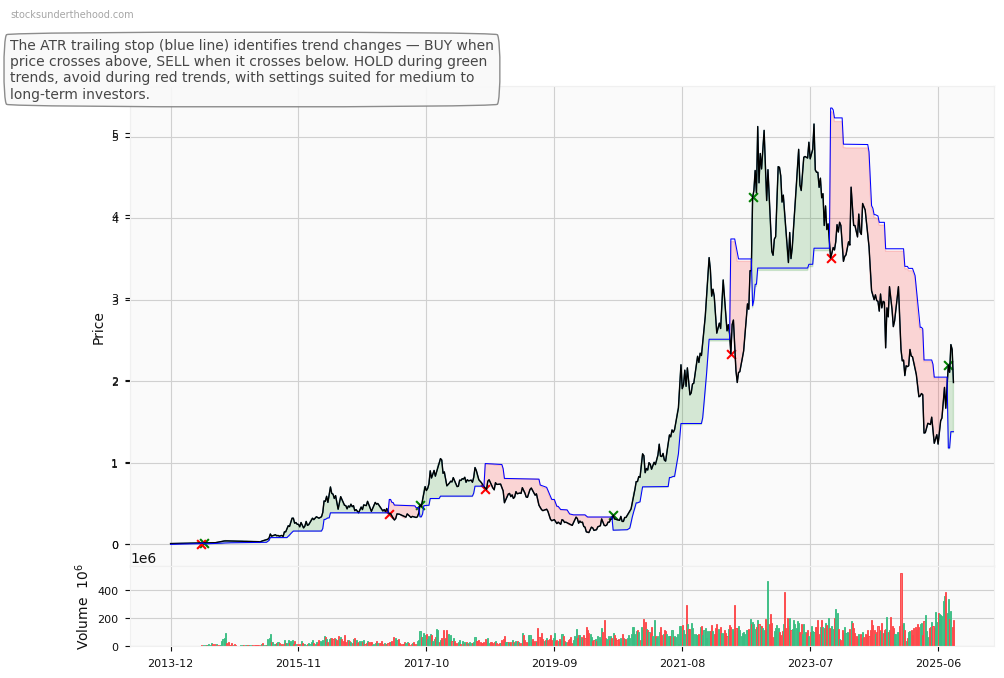
PRN Weekly Price Chart with Average True Range (ATR) Trailing Stop (10-Year View)
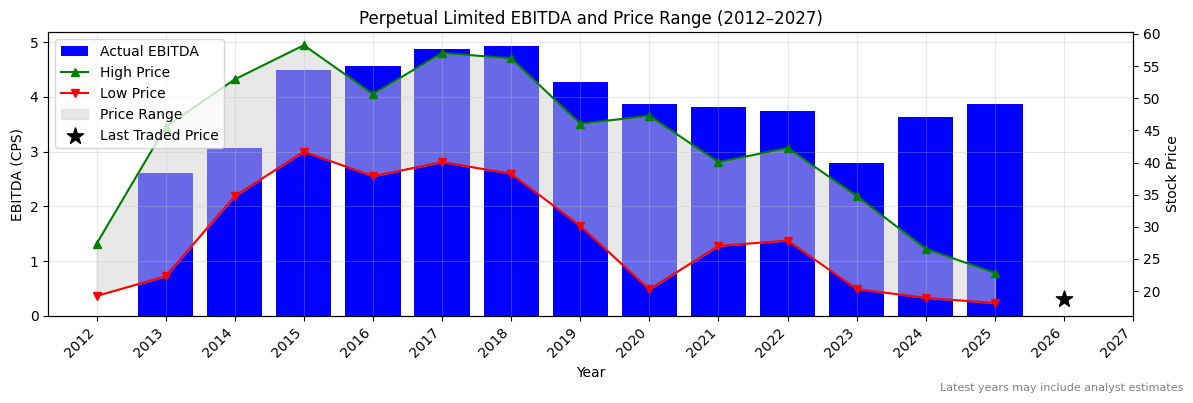
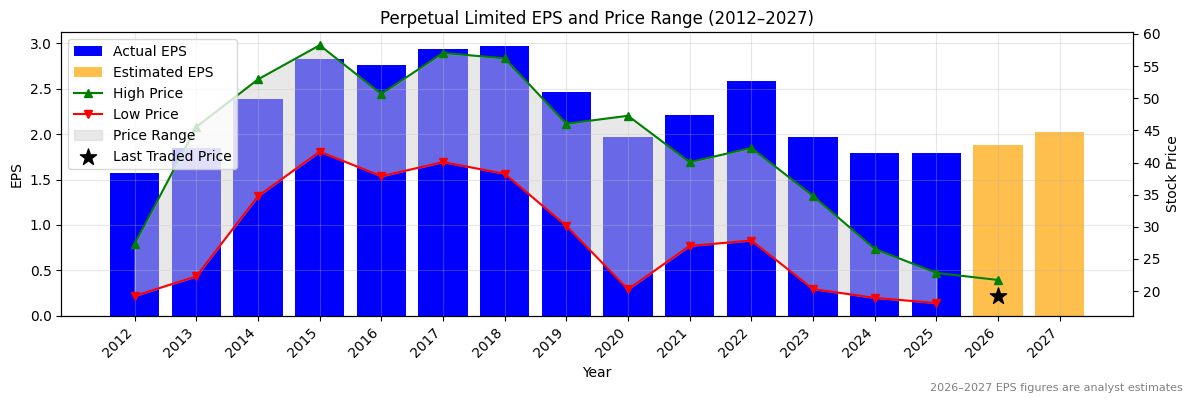
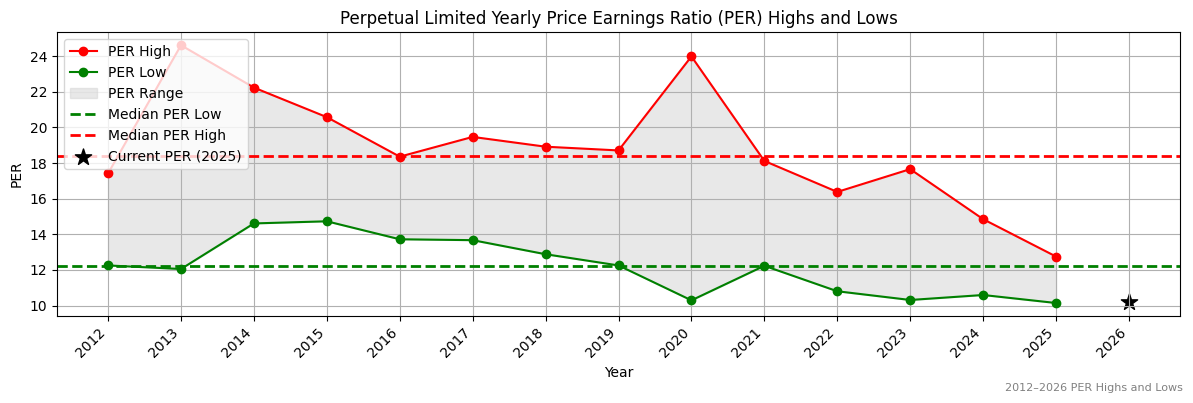
Ticker code: PPT
PPT Red Flags & Risk Indicators
❌
⚠️ RED FLAGS: 3 identified
- Low Operating Margin
- Increasing Shorts
- Falling Earnings
Income Statement
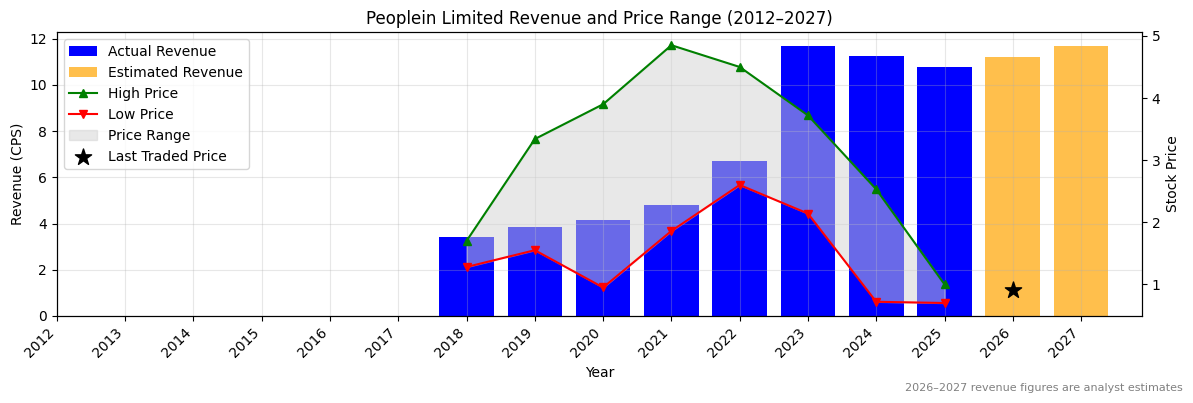
| Revenue 2024 Per Share |
Revenue 2025e Per Share |
Revenue 2026e Per Share |
Revenue 24 to 25e [%] |
Revenue 25e to 26e [%] |
EBITDA 2024 Per Share |
EBITDA 2025e Per Share |
EBITDA 2026e Per Share |
EBITDA 24 to 25e [%] |
EBITDA 25e to 26e [%] |
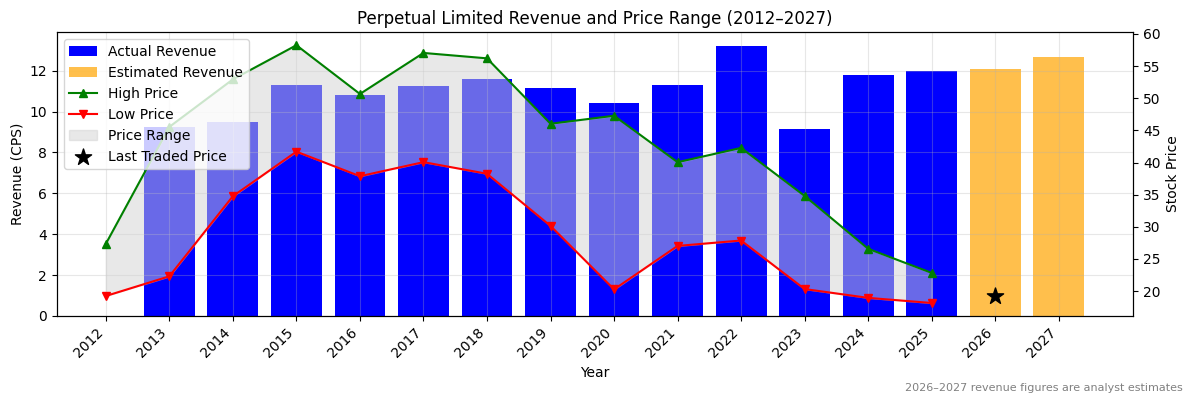
| 11.7689 |
12.0175 |
12.11586 |
2.1 |
0.8 |
3.63796 |
3.86522 |
None |
6.2 |
None |
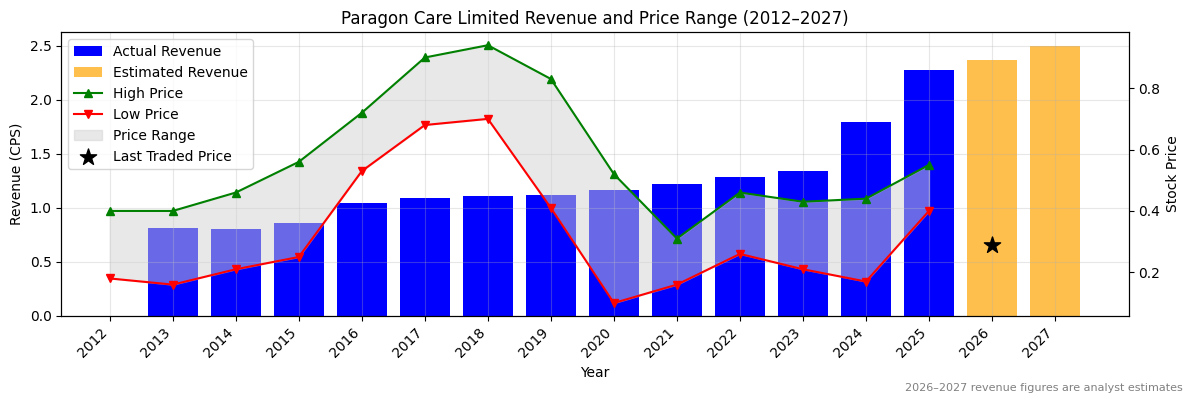
PPT Revenue Per Share (2012–2027)
✅
PPT Earnings before Interest, Tax, Depreciation and Amortisation (EBITDA) Per Share (2012–2027)
✅
PPT Normalised Earnings Per Share (EPS) (2012–2027)
❌
Valuation
| Price To Sales |
Price To Book |
PER 2023 |
PER 2024 |
13Y Median PER Low |
PER 2025e |
13Y Median PER High |
PER 2026e |
Last Updated |
| 1.6 |
1.3 |
9.7 |
10.7 |
12.2 |
10.7 |
18.4 |
10.2 |
4/4/24 |
PPT Yearly Price Earnings Ratio (PER) Highs and Lows
✅✅
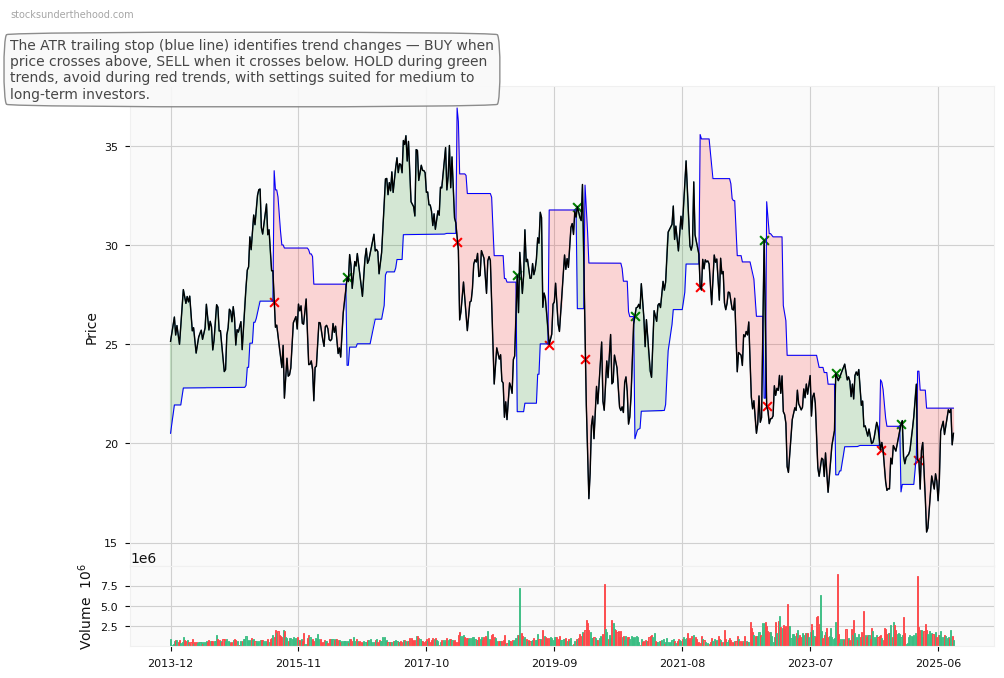
PPT Weekly Price Chart with Average True Range (ATR) Trailing Stop (10-Year View)
Ticker code: PPS
PPS Red Flags & Risk Indicators
✅
⚠️ RED FLAGS: 0 identified
No red flags detected.
Income Statement
| Revenue 2024 Per Share |
Revenue 2025e Per Share |
Revenue 2026e Per Share |
Revenue 24 to 25e [%] |
Revenue 25e to 26e [%] |
EBITDA 2024 Per Share |
EBITDA 2025e Per Share |
EBITDA 2026e Per Share |
EBITDA 24 to 25e [%] |
EBITDA 25e to 26e [%] |
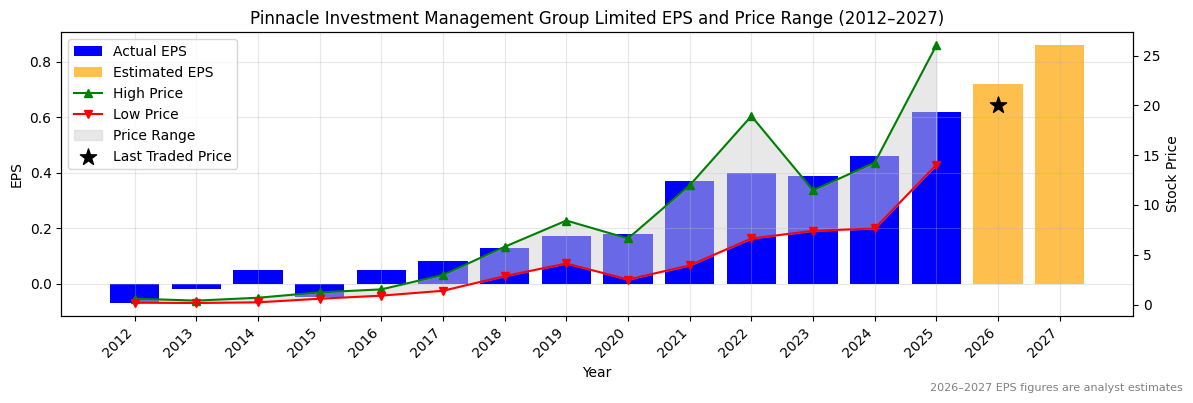
| 0.17163 |
0.21844 |
0.23508 |
27.3 |
7.6 |
0.0445 |
0.05874 |
0.06605 |
32.0 |
12.4 |
PPS Revenue Per Share (2012–2027)
✅✅
PPS Earnings before Interest, Tax, Depreciation and Amortisation (EBITDA) Per Share (2012–2027)
✅✅
PPS Normalised Earnings Per Share (EPS) (2012–2027)
✅✅
Valuation
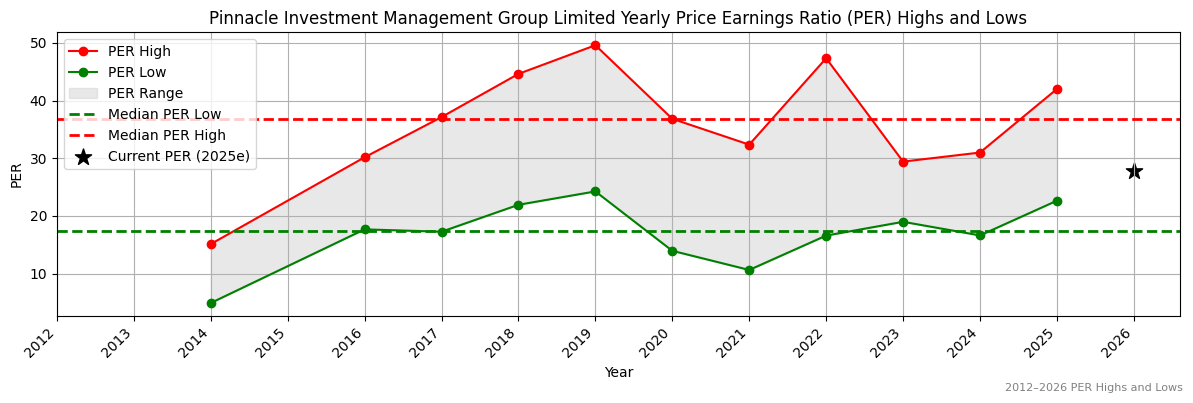
| Price To Sales |
Price To Book |
PER 2023 |
PER 2024 |
13Y Median PER Low |
PER 2025e |
13Y Median PER High |
PER 2026e |
Last Updated |
| 4.2 |
3.8 |
29.8 |
44.7 |
26.5 |
29.8 |
53.0 |
22.4 |
6/10/25 |
PPS Yearly Price Earnings Ratio (PER) Highs and Lows
✅
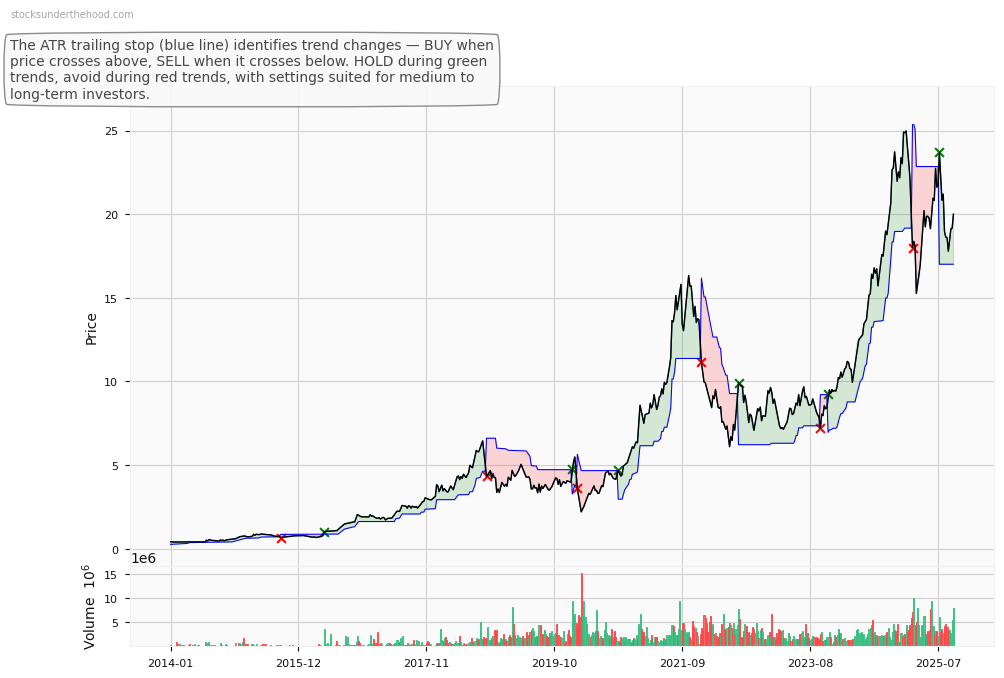
PPS Weekly Price Chart with Average True Range (ATR) Trailing Stop (10-Year View)
Ticker code: PPE
PPE Red Flags & Risk Indicators
⚠️
⚠️ RED FLAGS: 2 identified
- Increasing Shorts
- Falling Earnings
Income Statement
| Revenue 2024 Per Share |
Revenue 2025e Per Share |
Revenue 2026e Per Share |
Revenue 24 to 25e [%] |
Revenue 25e to 26e [%] |
EBITDA 2024 Per Share |
EBITDA 2025e Per Share |
EBITDA 2026e Per Share |
EBITDA 24 to 25e [%] |
EBITDA 25e to 26e [%] |
| 11.24586 |
10.76914 |
11.21616 |
-4.2 |
4.2 |
0.35381 |
0.3291 |
0.36352 |
-7.0 |
10.5 |
PPE Revenue Per Share (2012–2027)
❌
PPE Earnings before Interest, Tax, Depreciation and Amortisation (EBITDA) Per Share (2012–2027)
❌
PPE Normalised Earnings Per Share (EPS) (2012–2027)
❌
Valuation
| Price To Sales |
Price To Book |
PER 2023 |
PER 2024 |
13Y Median PER Low |
PER 2025e |
13Y Median PER High |
PER 2026e |
Last Updated |
| 0.1 |
0.6 |
2.3 |
4.0 |
8.0 |
10.6 |
13.4 |
7.0 |
20/12/24 |
PPE Yearly Price Earnings Ratio (PER) Highs and Lows
✅
PPE Weekly Price Chart with Average True Range (ATR) Trailing Stop (10-Year View)
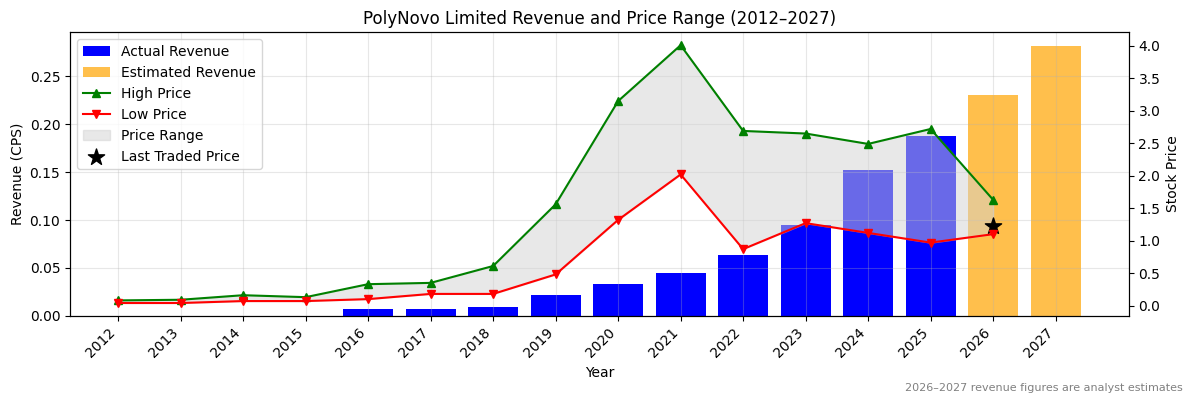
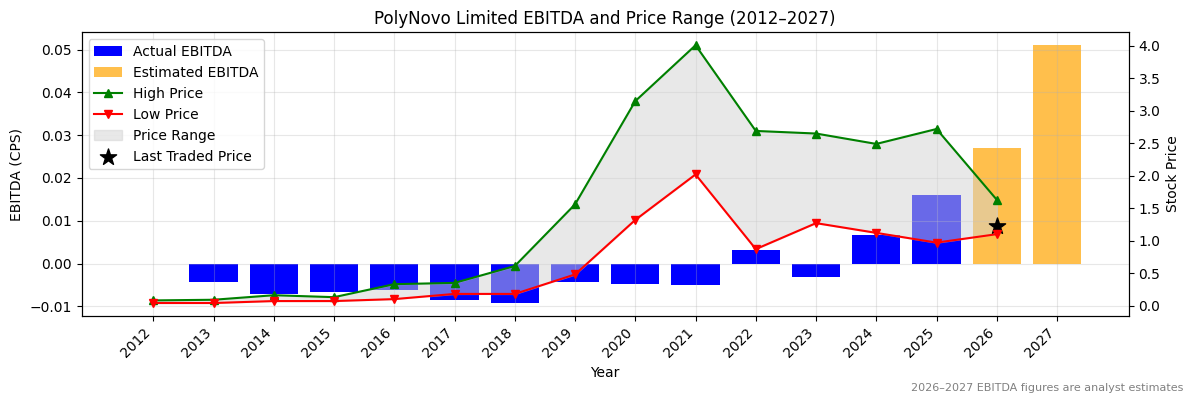
Ticker code: PNV
PNV Red Flags & Risk Indicators
❌
⚠️ RED FLAGS: 3 identified
- Low Operating Margin
- Highly Shorted
- Increasing Shorts
Income Statement
| Revenue 2024 Per Share |
Revenue 2025e Per Share |
Revenue 2026e Per Share |
Revenue 24 to 25e [%] |
Revenue 25e to 26e [%] |
EBITDA 2024 Per Share |
EBITDA 2025e Per Share |
EBITDA 2026e Per Share |
EBITDA 24 to 25e [%] |
EBITDA 25e to 26e [%] |
| 0.15177 |
0.18717 |
0.23028 |
23.3 |
23.0 |
0.00671 |
0.01608 |
0.02697 |
139.7 |
67.7 |
PNV Revenue Per Share (2012–2027)
✅✅
PNV Earnings before Interest, Tax, Depreciation and Amortisation (EBITDA) Per Share (2012–2027)
✅✅
PNV Normalised Earnings Per Share (EPS) (2012–2027)
✅✅
Valuation
| Price To Sales |
Price To Book |
PER 2023 |
PER 2024 |
13Y Median PER Low |
PER 2025e |
13Y Median PER High |
PER 2026e |
Last Updated |
| 7.1 |
10.9 |
None |
132.0 |
55.0 |
66.0 |
136.0 |
66.0 |
25/10/25 |
PNV Yearly Price Earnings Ratio (PER) Highs and Lows
✅
PNV Weekly Price Chart with Average True Range (ATR) Trailing Stop (10-Year View)
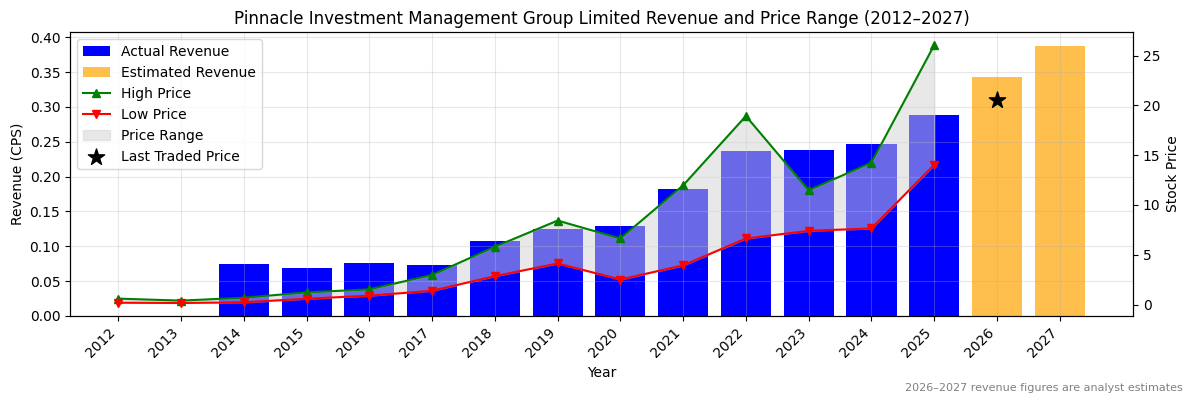
Ticker code: PNI
PNI Red Flags & Risk Indicators
⚠️
⚠️ RED FLAGS: 2 identified
- Low Operating Margin
- Increasing Shorts
Income Statement
| Revenue 2024 Per Share |
Revenue 2025e Per Share |
Revenue 2026e Per Share |
Revenue 24 to 25e [%] |
Revenue 25e to 26e [%] |
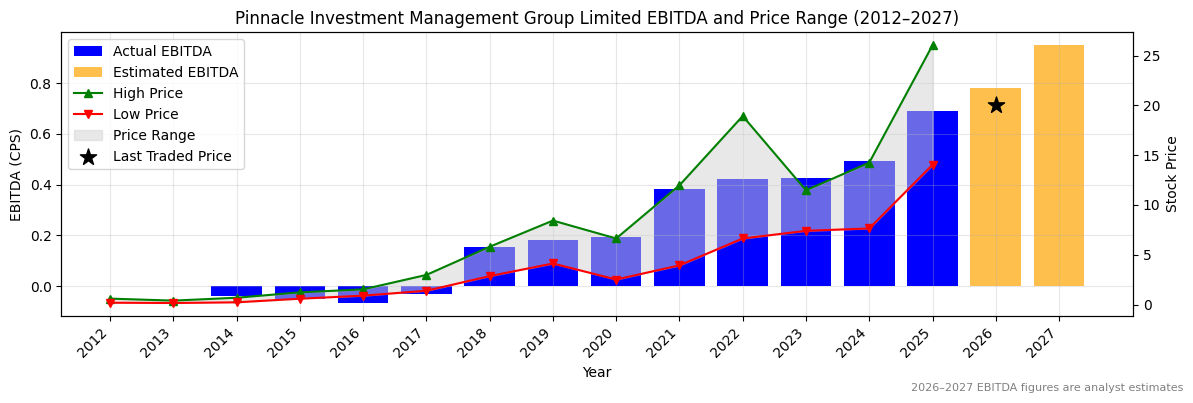
EBITDA 2024 Per Share |
EBITDA 2025e Per Share |
EBITDA 2026e Per Share |
EBITDA 24 to 25e [%] |
EBITDA 25e to 26e [%] |
| 0.24715 |
0.28893 |
0.34309 |
16.9 |
18.7 |
0.49367 |
0.68903 |
0.77878 |
39.6 |
13.0 |
PNI Revenue Per Share (2012–2027)
✅
PNI Earnings before Interest, Tax, Depreciation and Amortisation (EBITDA) Per Share (2012–2027)
✅✅
PNI Normalised Earnings Per Share (EPS) (2012–2027)
✅✅
Valuation
| Price To Sales |
Price To Book |
PER 2023 |
PER 2024 |
13Y Median PER Low |
PER 2025e |
13Y Median PER High |
PER 2026e |
Last Updated |
| 68.7 |
4.7 |
50.7 |
43.0 |
17.3 |
31.9 |
36.8 |
27.4 |
20/10/25 |
PNI Yearly Price Earnings Ratio (PER) Highs and Lows
✅
PNI Weekly Price Chart with Average True Range (ATR) Trailing Stop (10-Year View)
Ticker code: PMV
PMV Red Flags & Risk Indicators
❌
⚠️ RED FLAGS: 3 identified
- Falling Earnings
- Falling Revenues
- Falling EBITDA Margins
Income Statement
| Revenue 2024 Per Share |
Revenue 2025e Per Share |
Revenue 2026e Per Share |
Revenue 24 to 25e [%] |
Revenue 25e to 26e [%] |
EBITDA 2024 Per Share |
EBITDA 2025e Per Share |
EBITDA 2026e Per Share |
EBITDA 24 to 25e [%] |
EBITDA 25e to 26e [%] |
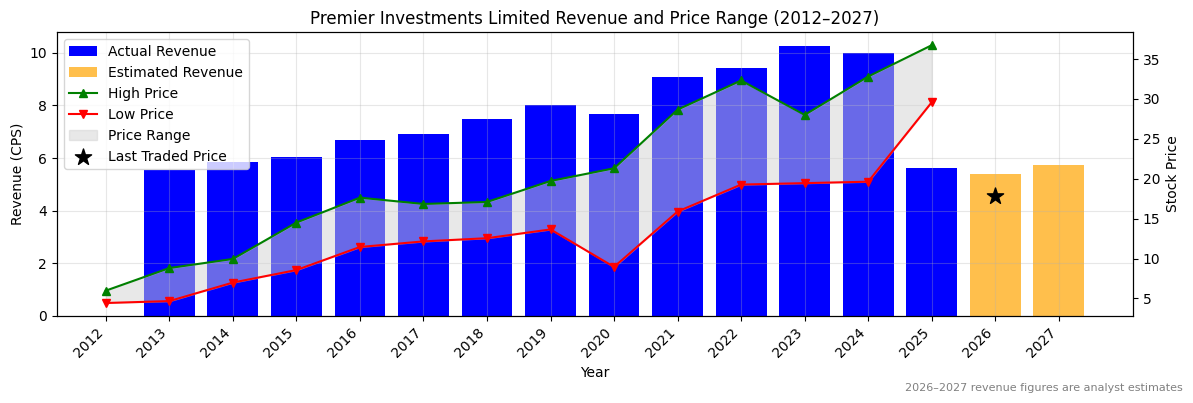
| 9.98954 |
5.63732 |
5.40155 |
-43.6 |
-4.2 |
3.4459 |
1.88748 |
1.93414 |
-45.2 |
2.5 |
PMV Revenue Per Share (2012–2027)
❌
PMV Earnings before Interest, Tax, Depreciation and Amortisation (EBITDA) Per Share (2012–2027)
❌
PMV Normalised Earnings Per Share (EPS) (2012–2027)
❌
Valuation
| Price To Sales |
Price To Book |
PER 2023 |
PER 2024 |
13Y Median PER Low |
PER 2025e |
13Y Median PER High |
PER 2026e |
Last Updated |
| 3.3 |
2.8 |
10.3 |
11.7 |
14.1 |
16.0 |
22.8 |
15.1 |
24/7/25 |
PMV Yearly Price Earnings Ratio (PER) Highs and Lows
✅
PMV Weekly Price Chart with Average True Range (ATR) Trailing Stop (10-Year View)
Ticker code: ASX:PMT
ASX:PMT Red Flags & Risk Indicators
❌
⚠️ RED FLAGS: 5 identified
- Negative Operating Cash Flow
- Large Share Issuance
- Highly Shorted
- Zero Revenue
- Falling Earnings
Income Statement
| Revenue 2024 Per Share |
Revenue 2025e Per Share |
Revenue 2026e Per Share |
Revenue 24 to 25e [%] |
Revenue 25e to 26e [%] |
EBITDA 2024 Per Share |
EBITDA 2025e Per Share |
EBITDA 2026e Per Share |
EBITDA 24 to 25e [%] |
EBITDA 25e to 26e [%] |
| None |
None |
None |
None |
None |
-0.01592 |
-0.0133 |
-0.01226 |
16.4 |
7.8 |
ASX:PMT Revenue Per Share (2012–2027)
ASX:PMT Earnings before Interest, Tax, Depreciation and Amortisation (EBITDA) Per Share (2012–2027)
✅
ASX:PMT Normalised Earnings Per Share (EPS) (2012–2027)
Valuation
| Price To Sales |
Price To Book |
PER 2023 |
PER 2024 |
13Y Median PER Low |
PER 2025e |
13Y Median PER High |
PER 2026e |
Last Updated |
| None |
0.2 |
None |
None |
None |
-11.2 |
None |
-11.2 |
27/11/24 |
ASX:PMT Yearly Price Earnings Ratio (PER) Highs and Lows
ASX:PMT Weekly Price Chart with Average True Range (ATR) Trailing Stop (10-Year View)
Ticker code: PME
PME Red Flags & Risk Indicators
⚠️
⚠️ RED FLAGS: 2 identified
- Increasing Shorts
- High Relative Valuation
Income Statement
| Revenue 2024 Per Share |
Revenue 2025e Per Share |
Revenue 2026e Per Share |
Revenue 24 to 25e [%] |
Revenue 25e to 26e [%] |
EBITDA 2024 Per Share |
EBITDA 2025e Per Share |
EBITDA 2026e Per Share |
EBITDA 24 to 25e [%] |
EBITDA 25e to 26e [%] |
| 1.54665 |
2.03965 |
2.73857 |
31.9 |
34.3 |
1.15093 |
1.55971 |
2.16207 |
35.5 |
38.6 |
PME Revenue Per Share (2012–2027)
✅✅
PME Earnings before Interest, Tax, Depreciation and Amortisation (EBITDA) Per Share (2012–2027)
✅✅
PME Normalised Earnings Per Share (EPS) (2012–2027)
✅✅
Valuation
| Price To Sales |
Price To Book |
PER 2023 |
PER 2024 |
13Y Median PER Low |
PER 2025e |
13Y Median PER High |
PER 2026e |
Last Updated |
| 129.4 |
107.2 |
454.5 |
346.9 |
70.7 |
241.8 |
137.6 |
173.4 |
4/10/25 |
PME Yearly Price Earnings Ratio (PER) Highs and Lows
❌
PME Weekly Price Chart with Average True Range (ATR) Trailing Stop (10-Year View)
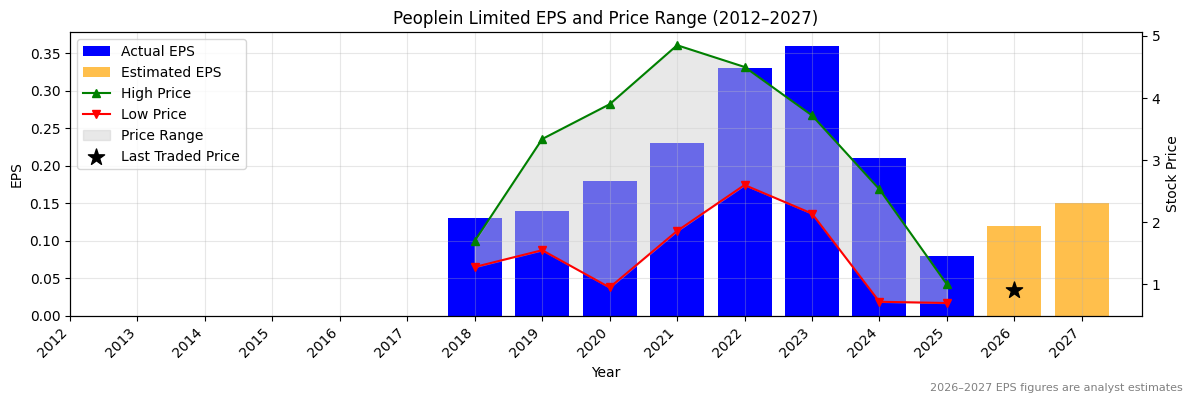
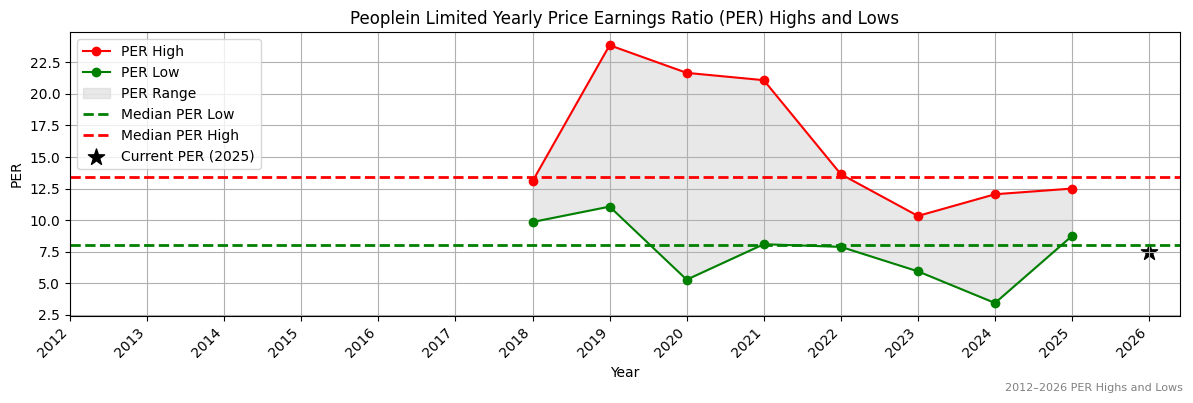
Ticker code: PLY
PLY Red Flags & Risk Indicators
❌
⚠️ RED FLAGS: 3 identified
- Falling Earnings
- Falling Revenues
- Falling EBITDA Margins
Income Statement
| Revenue 2024 Per Share |
Revenue 2025e Per Share |
Revenue 2026e Per Share |
Revenue 24 to 25e [%] |
Revenue 25e to 26e [%] |
EBITDA 2024 Per Share |
EBITDA 2025e Per Share |
EBITDA 2026e Per Share |
EBITDA 24 to 25e [%] |
EBITDA 25e to 26e [%] |
| 0.16721 |
0.15955 |
0.18304 |
-4.6 |
14.7 |
0.04275 |
-0.01827 |
0.01809 |
-142.7 |
199.0 |
PLY Revenue Per Share (2012–2027)
❌
PLY Earnings before Interest, Tax, Depreciation and Amortisation (EBITDA) Per Share (2012–2027)
❌
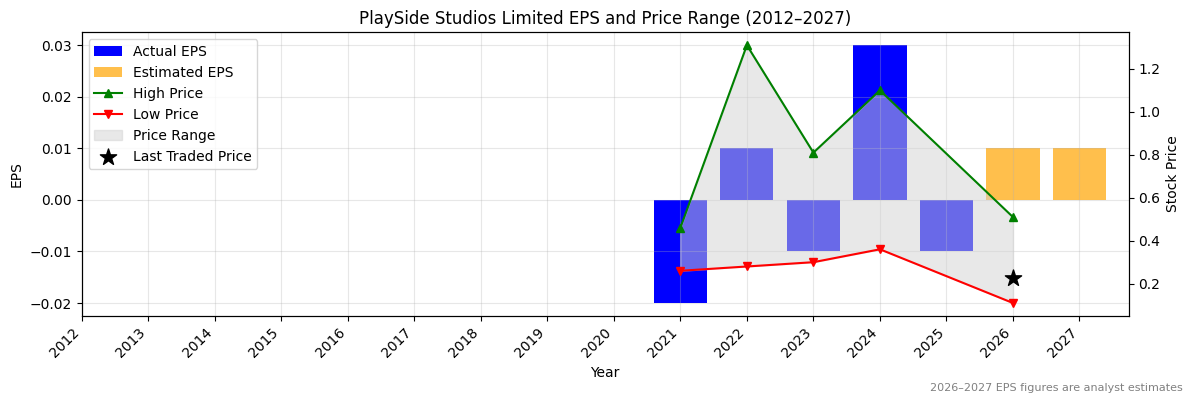
PLY Normalised Earnings Per Share (EPS) (2012–2027)
❌
Valuation
| Price To Sales |
Price To Book |
PER 2023 |
PER 2024 |
13Y Median PER Low |
PER 2025e |
13Y Median PER High |
PER 2026e |
Last Updated |
| 2.2 |
2.5 |
-24.0 |
8.0 |
12.0 |
-24.0 |
49.5 |
24.0 |
29/10/24 |
PLY Yearly Price Earnings Ratio (PER) Highs and Lows
✅✅
PLY Weekly Price Chart with Average True Range (ATR) Trailing Stop (10-Year View)
Ticker code: PLTR
PLTR Red Flags & Risk Indicators
⚠️
⚠️ RED FLAGS: 1 identified
Income Statement
| Revenue 2024 Per Share |
Revenue 2025e Per Share |
Revenue 2026e Per Share |
Revenue 24 to 25e [%] |
Revenue 25e to 26e [%] |
EBITDA 2024 Per Share |
EBITDA 2025e Per Share |
EBITDA 2026e Per Share |
EBITDA 24 to 25e [%] |
EBITDA 25e to 26e [%] |
| 1.22667 |
1.52631 |
1.85921 |
24.4 |
21.8 |
0.47637 |
0.60103 |
0.74422 |
26.2 |
23.8 |
PLTR Revenue Per Share (2012–2027)
✅✅
PLTR Earnings before Interest, Tax, Depreciation and Amortisation (EBITDA) Per Share (2012–2027)
✅✅
PLTR Normalised Earnings Per Share (EPS) (2012–2027)
✅✅
Valuation
| Price To Sales |
Price To Book |
PER 2023 |
PER 2024 |
13Y Median PER Low |
PER 2025e |
13Y Median PER High |
PER 2026e |
Last Updated |
| 134.1 |
77.8 |
778.2 |
512.0 |
69.5 |
413.9 |
300.0 |
341.3 |
21/4/25 |
PLTR Yearly Price Earnings Ratio (PER) Highs and Lows
❌
PLTR Weekly Price Chart with Average True Range (ATR) Trailing Stop (10-Year View)
Ticker code: PLS
PLS Red Flags & Risk Indicators
❌
⚠️ RED FLAGS: 6 identified
- Large Share Issuance
- Low Operating Margin
- Highly Shorted
- Falling Earnings
- High Relative Valuation
- Falling EBITDA Margins
Income Statement
| Revenue 2024 Per Share |
Revenue 2025e Per Share |
Revenue 2026e Per Share |
Revenue 24 to 25e [%] |
Revenue 25e to 26e [%] |
EBITDA 2024 Per Share |
EBITDA 2025e Per Share |
EBITDA 2026e Per Share |
EBITDA 24 to 25e [%] |
EBITDA 25e to 26e [%] |
| 0.41665 |
0.26506 |
0.40026 |
-36.4 |
51.0 |
0.17876 |
0.04007 |
0.12354 |
-77.6 |
208.3 |
PLS Revenue Per Share (2012–2027)
❌
PLS Earnings before Interest, Tax, Depreciation and Amortisation (EBITDA) Per Share (2012–2027)
❌
PLS Normalised Earnings Per Share (EPS) (2012–2027)
Valuation
| Price To Sales |
Price To Book |
PER 2023 |
PER 2024 |
13Y Median PER Low |
PER 2025e |
13Y Median PER High |
PER 2026e |
Last Updated |
| 13.8 |
3.0 |
4.4 |
33.0 |
8.1 |
None |
21.4 |
55.0 |
18/2/25 |
PLS Yearly Price Earnings Ratio (PER) Highs and Lows
PLS Weekly Price Chart with Average True Range (ATR) Trailing Stop (10-Year View)
Ticker code: ASX:PLS
ASX:PLS Red Flags & Risk Indicators
❌
⚠️ RED FLAGS: 7 identified
- Large Share Issuance
- Low Operating Margin
- Highly Shorted
- Increasing Shorts
- Falling Earnings
- High Relative Valuation
- Falling EBITDA Margins
Income Statement
| Revenue 2024 Per Share |
Revenue 2025e Per Share |
Revenue 2026e Per Share |
Revenue 24 to 25e [%] |
Revenue 25e to 26e [%] |
EBITDA 2024 Per Share |
EBITDA 2025e Per Share |
EBITDA 2026e Per Share |
EBITDA 24 to 25e [%] |
EBITDA 25e to 26e [%] |
| 0.41665 |
0.26509 |
0.4003 |
-36.4 |
51.0 |
0.17876 |
0.04007 |
0.12355 |
-77.6 |
208.4 |
ASX:PLS Revenue Per Share (2012–2027)
❌
ASX:PLS Earnings before Interest, Tax, Depreciation and Amortisation (EBITDA) Per Share (2012–2027)
❌
ASX:PLS Normalised Earnings Per Share (EPS) (2012–2027)
Valuation
| Price To Sales |
Price To Book |
PER 2023 |
PER 2024 |
13Y Median PER Low |
PER 2025e |
13Y Median PER High |
PER 2026e |
Last Updated |
| 9.1 |
2.0 |
2.9 |
21.7 |
8.1 |
None |
21.4 |
36.2 |
18/2/25 |
ASX:PLS Yearly Price Earnings Ratio (PER) Highs and Lows
ASX:PLS Weekly Price Chart with Average True Range (ATR) Trailing Stop (10-Year View)
Ticker code: ASX:PLL
ASX:PLL Red Flags & Risk Indicators
❌
⚠️ RED FLAGS: 4 identified
- Negative Operating Cash Flow
- Low Operating Margin
- Falling Revenues
- High Price to Book vs ROE
Income Statement
| Revenue 2024 Per Share |
Revenue 2025e Per Share |
Revenue 2026e Per Share |
Revenue 24 to 25e [%] |
Revenue 25e to 26e [%] |
EBITDA 2024 Per Share |
EBITDA 2025e Per Share |
EBITDA 2026e Per Share |
EBITDA 24 to 25e [%] |
EBITDA 25e to 26e [%] |
| 6.45596 |
0.08342 |
0.08951 |
-98.7 |
7.3 |
-2.65872 |
-0.01152 |
-0.00877 |
99.6 |
23.9 |
ASX:PLL Revenue Per Share (2012–2027)
❌
ASX:PLL Earnings before Interest, Tax, Depreciation and Amortisation (EBITDA) Per Share (2012–2027)
✅✅
ASX:PLL Normalised Earnings Per Share (EPS) (2012–2027)
❌
Valuation
| Price To Sales |
Price To Book |
PER 2023 |
PER 2024 |
13Y Median PER Low |
PER 2025e |
13Y Median PER High |
PER 2026e |
Last Updated |
| 2.9 |
1.1 |
None |
None |
None |
None |
None |
None |
19/11/24 |
ASX:PLL Yearly Price Earnings Ratio (PER) Highs and Lows
ASX:PLL Weekly Price Chart with Average True Range (ATR) Trailing Stop (10-Year View)
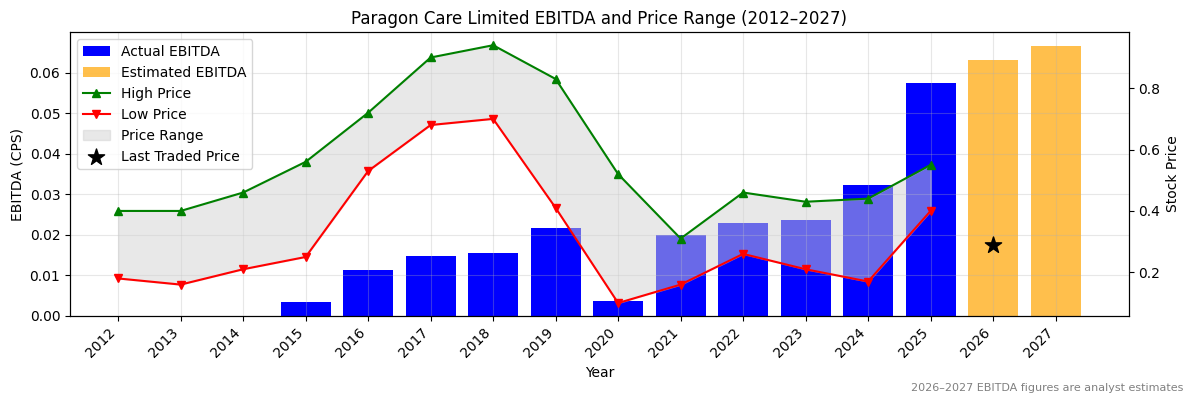
Ticker code: PGC
PGC Red Flags & Risk Indicators
⚠️
⚠️ RED FLAGS: 1 identified
Income Statement
| Revenue 2024 Per Share |
Revenue 2025e Per Share |
Revenue 2026e Per Share |
Revenue 24 to 25e [%] |
Revenue 25e to 26e [%] |
EBITDA 2024 Per Share |
EBITDA 2025e Per Share |
EBITDA 2026e Per Share |
EBITDA 24 to 25e [%] |
EBITDA 25e to 26e [%] |
| 1.79417 |
2.27282 |
2.36983 |
26.7 |
4.3 |
0.03218 |
0.05751 |
0.06321 |
78.7 |
9.9 |
PGC Revenue Per Share (2012–2027)
✅✅
PGC Earnings before Interest, Tax, Depreciation and Amortisation (EBITDA) Per Share (2012–2027)
✅✅
PGC Normalised Earnings Per Share (EPS) (2012–2027)
✅✅
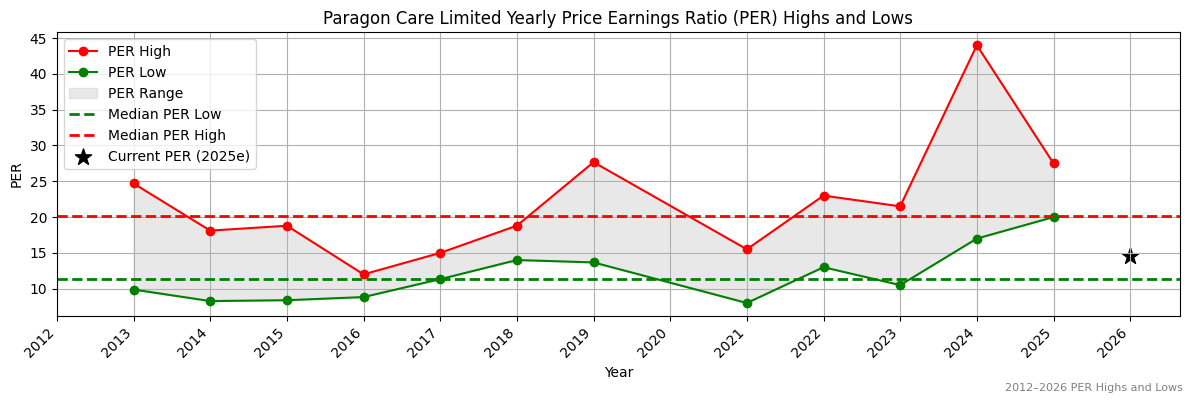
Valuation
| Price To Sales |
Price To Book |
PER 2023 |
PER 2024 |
13Y Median PER Low |
PER 2025e |
13Y Median PER High |
PER 2026e |
Last Updated |
| 0.1 |
1.6 |
16.0 |
32.0 |
11.3 |
16.0 |
20.2 |
16.0 |
6/10/25 |
PGC Yearly Price Earnings Ratio (PER) Highs and Lows
✅
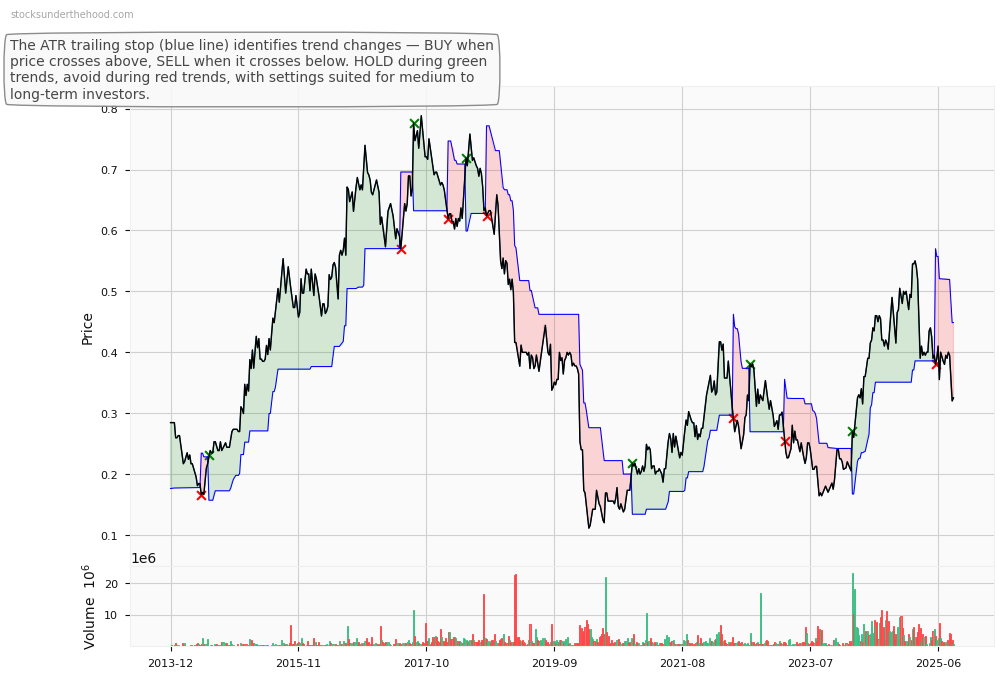
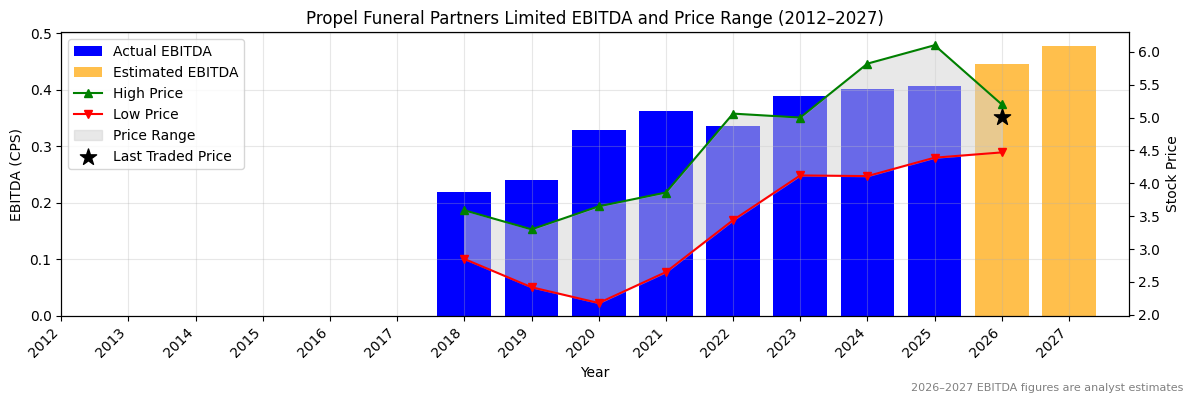
PGC Weekly Price Chart with Average True Range (ATR) Trailing Stop (10-Year View)
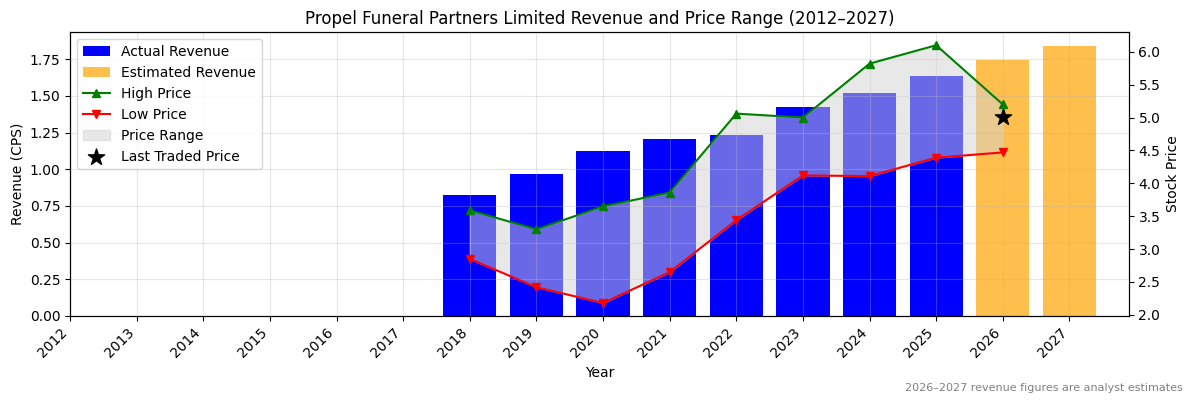
Ticker code: PFP
PFP Red Flags & Risk Indicators
❌
⚠️ RED FLAGS: 4 identified
- Highly Shorted
- Falling Earnings
- High Relative Valuation
- Falling EBITDA Margins
Income Statement
| Revenue 2024 Per Share |
Revenue 2025e Per Share |
Revenue 2026e Per Share |
Revenue 24 to 25e [%] |
Revenue 25e to 26e [%] |
EBITDA 2024 Per Share |
EBITDA 2025e Per Share |
EBITDA 2026e Per Share |
EBITDA 24 to 25e [%] |
EBITDA 25e to 26e [%] |
| 1.51732 |
1.63764 |
1.74642 |
7.9 |
6.6 |
0.40174 |
0.40725 |
0.44494 |
1.4 |
9.3 |
PFP Revenue Per Share (2012–2027)
✅
PFP Earnings before Interest, Tax, Depreciation and Amortisation (EBITDA) Per Share (2012–2027)
✅
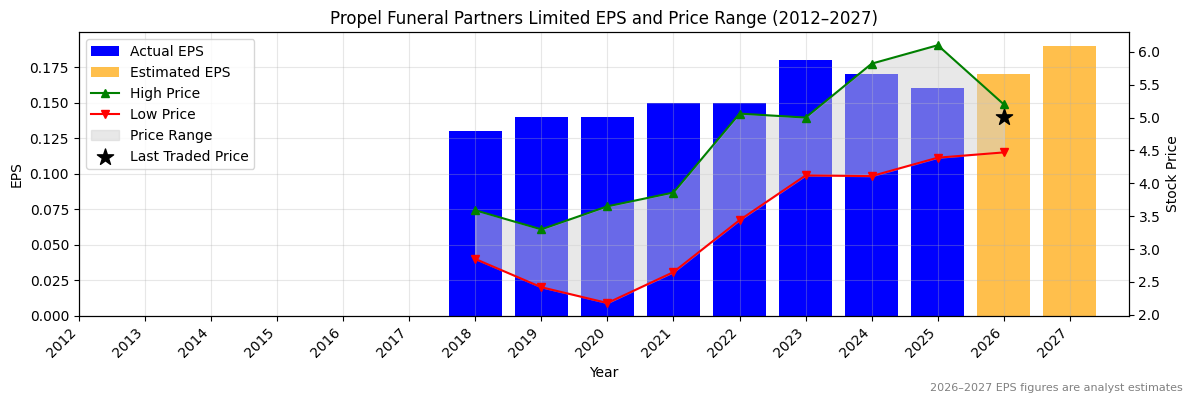
PFP Normalised Earnings Per Share (EPS) (2012–2027)
❌
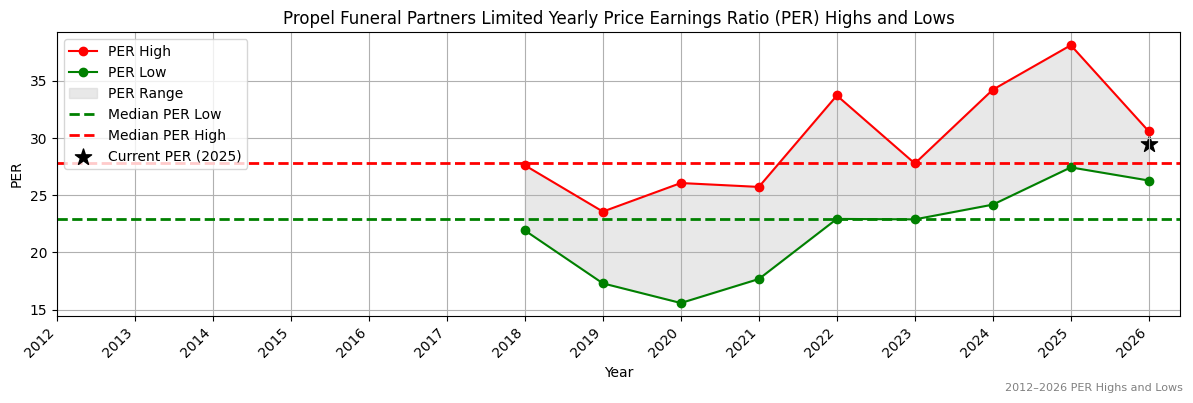
Valuation
| Price To Sales |
Price To Book |
PER 2023 |
PER 2024 |
13Y Median PER Low |
PER 2025e |
13Y Median PER High |
PER 2026e |
Last Updated |
| 3.1 |
2.0 |
27.9 |
29.5 |
22.9 |
31.4 |
27.8 |
29.5 |
17/9/25 |
PFP Yearly Price Earnings Ratio (PER) Highs and Lows
❌
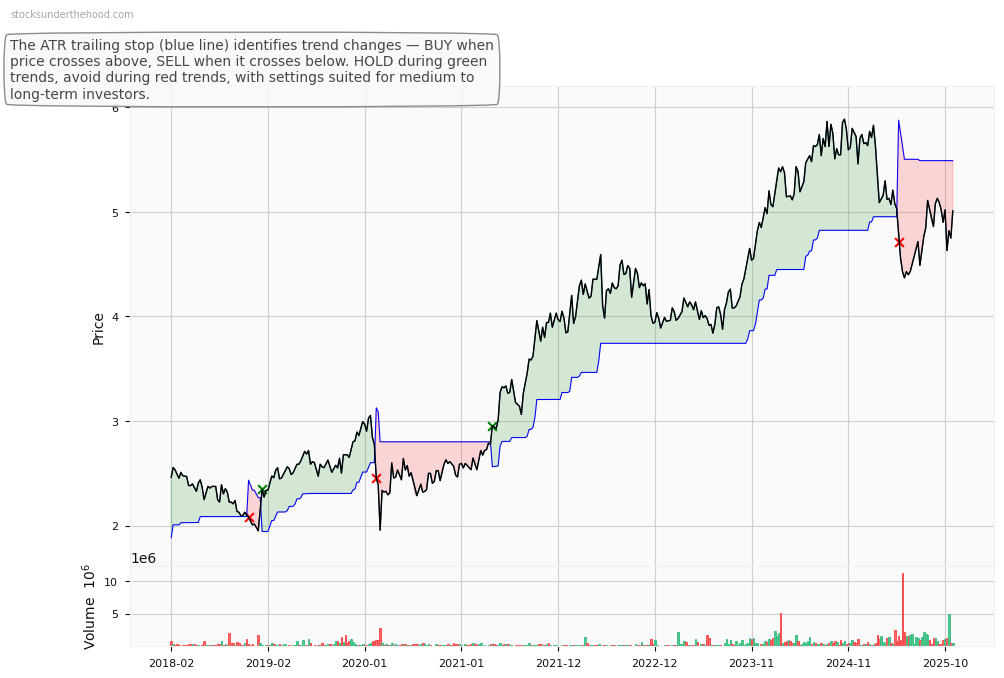
PFP Weekly Price Chart with Average True Range (ATR) Trailing Stop (10-Year View)
Ticker code: PEN
PEN Red Flags & Risk Indicators
❌
⚠️ RED FLAGS: 5 identified
- Negative Operating Cash Flow
- Large Share Issuance
- Increasing Shorts
- High Relative Valuation
- Falling EBITDA Margins
Income Statement
| Revenue 2024 Per Share |
Revenue 2025e Per Share |
Revenue 2026e Per Share |
Revenue 24 to 25e [%] |
Revenue 25e to 26e [%] |
EBITDA 2024 Per Share |
EBITDA 2025e Per Share |
EBITDA 2026e Per Share |
EBITDA 24 to 25e [%] |
EBITDA 25e to 26e [%] |
| 0.11212 |
0.03015 |
0.28828 |
-73.1 |
856.1 |
-0.11727 |
-0.17569 |
0.11565 |
-49.8 |
165.8 |
PEN Revenue Per Share (2012–2027)
❌
PEN Earnings before Interest, Tax, Depreciation and Amortisation (EBITDA) Per Share (2012–2027)
❌
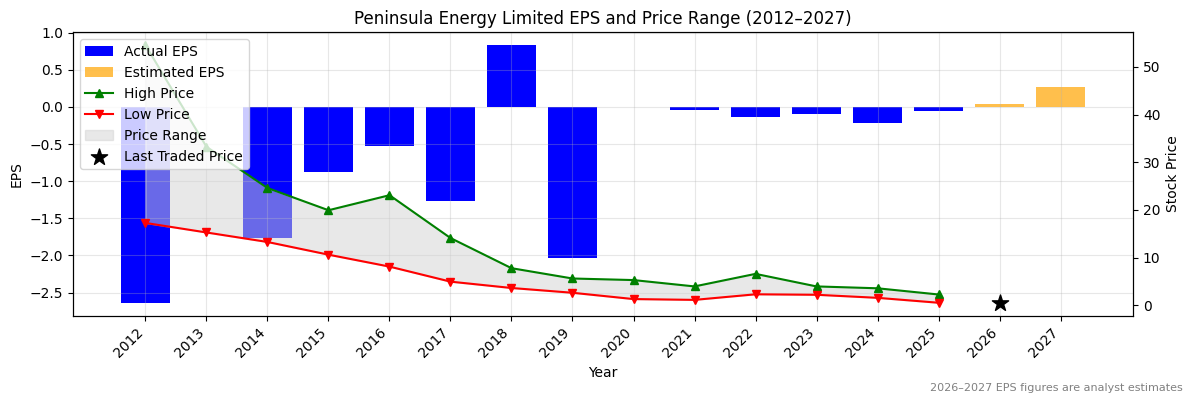
PEN Normalised Earnings Per Share (EPS) (2012–2027)
✅✅
Valuation
| Price To Sales |
Price To Book |
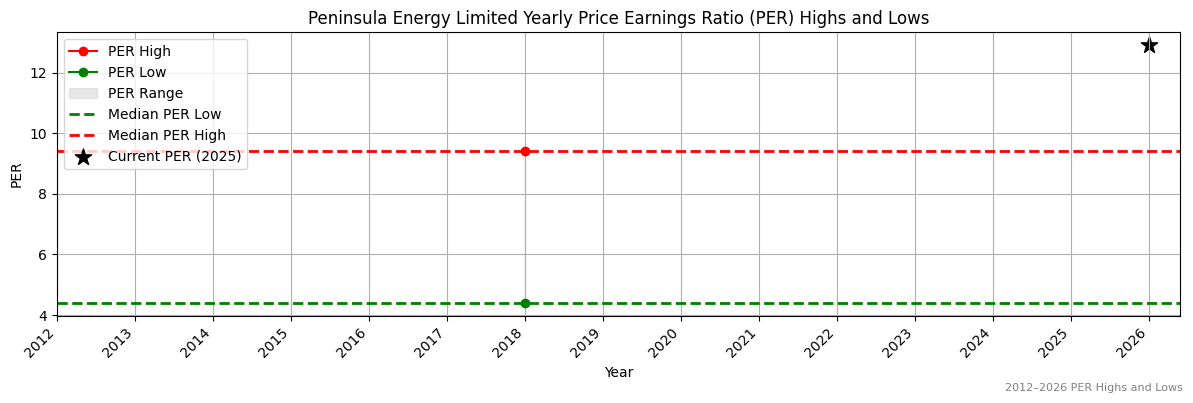
PER 2023 |
PER 2024 |
13Y Median PER Low |
PER 2025e |
13Y Median PER High |
PER 2026e |
Last Updated |
| None |
0.6 |
-5.9 |
-2.7 |
4.4 |
-11.8 |
9.4 |
14.7 |
20/4/25 |
PEN Yearly Price Earnings Ratio (PER) Highs and Lows
✅✅
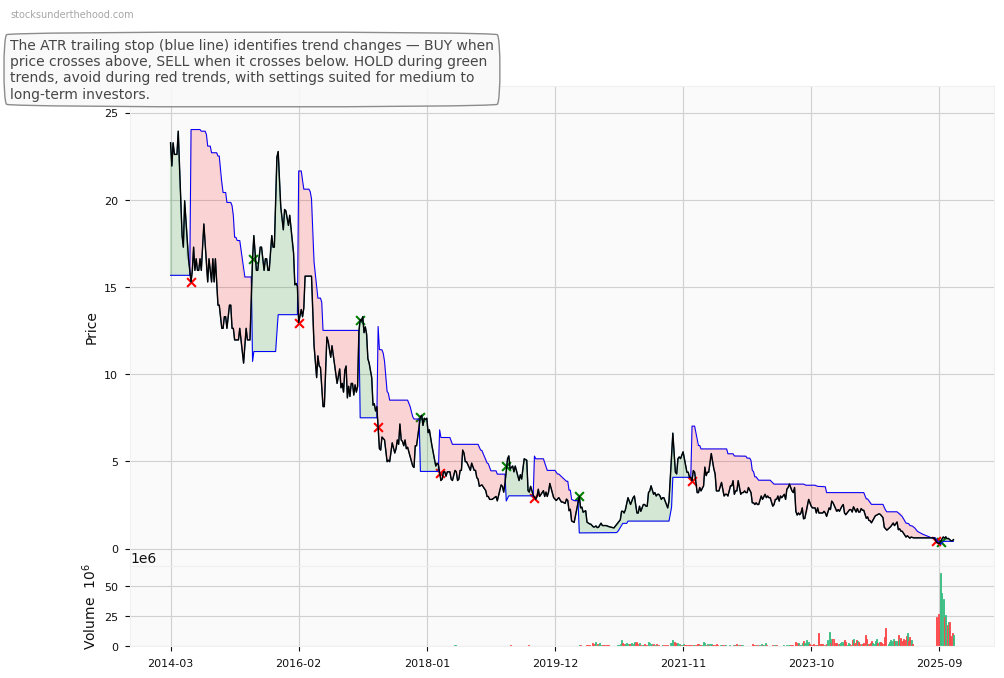
PEN Weekly Price Chart with Average True Range (ATR) Trailing Stop (10-Year View)
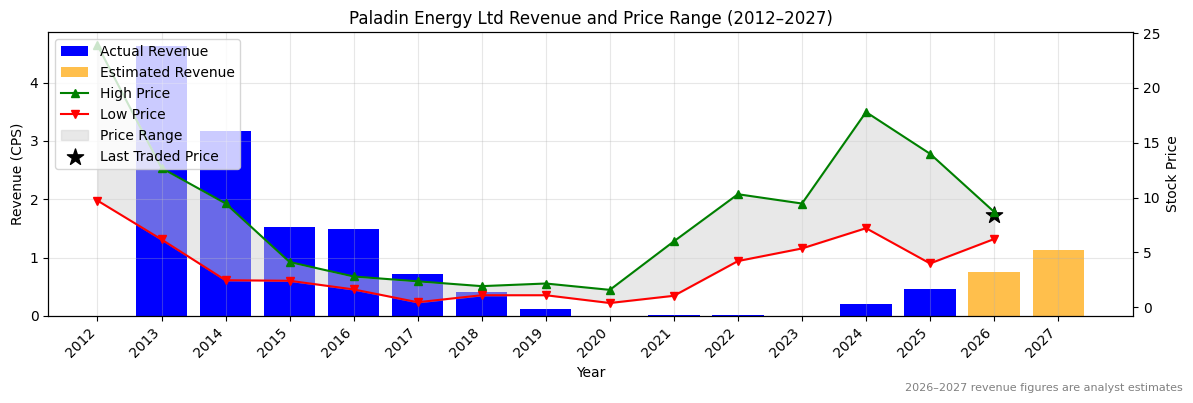
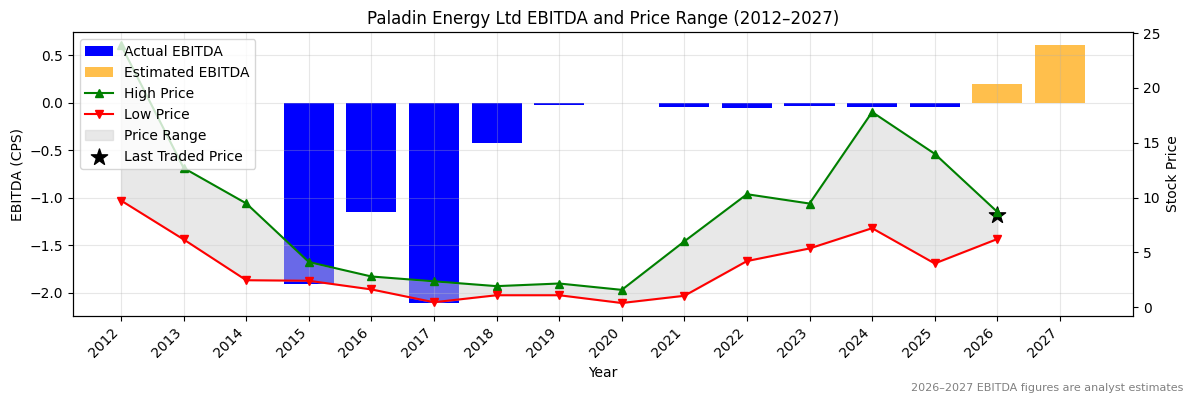
Ticker code: PDN
PDN Red Flags & Risk Indicators
❌
⚠️ RED FLAGS: 6 identified
- Negative Operating Cash Flow
- Low Operating Margin
- Highly Shorted
- Falling Earnings
- High Relative Valuation
- Risk Of Capital Raise
Income Statement
| Revenue 2024 Per Share |
Revenue 2025e Per Share |
Revenue 2026e Per Share |
Revenue 24 to 25e [%] |
Revenue 25e to 26e [%] |
EBITDA 2024 Per Share |
EBITDA 2025e Per Share |
EBITDA 2026e Per Share |
EBITDA 24 to 25e [%] |
EBITDA 25e to 26e [%] |
| 0.21234 |
0.4676 |
0.75315 |
120.2 |
61.1 |
-0.04572 |
-0.04446 |
0.20137 |
2.8 |
552.9 |
PDN Revenue Per Share (2012–2027)
✅✅
PDN Earnings before Interest, Tax, Depreciation and Amortisation (EBITDA) Per Share (2012–2027)
✅
PDN Normalised Earnings Per Share (EPS) (2012–2027)
✅✅
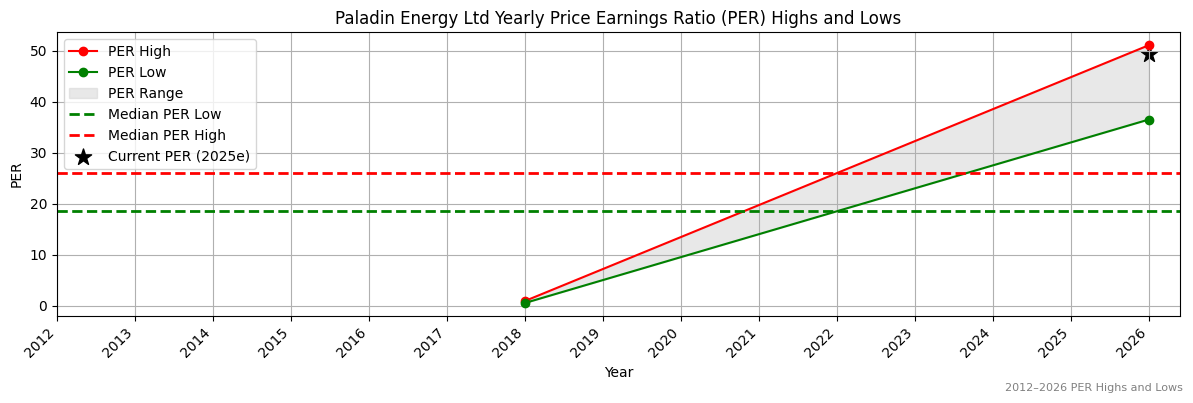
Valuation
| Price To Sales |
Price To Book |
PER 2023 |
PER 2024 |
13Y Median PER Low |
PER 2025e |
13Y Median PER High |
PER 2026e |
Last Updated |
| 24.0 |
4.2 |
-237.0 |
-72.9 |
18.5 |
-237.0 |
26.0 |
55.8 |
4/10/25 |
PDN Yearly Price Earnings Ratio (PER) Highs and Lows
✅✅
PDN Weekly Price Chart with Average True Range (ATR) Trailing Stop (10-Year View)
Ticker code: PDI
PDI Red Flags & Risk Indicators
❌
⚠️ RED FLAGS: 6 identified
- Negative Operating Cash Flow
- Large Share Issuance
- Increasing Shorts
- Zero Revenue
- Falling Earnings
- High Price to Book vs ROE
Income Statement
| Revenue 2024 Per Share |
Revenue 2025e Per Share |
Revenue 2026e Per Share |
Revenue 24 to 25e [%] |
Revenue 25e to 26e [%] |
EBITDA 2024 Per Share |
EBITDA 2025e Per Share |
EBITDA 2026e Per Share |
EBITDA 24 to 25e [%] |
EBITDA 25e to 26e [%] |
| None |
None |
None |
None |
None |
-0.00418 |
-0.00473 |
-0.00413 |
-13.1 |
12.6 |
PDI Revenue Per Share (2012–2027)
PDI Earnings before Interest, Tax, Depreciation and Amortisation (EBITDA) Per Share (2012–2027)
❌
PDI Normalised Earnings Per Share (EPS) (2012–2027)
Valuation
| Price To Sales |
Price To Book |
PER 2023 |
PER 2024 |
13Y Median PER Low |
PER 2025e |
13Y Median PER High |
PER 2026e |
Last Updated |
| 683.5 |
6.5 |
None |
None |
None |
None |
None |
None |
3/10/25 |
PDI Yearly Price Earnings Ratio (PER) Highs and Lows
PDI Weekly Price Chart with Average True Range (ATR) Trailing Stop (10-Year View)
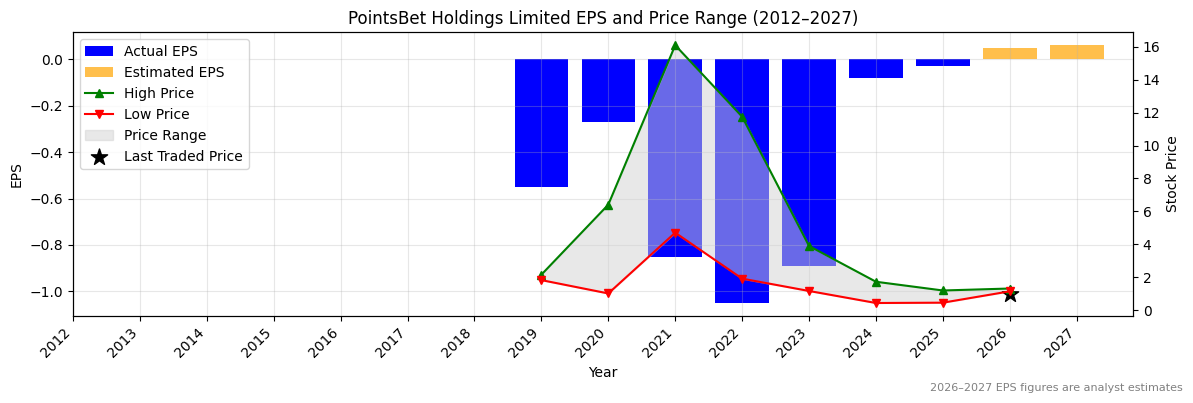
Ticker code: PBH
PBH Red Flags & Risk Indicators
⚠️
⚠️ RED FLAGS: 2 identified
- Large Share Issuance
- High Price to Book vs ROE
Income Statement
| Revenue 2024 Per Share |
Revenue 2025e Per Share |
Revenue 2026e Per Share |
Revenue 24 to 25e [%] |
Revenue 25e to 26e [%] |
EBITDA 2024 Per Share |
EBITDA 2025e Per Share |
EBITDA 2026e Per Share |
EBITDA 24 to 25e [%] |
EBITDA 25e to 26e [%] |
| 0.75408 |
0.79534 |
0.84839 |
5.5 |
6.7 |
-0.00553 |
0.03377 |
0.09626 |
710.7 |
185.1 |
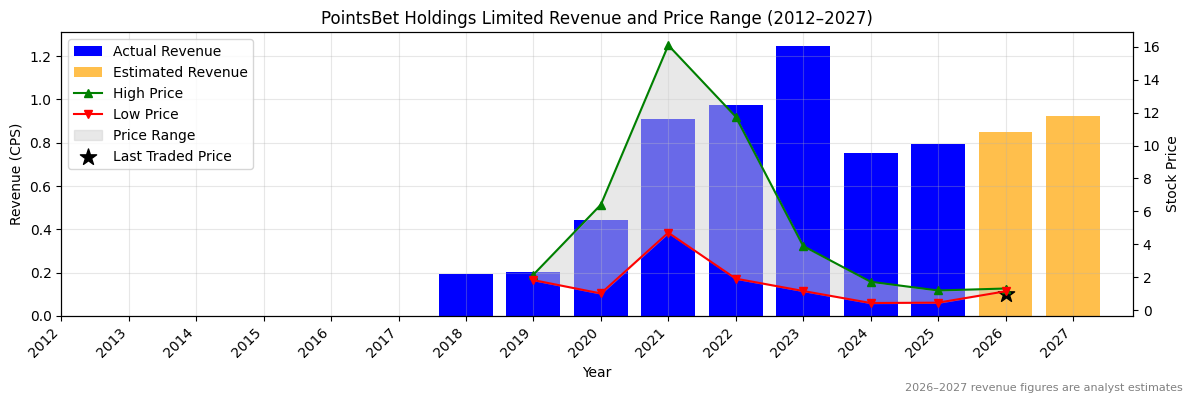
PBH Revenue Per Share (2012–2027)
✅
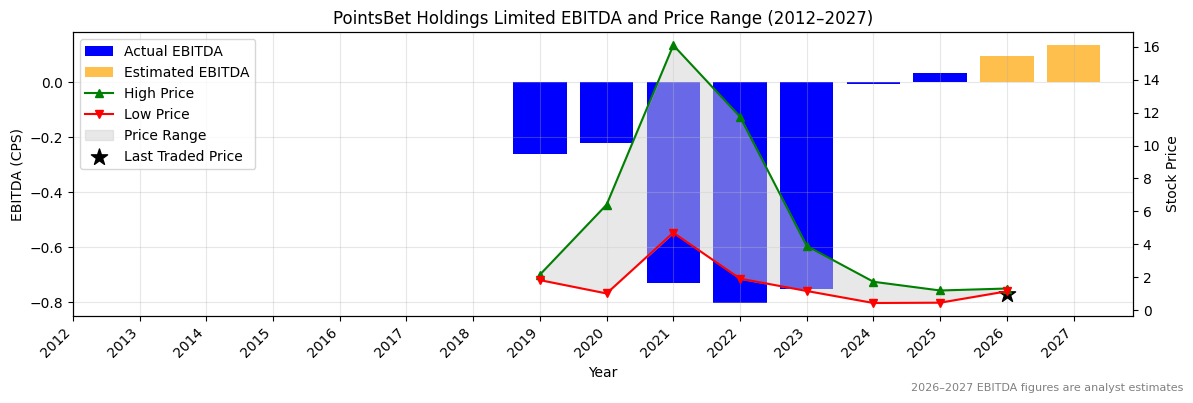
PBH Earnings before Interest, Tax, Depreciation and Amortisation (EBITDA) Per Share (2012–2027)
✅✅
PBH Normalised Earnings Per Share (EPS) (2012–2027)
✅✅
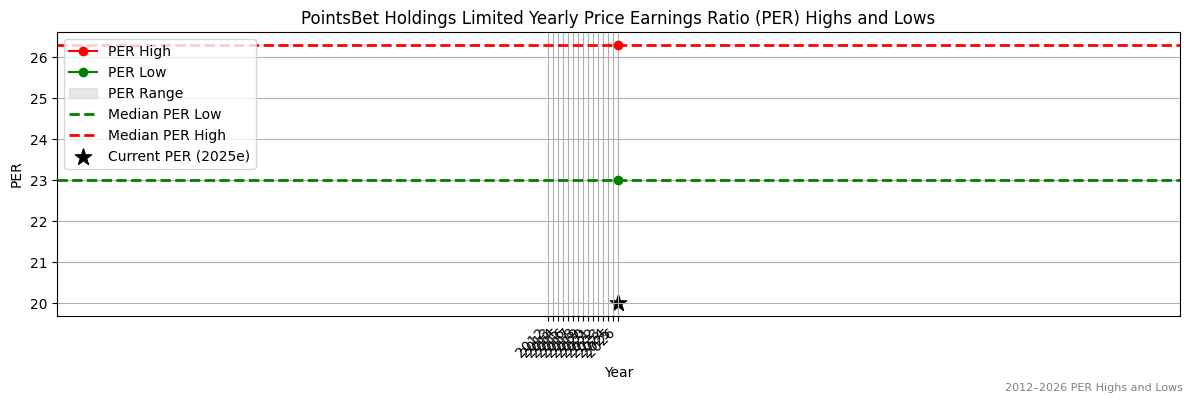
Valuation
| Price To Sales |
Price To Book |
PER 2023 |
PER 2024 |
13Y Median PER Low |
PER 2025e |
13Y Median PER High |
PER 2026e |
Last Updated |
| 1.3 |
53.6 |
-1.1 |
-12.1 |
23.0 |
-32.2 |
26.3 |
19.3 |
3/10/25 |
PBH Yearly Price Earnings Ratio (PER) Highs and Lows
✅✅
PBH Weekly Price Chart with Average True Range (ATR) Trailing Stop (10-Year View)