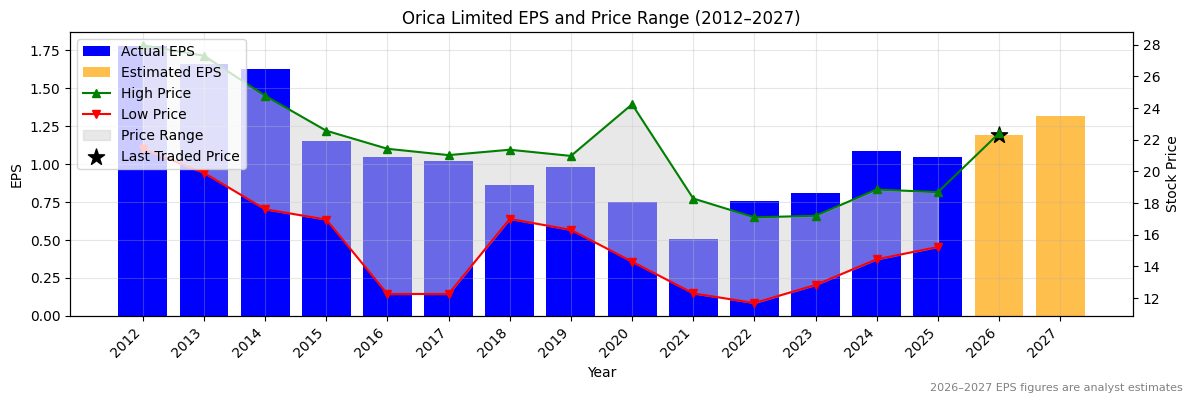
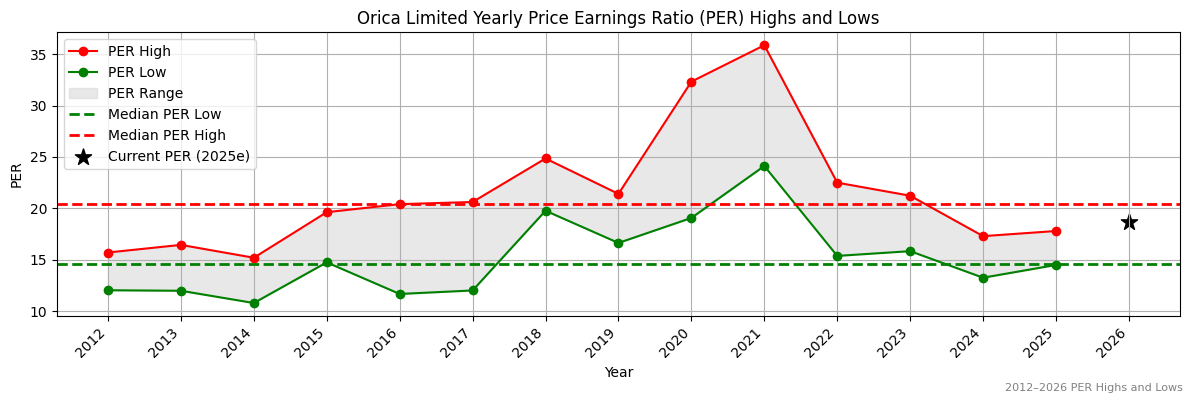
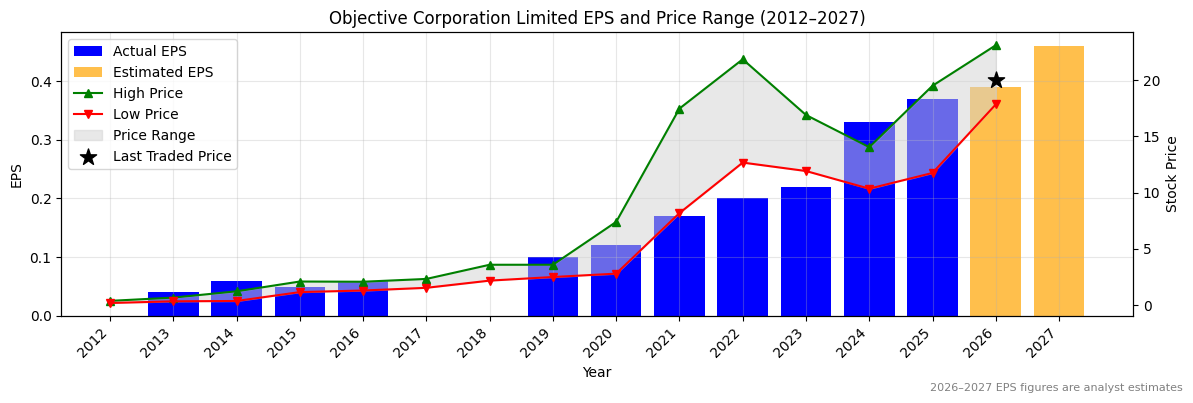
Ticker code: ORI
ORI Red Flags & Risk Indicators
⚠️
⚠️ RED FLAGS: 1 identified
Income Statement
| Revenue 2024 Per Share |
Revenue 2025e Per Share |
Revenue 2026e Per Share |
Revenue 24 to 25e [%] |
Revenue 25e to 26e [%] |
EBITDA 2024 Per Share |
EBITDA 2025e Per Share |
EBITDA 2026e Per Share |
EBITDA 24 to 25e [%] |
EBITDA 25e to 26e [%] |
| 15.7347 |
18.01127 |
18.46212 |
14.5 |
2.5 |
2.54107 |
3.02463 |
3.27189 |
19.0 |
8.2 |
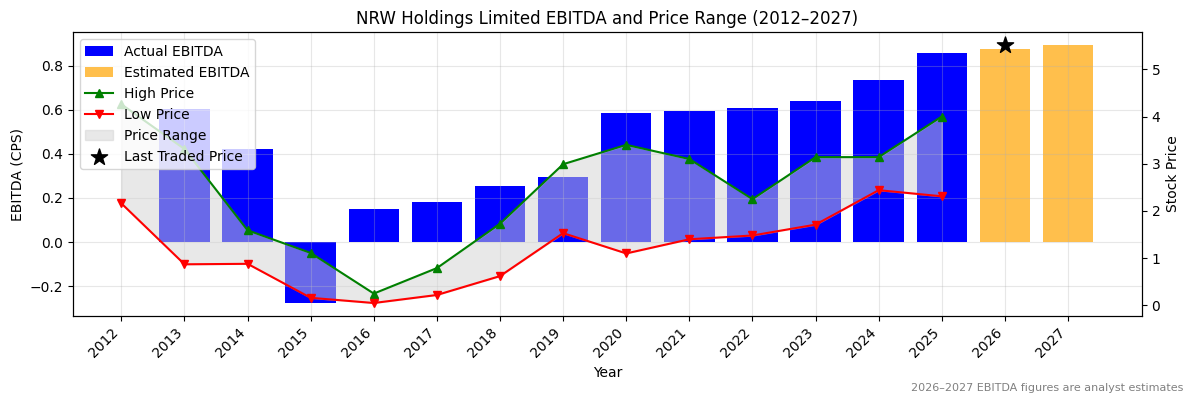
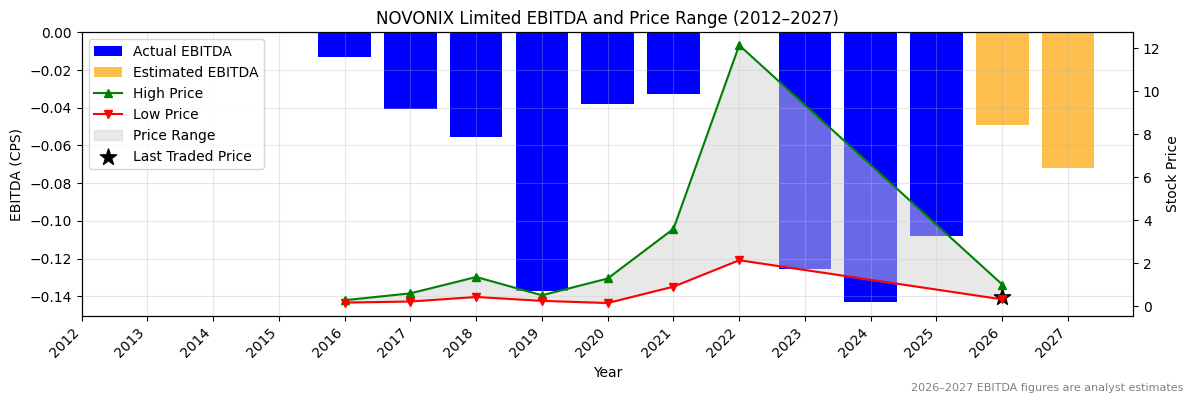
ORI Revenue Per Share (2012–2027)
✅
ORI Earnings before Interest, Tax, Depreciation and Amortisation (EBITDA) Per Share (2012–2027)
✅
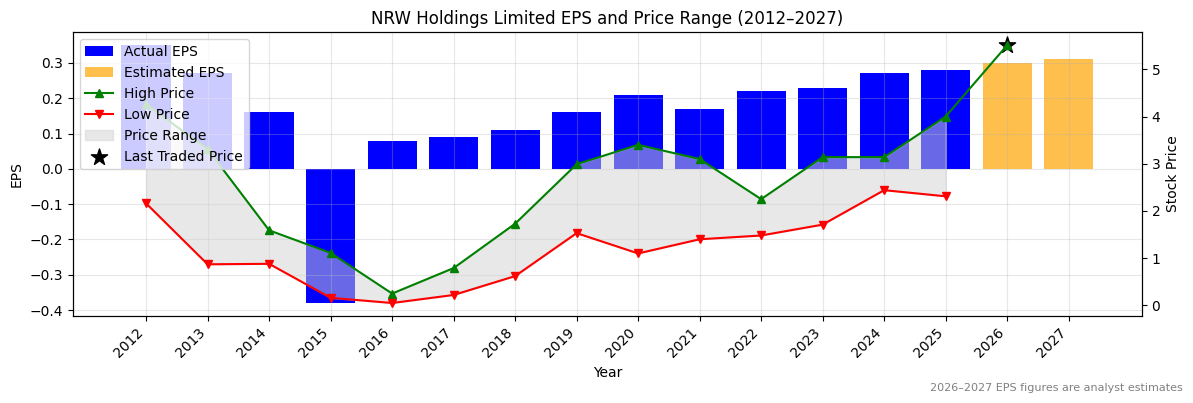
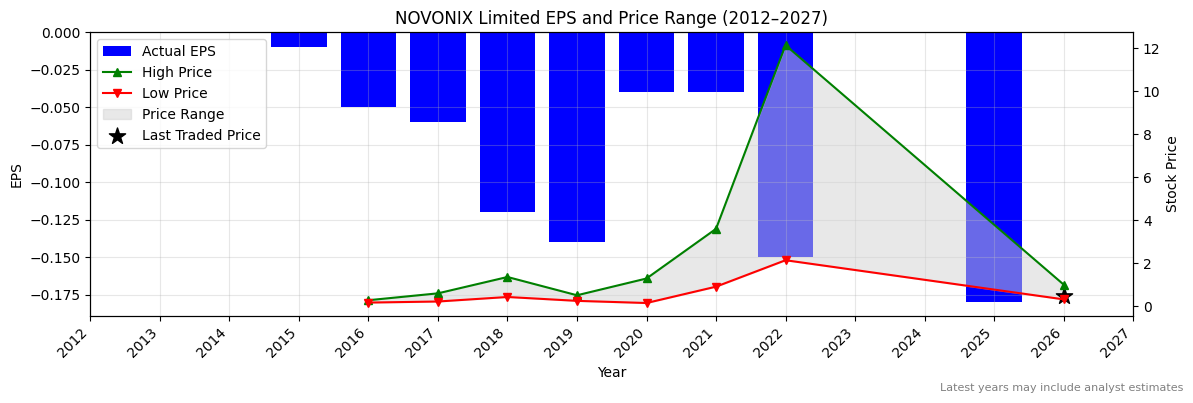
ORI Normalised Earnings Per Share (EPS) (2012–2027)
❌
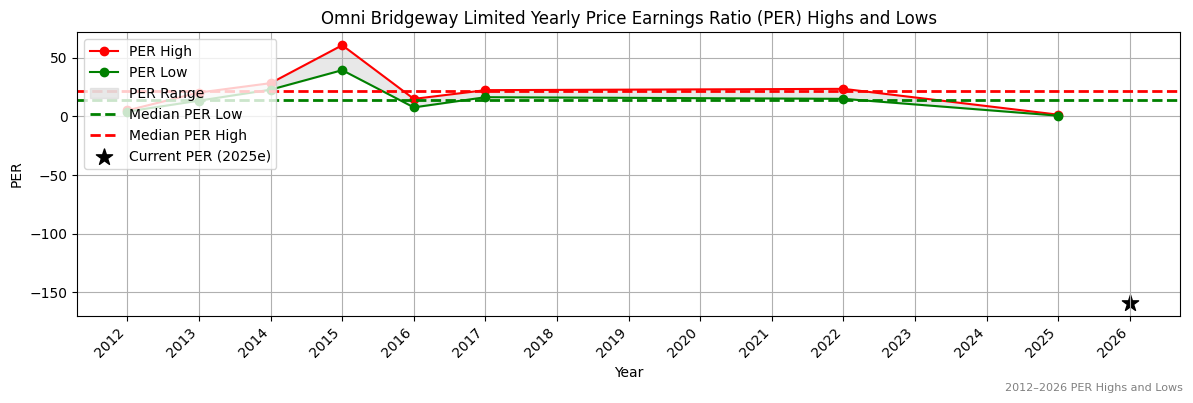
Valuation
| Price To Sales |
Price To Book |
PER 2023 |
PER 2024 |
13Y Median PER Low |
PER 2025e |
13Y Median PER High |
PER 2026e |
Last Updated |
| 1.3 |
2.4 |
27.5 |
20.4 |
14.6 |
21.2 |
20.4 |
18.7 |
29/4/25 |
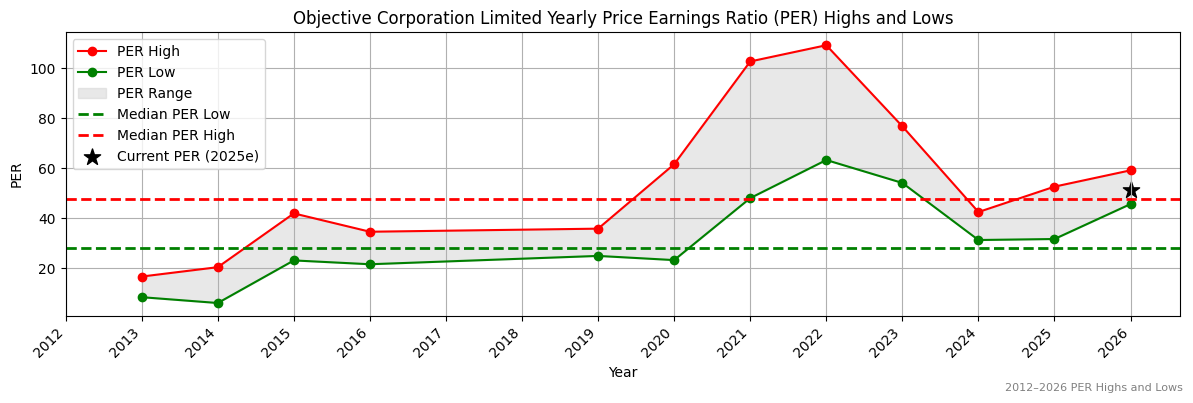
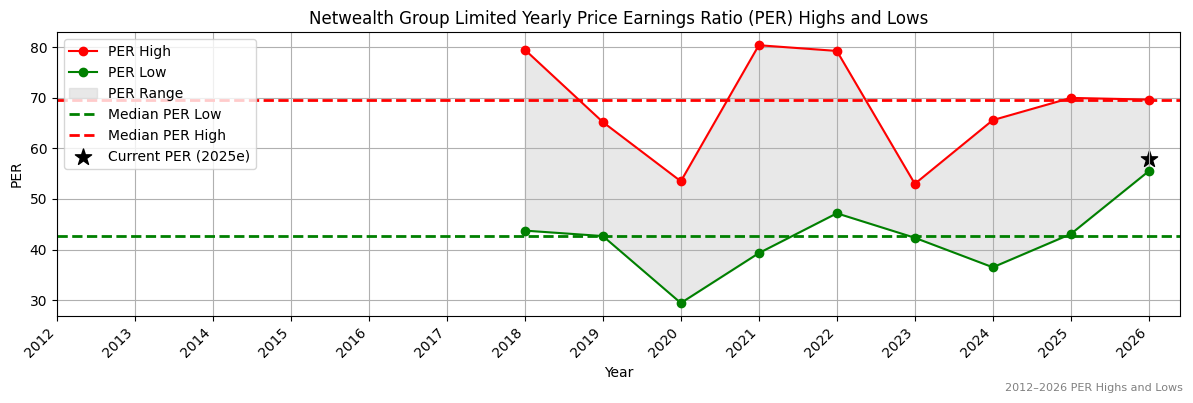
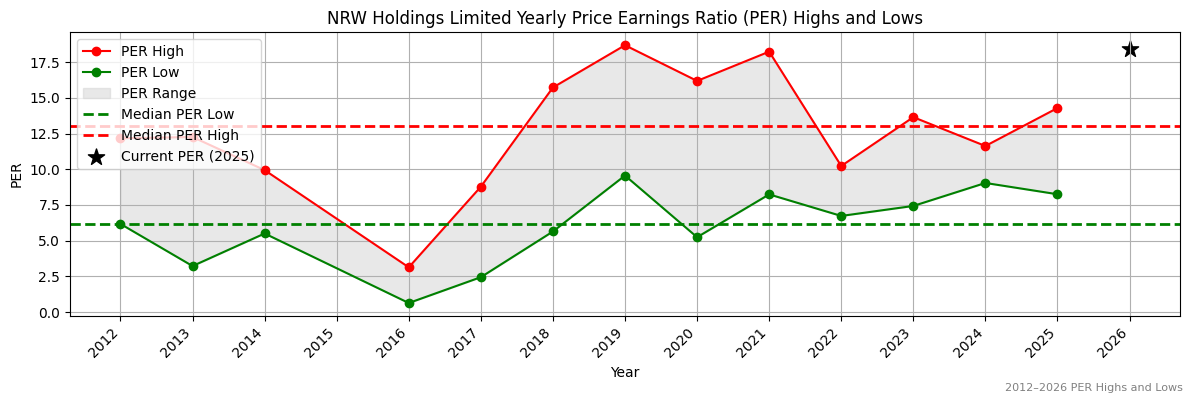
ORI Yearly Price Earnings Ratio (PER) Highs and Lows
❌
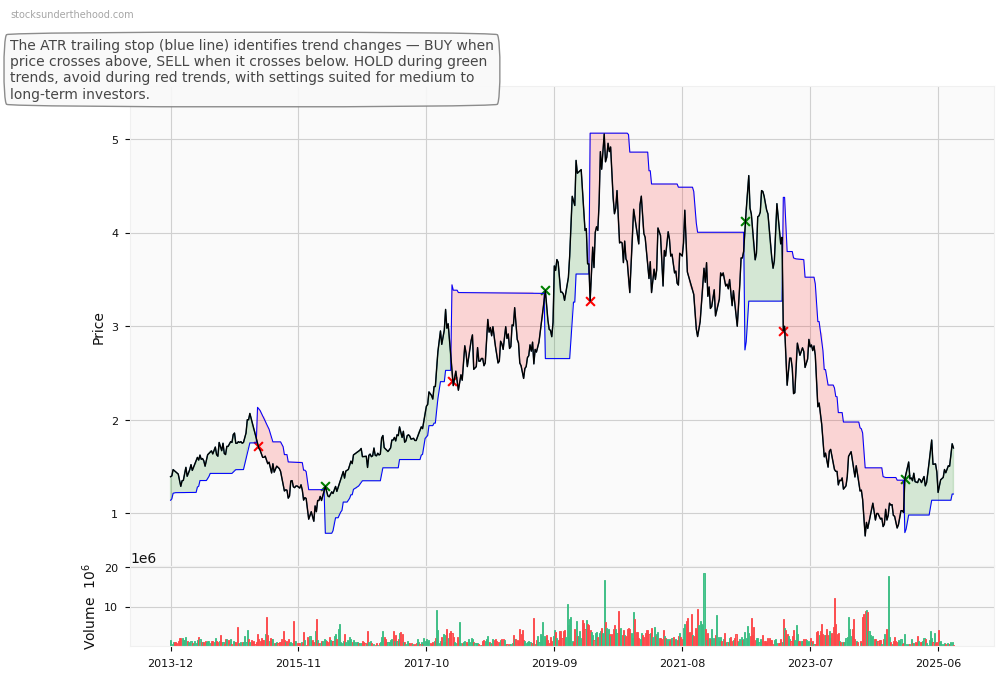
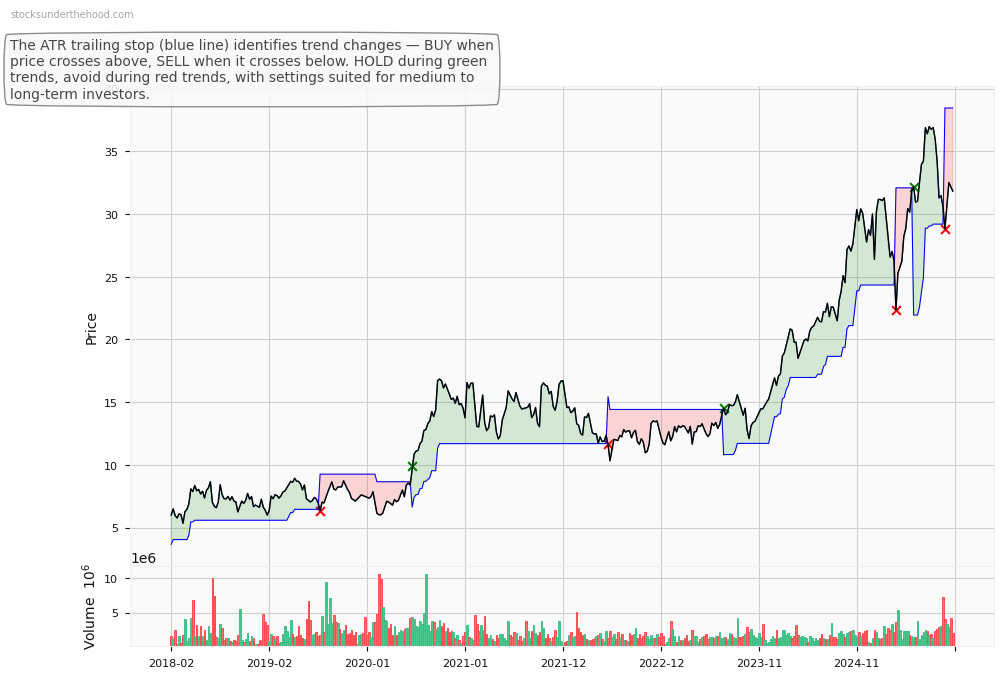
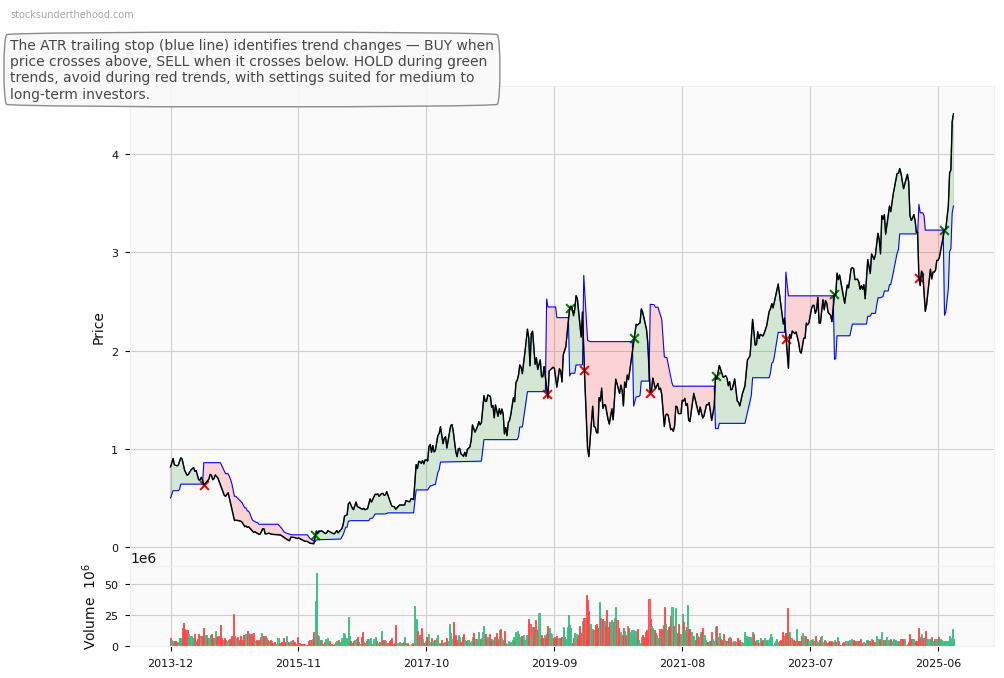
ORI Weekly Price Chart with Average True Range (ATR) Trailing Stop (10-Year View)
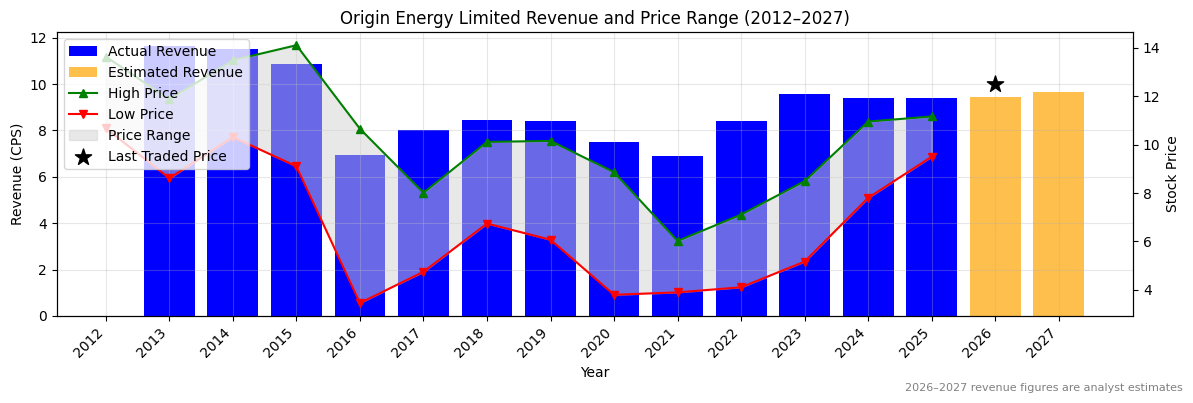
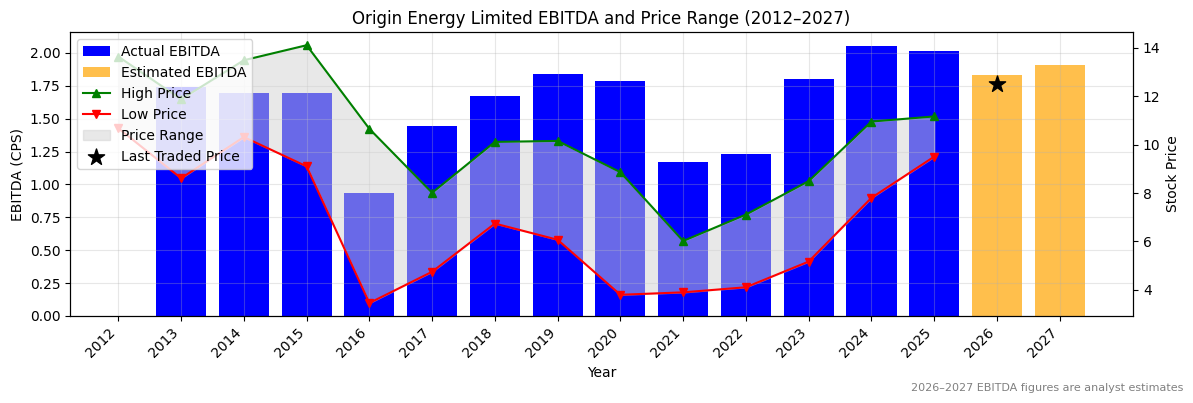
Ticker code: ORG
ORG Red Flags & Risk Indicators
⚠️
⚠️ RED FLAGS: 1 identified
Income Statement
| Revenue 2024 Per Share |
Revenue 2025e Per Share |
Revenue 2026e Per Share |
Revenue 24 to 25e [%] |
Revenue 25e to 26e [%] |
EBITDA 2024 Per Share |
EBITDA 2025e Per Share |
EBITDA 2026e Per Share |
EBITDA 24 to 25e [%] |
EBITDA 25e to 26e [%] |
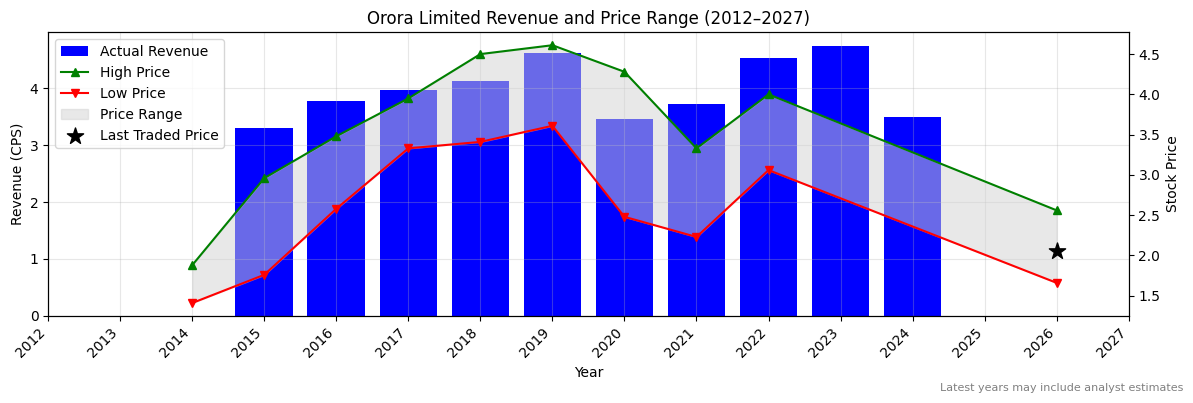
| 9.39457 |
9.40177 |
9.42617 |
0.1 |
0.3 |
2.05379 |
2.01434 |
1.83556 |
-1.9 |
-8.9 |
ORG Revenue Per Share (2012–2027)
✅
ORG Earnings before Interest, Tax, Depreciation and Amortisation (EBITDA) Per Share (2012–2027)
❌
ORG Normalised Earnings Per Share (EPS) (2012–2027)
✅✅
Valuation
| Price To Sales |
Price To Book |
PER 2023 |
PER 2024 |
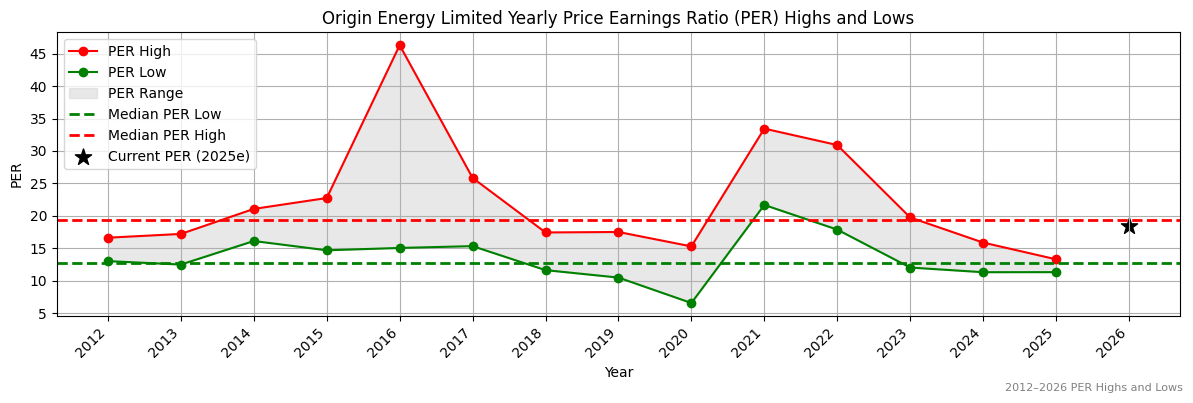
13Y Median PER Low |
PER 2025e |
13Y Median PER High |
PER 2026e |
Last Updated |
| 1.2 |
2.1 |
28.5 |
17.8 |
12.7 |
14.6 |
19.3 |
18.0 |
9/1/25 |
ORG Yearly Price Earnings Ratio (PER) Highs and Lows
✅
ORG Weekly Price Chart with Average True Range (ATR) Trailing Stop (10-Year View)
Ticker code: ORA
ORA Red Flags & Risk Indicators
⚠️
⚠️ RED FLAGS: 2 identified
- Increasing Shorts
- Falling Earnings
Income Statement
| Revenue 2024 Per Share |
Revenue 2025e Per Share |
Revenue 2026e Per Share |
Revenue 24 to 25e [%] |
Revenue 25e to 26e [%] |
EBITDA 2024 Per Share |
EBITDA 2025e Per Share |
EBITDA 2026e Per Share |
EBITDA 24 to 25e [%] |
EBITDA 25e to 26e [%] |
| 3.49654 |
None |
None |
None |
None |
0.45848 |
0.59247 |
None |
29.2 |
None |
ORA Revenue Per Share (2012–2027)
ORA Earnings before Interest, Tax, Depreciation and Amortisation (EBITDA) Per Share (2012–2027)
✅✅
ORA Normalised Earnings Per Share (EPS) (2012–2027)
❌
Valuation
| Price To Sales |
Price To Book |
PER 2023 |
PER 2024 |
13Y Median PER Low |
PER 2025e |
13Y Median PER High |
PER 2026e |
Last Updated |
| 1.2 |
0.9 |
8.4 |
11.2 |
14.5 |
11.8 |
20.1 |
10.0 |
4/4/24 |
ORA Yearly Price Earnings Ratio (PER) Highs and Lows
✅✅
ORA Weekly Price Chart with Average True Range (ATR) Trailing Stop (10-Year View)
Ticker code: ASX:OPT
ASX:OPT Red Flags & Risk Indicators
✅
⚠️ RED FLAGS: 0 identified
No red flags detected.
Income Statement
| Revenue 2024 Per Share |
Revenue 2025e Per Share |
Revenue 2026e Per Share |
Revenue 24 to 25e [%] |
Revenue 25e to 26e [%] |
EBITDA 2024 Per Share |
EBITDA 2025e Per Share |
EBITDA 2026e Per Share |
EBITDA 24 to 25e [%] |
EBITDA 25e to 26e [%] |
| None |
None |
None |
None |
None |
None |
None |
None |
None |
None |
ASX:OPT Revenue Per Share (2012–2027)
ASX:OPT Earnings before Interest, Tax, Depreciation and Amortisation (EBITDA) Per Share (2012–2027)
ASX:OPT Normalised Earnings Per Share (EPS) (2012–2027)
Valuation
| Price To Sales |
Price To Book |
PER 2023 |
PER 2024 |
13Y Median PER Low |
PER 2025e |
13Y Median PER High |
PER 2026e |
Last Updated |
| 5621.8 |
-3.7 |
None |
None |
None |
None |
None |
None |
None |
ASX:OPT Yearly Price Earnings Ratio (PER) Highs and Lows
ASX:OPT Weekly Price Chart with Average True Range (ATR) Trailing Stop (10-Year View)
Ticker code: ONE
ONE Red Flags & Risk Indicators
❌
⚠️ RED FLAGS: 7 identified
- Negative Operating Cash Flow
- Large Share Issuance
- Low Operating Margin
- Increasing Shorts
- Falling Earnings
- High Price to Book vs ROE
- Risk Of Capital Raise
Income Statement
| Revenue 2024 Per Share |
Revenue 2025e Per Share |
Revenue 2026e Per Share |
Revenue 24 to 25e [%] |
Revenue 25e to 26e [%] |
EBITDA 2024 Per Share |
EBITDA 2025e Per Share |
EBITDA 2026e Per Share |
EBITDA 24 to 25e [%] |
EBITDA 25e to 26e [%] |
| 0.01784 |
0.02541 |
0.03452 |
42.4 |
35.8 |
-0.01421 |
-0.01296 |
-0.00787 |
8.8 |
39.3 |
ONE Revenue Per Share (2012–2027)
✅✅
ONE Earnings before Interest, Tax, Depreciation and Amortisation (EBITDA) Per Share (2012–2027)
✅
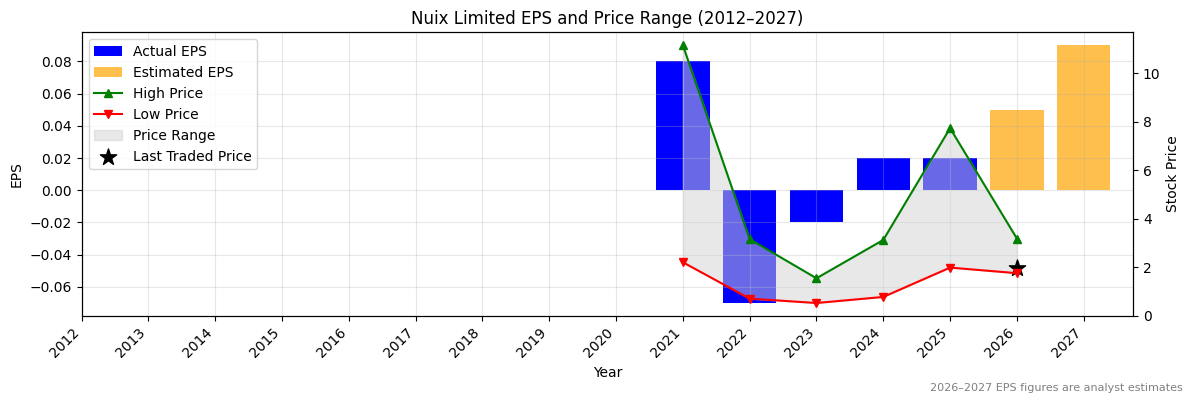
ONE Normalised Earnings Per Share (EPS) (2012–2027)
✅✅
Valuation
| Price To Sales |
Price To Book |
PER 2023 |
PER 2024 |
13Y Median PER Low |
PER 2025e |
13Y Median PER High |
PER 2026e |
Last Updated |
| 17.1 |
19.5 |
-9.7 |
-9.7 |
None |
-19.5 |
None |
-19.5 |
4/10/25 |
ONE Yearly Price Earnings Ratio (PER) Highs and Lows
ONE Weekly Price Chart with Average True Range (ATR) Trailing Stop (10-Year View)
Ticker code: OML
OML Red Flags & Risk Indicators
❌
⚠️ RED FLAGS: 3 identified
- Falling Earnings
- More Net Debt Than Equity
- Falling EBITDA Margins
Income Statement
| Revenue 2024 Per Share |
Revenue 2025e Per Share |
Revenue 2026e Per Share |
Revenue 24 to 25e [%] |
Revenue 25e to 26e [%] |
EBITDA 2024 Per Share |
EBITDA 2025e Per Share |
EBITDA 2026e Per Share |
EBITDA 24 to 25e [%] |
EBITDA 25e to 26e [%] |
| 1.17976 |
1.29225 |
1.36658 |
9.5 |
5.8 |
0.53834 |
0.26077 |
0.2875 |
-51.6 |
10.2 |
OML Revenue Per Share (2012–2027)
✅
OML Earnings before Interest, Tax, Depreciation and Amortisation (EBITDA) Per Share (2012–2027)
❌
OML Normalised Earnings Per Share (EPS) (2012–2027)
✅
Valuation
| Price To Sales |
Price To Book |
PER 2023 |
PER 2024 |
13Y Median PER Low |
PER 2025e |
13Y Median PER High |
PER 2026e |
Last Updated |
| 1.1 |
1.0 |
13.8 |
12.5 |
11.2 |
10.6 |
16.8 |
9.8 |
30/5/25 |
OML Yearly Price Earnings Ratio (PER) Highs and Lows
✅✅
OML Weekly Price Chart with Average True Range (ATR) Trailing Stop (10-Year View)
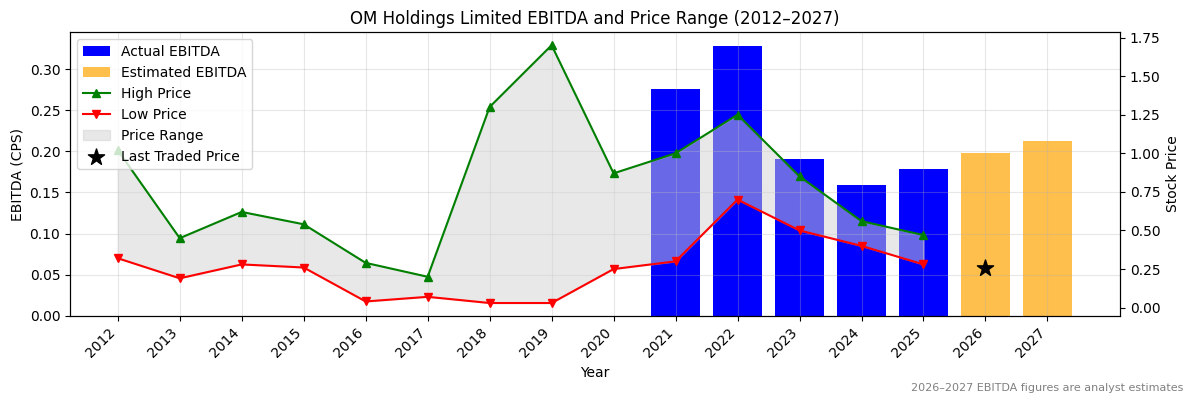
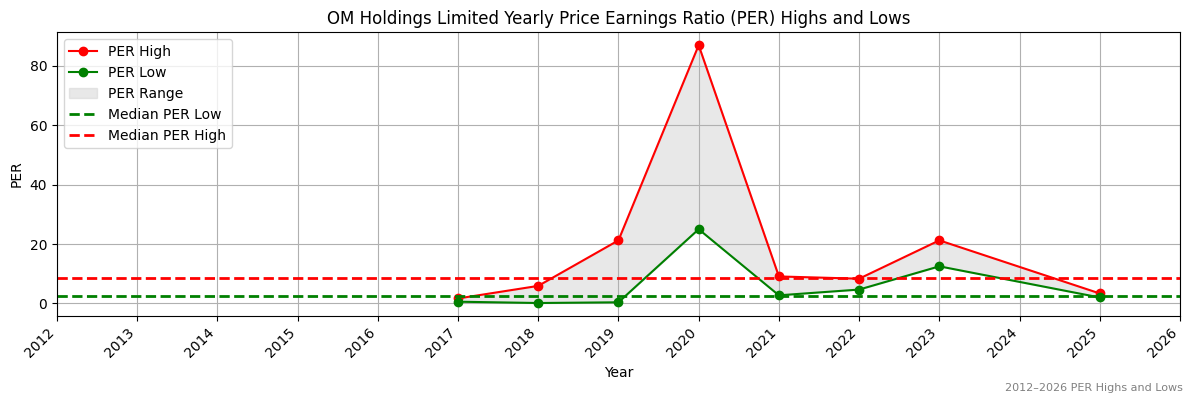
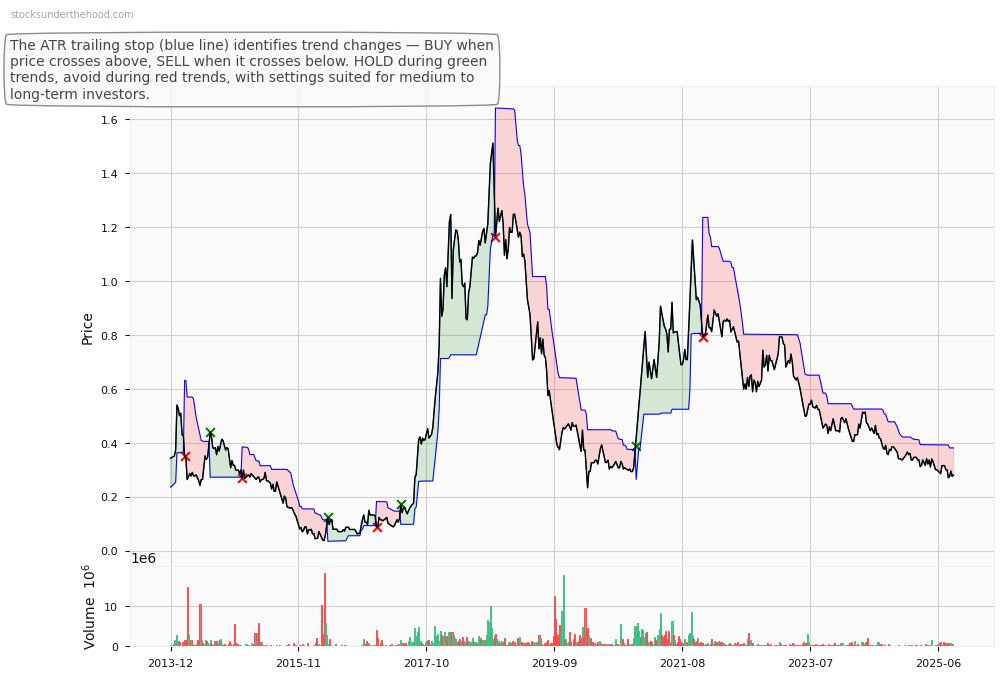
Ticker code: OMH
OMH Red Flags & Risk Indicators
❌
⚠️ RED FLAGS: 3 identified
- Falling Earnings
- High Relative Valuation
- Falling EBITDA Margins
Income Statement
| Revenue 2024 Per Share |
Revenue 2025e Per Share |
Revenue 2026e Per Share |
Revenue 24 to 25e [%] |
Revenue 25e to 26e [%] |
EBITDA 2024 Per Share |
EBITDA 2025e Per Share |
EBITDA 2026e Per Share |
EBITDA 24 to 25e [%] |
EBITDA 25e to 26e [%] |
| 1.36559 |
1.77103 |
1.99582 |
29.7 |
12.7 |
0.15862 |
0.17899 |
0.19784 |
12.8 |
10.5 |
OMH Revenue Per Share (2012–2027)
✅✅
OMH Earnings before Interest, Tax, Depreciation and Amortisation (EBITDA) Per Share (2012–2027)
✅
OMH Normalised Earnings Per Share (EPS) (2012–2027)
Valuation
| Price To Sales |
Price To Book |
PER 2023 |
PER 2024 |
13Y Median PER Low |
PER 2025e |
13Y Median PER High |
PER 2026e |
Last Updated |
| 0.3 |
0.5 |
6.4 |
None |
2.4 |
1.8 |
8.7 |
None |
3/7/25 |
OMH Yearly Price Earnings Ratio (PER) Highs and Lows
✅✅
OMH Weekly Price Chart with Average True Range (ATR) Trailing Stop (10-Year View)
Ticker code: OFX
OFX Red Flags & Risk Indicators
❌
⚠️ RED FLAGS: 3 identified
- Increasing Shorts
- Falling Earnings
- Falling EBITDA Margins
Income Statement
| Revenue 2024 Per Share |
Revenue 2025e Per Share |
Revenue 2026e Per Share |
Revenue 24 to 25e [%] |
Revenue 25e to 26e [%] |
EBITDA 2024 Per Share |
EBITDA 2025e Per Share |
EBITDA 2026e Per Share |
EBITDA 24 to 25e [%] |
EBITDA 25e to 26e [%] |
| 0.96562 |
0.99163 |
1.08222 |
2.7 |
9.1 |
0.27137 |
0.25346 |
0.29153 |
-6.6 |
15.0 |
OFX Revenue Per Share (2012–2027)
✅
OFX Earnings before Interest, Tax, Depreciation and Amortisation (EBITDA) Per Share (2012–2027)
❌
OFX Normalised Earnings Per Share (EPS) (2012–2027)
❌
Valuation
| Price To Sales |
Price To Book |
PER 2023 |
PER 2024 |
13Y Median PER Low |
PER 2025e |
13Y Median PER High |
PER 2026e |
Last Updated |
| 0.6 |
0.8 |
4.1 |
4.7 |
15.9 |
5.6 |
27.9 |
12.3 |
12/11/24 |
OFX Yearly Price Earnings Ratio (PER) Highs and Lows
✅✅
OFX Weekly Price Chart with Average True Range (ATR) Trailing Stop (10-Year View)
Ticker code: OCL
OCL Red Flags & Risk Indicators
✅
⚠️ RED FLAGS: 0 identified
No red flags detected.
Income Statement
| Revenue 2024 Per Share |
Revenue 2025e Per Share |
Revenue 2026e Per Share |
Revenue 24 to 25e [%] |
Revenue 25e to 26e [%] |
EBITDA 2024 Per Share |
EBITDA 2025e Per Share |
EBITDA 2026e Per Share |
EBITDA 24 to 25e [%] |
EBITDA 25e to 26e [%] |
| 1.23554 |
1.29523 |
1.42551 |
4.8 |
10.1 |
0.46614 |
0.4864 |
0.55241 |
4.3 |
13.6 |
OCL Revenue Per Share (2012–2027)
✅
OCL Earnings before Interest, Tax, Depreciation and Amortisation (EBITDA) Per Share (2012–2027)
✅
OCL Normalised Earnings Per Share (EPS) (2012–2027)
✅
Valuation
| Price To Sales |
Price To Book |
PER 2023 |
PER 2024 |
13Y Median PER Low |
PER 2025e |
13Y Median PER High |
PER 2026e |
Last Updated |
| 14.3 |
16.6 |
83.9 |
55.9 |
28.2 |
49.9 |
47.6 |
47.3 |
8/9/25 |
OCL Yearly Price Earnings Ratio (PER) Highs and Lows
❌
OCL Weekly Price Chart with Average True Range (ATR) Trailing Stop (10-Year View)
Ticker code: OBL
OBL Red Flags & Risk Indicators
⚠️
⚠️ RED FLAGS: 1 identified
Income Statement
| Revenue 2024 Per Share |
Revenue 2025e Per Share |
Revenue 2026e Per Share |
Revenue 24 to 25e [%] |
Revenue 25e to 26e [%] |
EBITDA 2024 Per Share |
EBITDA 2025e Per Share |
EBITDA 2026e Per Share |
EBITDA 24 to 25e [%] |
EBITDA 25e to 26e [%] |
| 0.73596 |
2.25779 |
0.40911 |
206.8 |
-81.9 |
0.05045 |
1.85485 |
0.09014 |
3576.8 |
-95.1 |
OBL Revenue Per Share (2012–2027)
✅✅
OBL Earnings before Interest, Tax, Depreciation and Amortisation (EBITDA) Per Share (2012–2027)
✅✅
OBL Normalised Earnings Per Share (EPS) (2012–2027)
✅✅
Valuation
| Price To Sales |
Price To Book |
PER 2023 |
PER 2024 |
13Y Median PER Low |
PER 2025e |
13Y Median PER High |
PER 2026e |
Last Updated |
| 5.2 |
0.7 |
-13.3 |
-5.1 |
14.3 |
1.3 |
21.4 |
-159.5 |
28/9/25 |
OBL Yearly Price Earnings Ratio (PER) Highs and Lows
✅✅
OBL Weekly Price Chart with Average True Range (ATR) Trailing Stop (10-Year View)
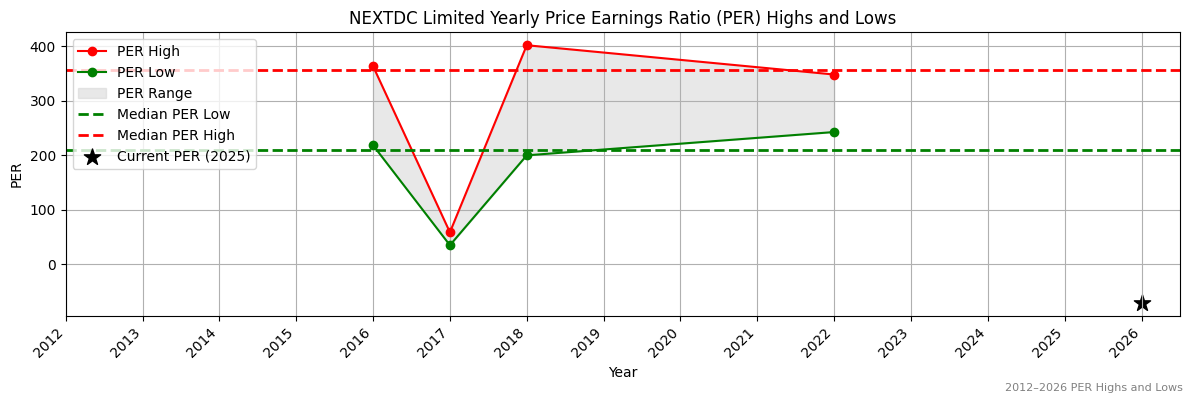
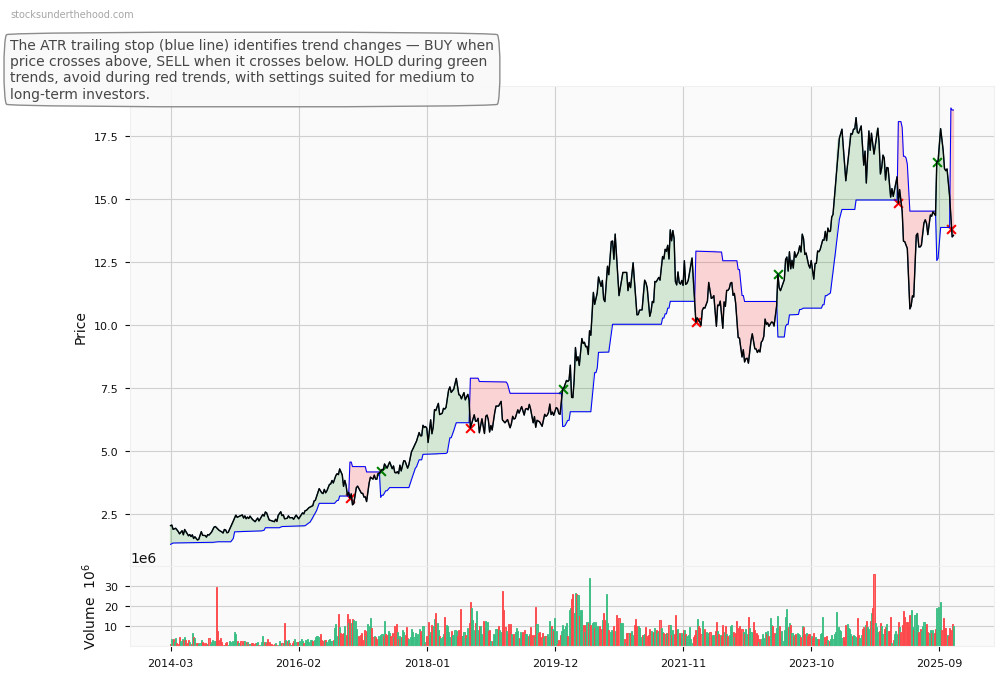
Ticker code: NXT
NXT Red Flags & Risk Indicators
❌
⚠️ RED FLAGS: 5 identified
- Highly Shorted
- Increasing Shorts
- Falling Earnings
- Falling Revenues
- Falling EBITDA Margins
Income Statement
| Revenue 2024 Per Share |
Revenue 2025e Per Share |
Revenue 2026e Per Share |
Revenue 24 to 25e [%] |
Revenue 25e to 26e [%] |
EBITDA 2024 Per Share |
EBITDA 2025e Per Share |
EBITDA 2026e Per Share |
EBITDA 24 to 25e [%] |
EBITDA 25e to 26e [%] |
| 0.67233 |
0.67127 |
0.77899 |
-0.2 |
16.0 |
0.33971 |
0.33544 |
0.3684 |
-1.3 |
9.8 |
NXT Revenue Per Share (2012–2027)
❌
NXT Earnings before Interest, Tax, Depreciation and Amortisation (EBITDA) Per Share (2012–2027)
❌
NXT Normalised Earnings Per Share (EPS) (2012–2027)
❌
Valuation
| Price To Sales |
Price To Book |
PER 2023 |
PER 2024 |
13Y Median PER Low |
PER 2025e |
13Y Median PER High |
PER 2026e |
Last Updated |
| 23.7 |
2.4 |
-525.3 |
-197.0 |
208.8 |
-157.6 |
355.4 |
-82.9 |
20/6/25 |
NXT Yearly Price Earnings Ratio (PER) Highs and Lows
✅✅
NXT Weekly Price Chart with Average True Range (ATR) Trailing Stop (10-Year View)
Ticker code: NXL
NXL Red Flags & Risk Indicators
⚠️
⚠️ RED FLAGS: 2 identified
- Increasing Shorts
- Falling Earnings
Income Statement
| Revenue 2024 Per Share |
Revenue 2025e Per Share |
Revenue 2026e Per Share |
Revenue 24 to 25e [%] |
Revenue 25e to 26e [%] |
EBITDA 2024 Per Share |
EBITDA 2025e Per Share |
EBITDA 2026e Per Share |
EBITDA 24 to 25e [%] |
EBITDA 25e to 26e [%] |
| 0.68197 |
0.73155 |
0.85096 |
7.3 |
16.3 |
0.1727 |
0.18751 |
0.23164 |
8.6 |
23.5 |
NXL Revenue Per Share (2012–2027)
✅
NXL Earnings before Interest, Tax, Depreciation and Amortisation (EBITDA) Per Share (2012–2027)
✅
NXL Normalised Earnings Per Share (EPS) (2012–2027)
✅✅
Valuation
| Price To Sales |
Price To Book |
PER 2023 |
PER 2024 |
13Y Median PER Low |
PER 2025e |
13Y Median PER High |
PER 2026e |
Last Updated |
| 3.7 |
2.8 |
-122.5 |
122.5 |
33.3 |
61.3 |
156.5 |
35.0 |
25/2/25 |
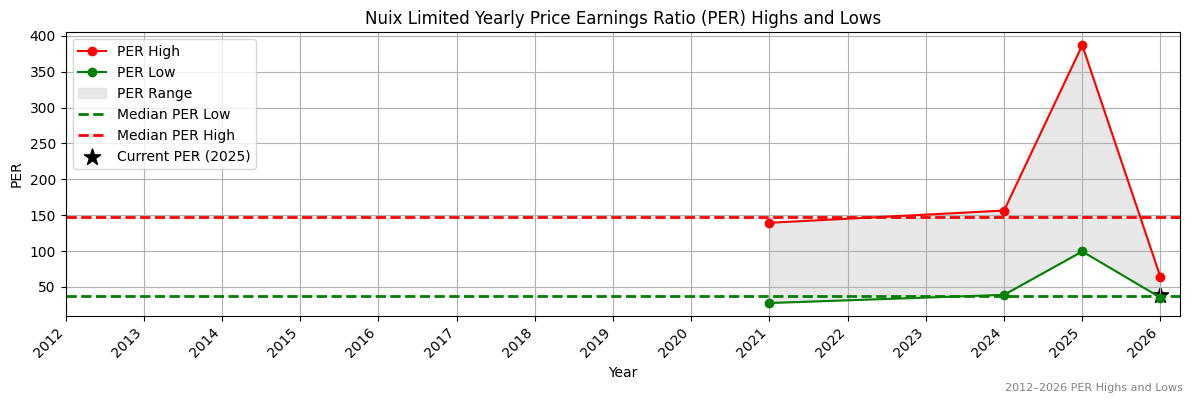
NXL Yearly Price Earnings Ratio (PER) Highs and Lows
✅
NXL Weekly Price Chart with Average True Range (ATR) Trailing Stop (10-Year View)
Ticker code: NXG
NXG Red Flags & Risk Indicators
❌
⚠️ RED FLAGS: 3 identified
- Zero Revenue
- Falling Earnings
- High Price to Book vs ROE
Income Statement
| Revenue 2024 Per Share |
Revenue 2025e Per Share |
Revenue 2026e Per Share |
Revenue 24 to 25e [%] |
Revenue 25e to 26e [%] |
EBITDA 2024 Per Share |
EBITDA 2025e Per Share |
EBITDA 2026e Per Share |
EBITDA 24 to 25e [%] |
EBITDA 25e to 26e [%] |
| None |
None |
None |
None |
None |
-0.11379 |
-0.10317 |
None |
9.3 |
None |
NXG Revenue Per Share (2012–2027)
NXG Earnings before Interest, Tax, Depreciation and Amortisation (EBITDA) Per Share (2012–2027)
✅
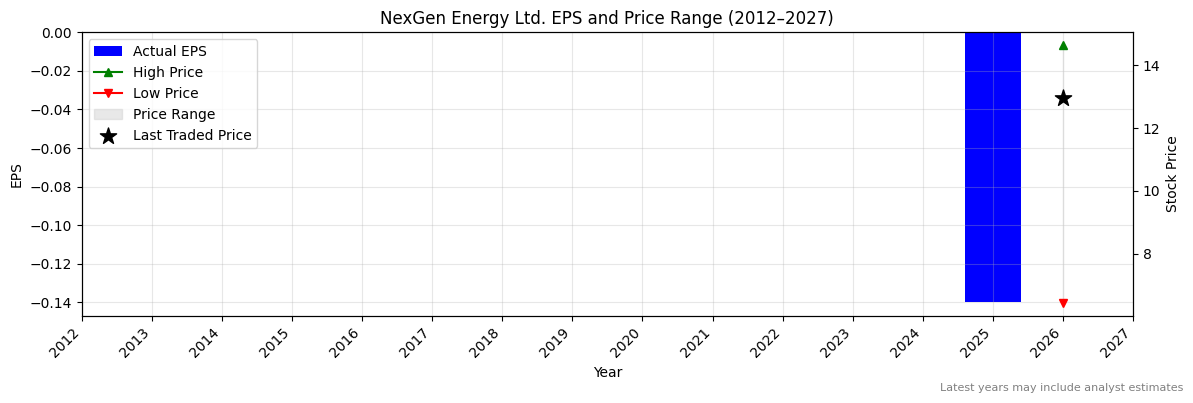
NXG Normalised Earnings Per Share (EPS) (2012–2027)
Valuation
| Price To Sales |
Price To Book |
PER 2023 |
PER 2024 |
13Y Median PER Low |
PER 2025e |
13Y Median PER High |
PER 2026e |
Last Updated |
| None |
8.4 |
None |
None |
None |
-92.8 |
None |
None |
13/11/23 |
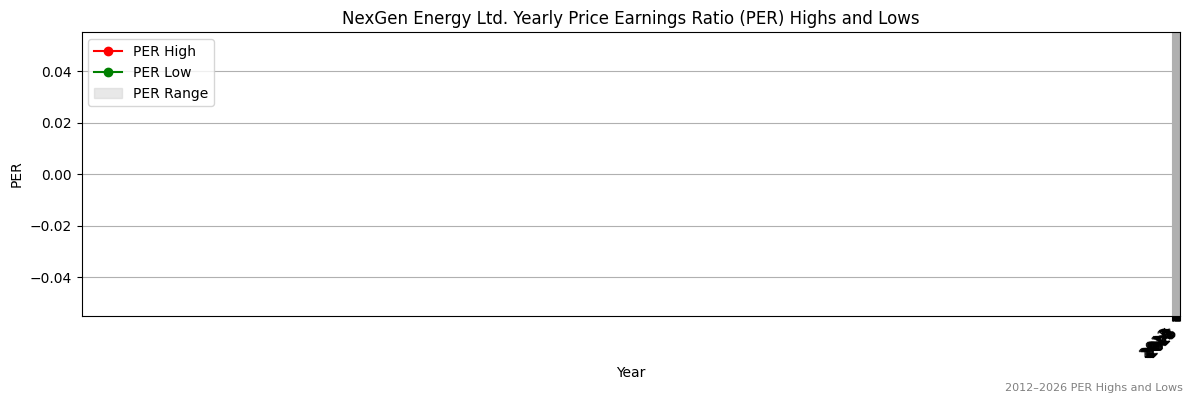
NXG Yearly Price Earnings Ratio (PER) Highs and Lows
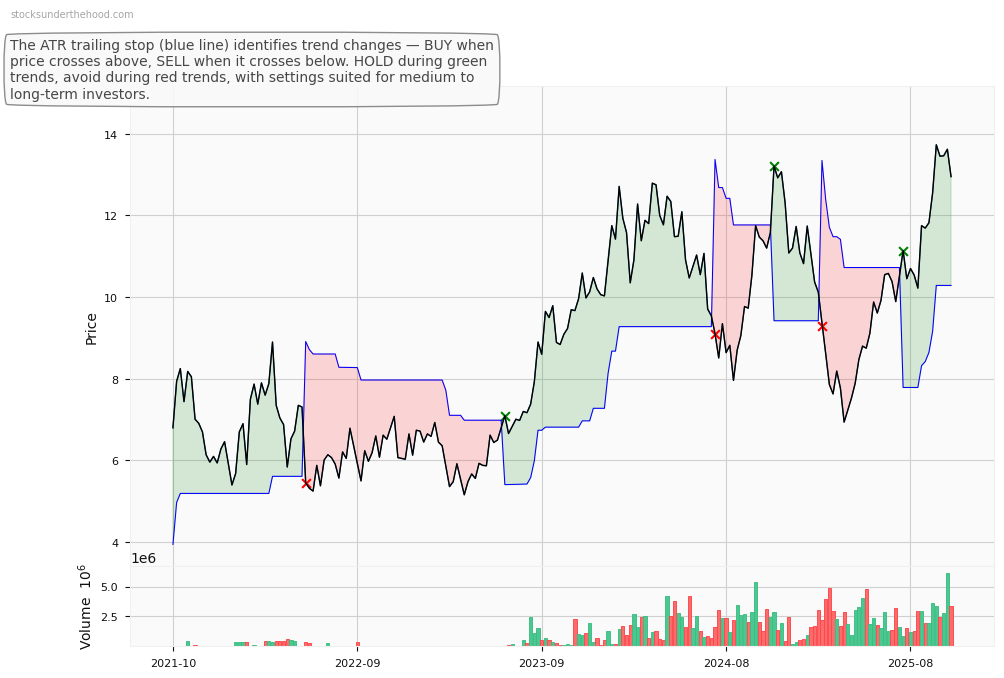
NXG Weekly Price Chart with Average True Range (ATR) Trailing Stop (10-Year View)
Ticker code: NWS
NWS Red Flags & Risk Indicators
✅
⚠️ RED FLAGS: 0 identified
No red flags detected.
Income Statement
| Revenue 2024 Per Share |
Revenue 2025e Per Share |
Revenue 2026e Per Share |
Revenue 24 to 25e [%] |
Revenue 25e to 26e [%] |
EBITDA 2024 Per Share |
EBITDA 2025e Per Share |
EBITDA 2026e Per Share |
EBITDA 24 to 25e [%] |
EBITDA 25e to 26e [%] |
| 17.72408 |
14.85413 |
46.42563 |
-16.2 |
212.5 |
2.70475 |
2.48682 |
8.20663 |
-8.1 |
230.0 |
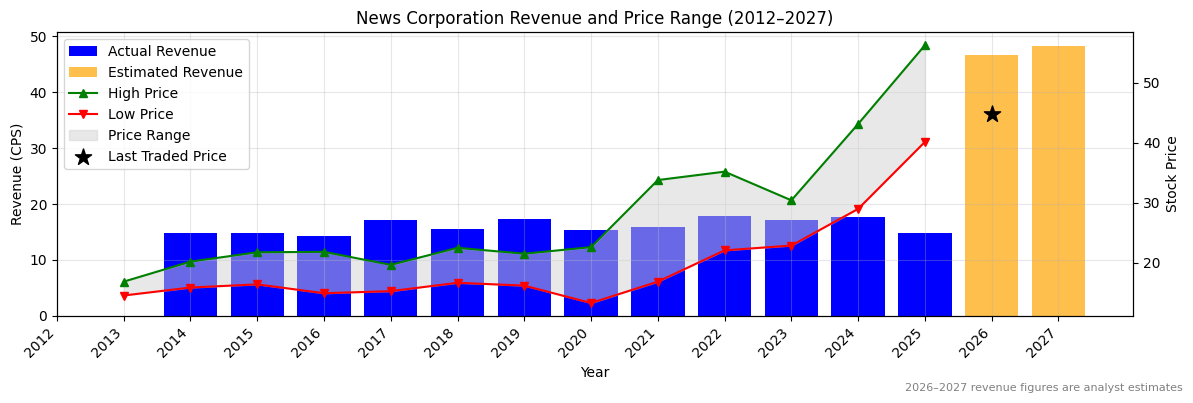
NWS Revenue Per Share (2012–2027)
❌
NWS Earnings before Interest, Tax, Depreciation and Amortisation (EBITDA) Per Share (2012–2027)
❌
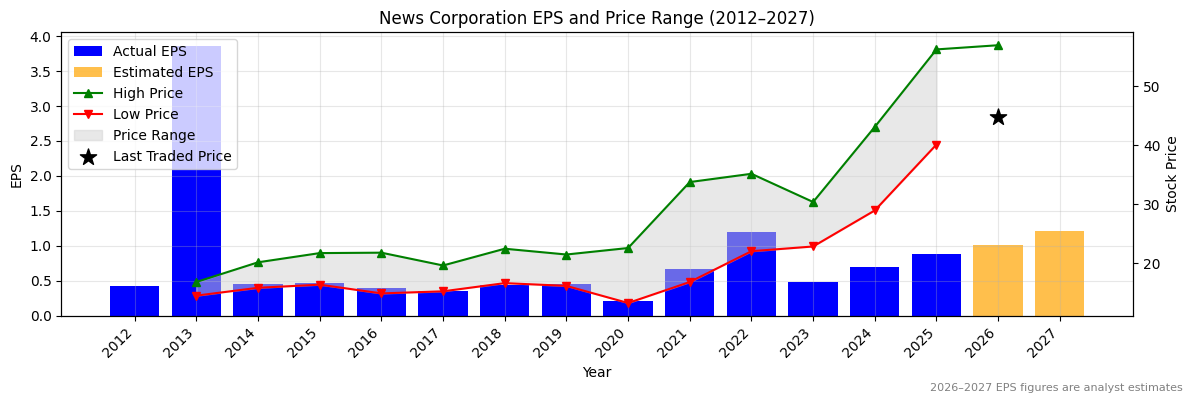
NWS Normalised Earnings Per Share (EPS) (2012–2027)
✅✅
Valuation
| Price To Sales |
Price To Book |
PER 2023 |
PER 2024 |
13Y Median PER Low |
PER 2025e |
13Y Median PER High |
PER 2026e |
Last Updated |
| 2.8 |
3.0 |
94.5 |
66.1 |
37.3 |
52.0 |
52.9 |
45.8 |
29/4/25 |
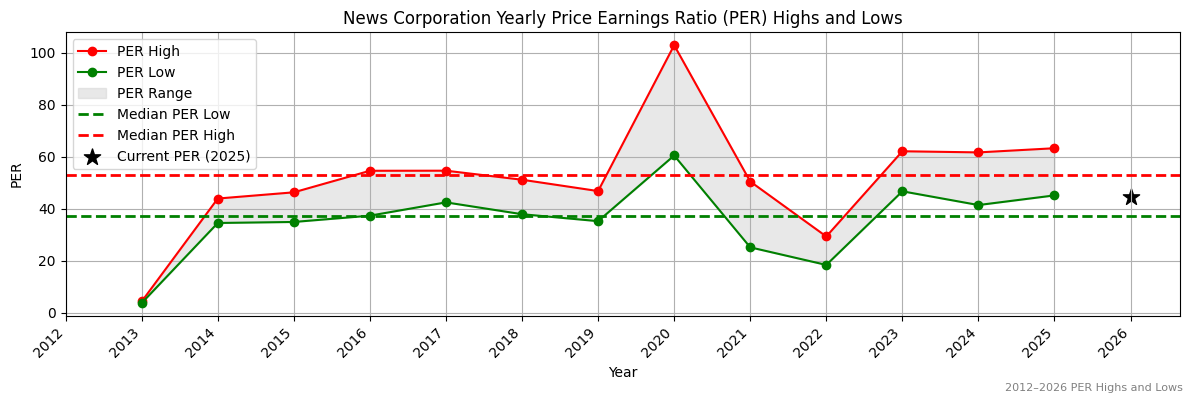
NWS Yearly Price Earnings Ratio (PER) Highs and Lows
✅
NWS Weekly Price Chart with Average True Range (ATR) Trailing Stop (10-Year View)
Ticker code: NWL
NWL Red Flags & Risk Indicators
⚠️
⚠️ RED FLAGS: 1 identified
Income Statement
| Revenue 2024 Per Share |
Revenue 2025e Per Share |
Revenue 2026e Per Share |
Revenue 24 to 25e [%] |
Revenue 25e to 26e [%] |
EBITDA 2024 Per Share |
EBITDA 2025e Per Share |
EBITDA 2026e Per Share |
EBITDA 24 to 25e [%] |
EBITDA 25e to 26e [%] |
| 1.04597 |
1.32665 |
1.58075 |
26.8 |
19.2 |
0.51092 |
0.66729 |
0.79997 |
30.6 |
19.9 |
NWL Revenue Per Share (2012–2027)
✅✅
NWL Earnings before Interest, Tax, Depreciation and Amortisation (EBITDA) Per Share (2012–2027)
✅✅
NWL Normalised Earnings Per Share (EPS) (2012–2027)
✅✅
Valuation
| Price To Sales |
Price To Book |
PER 2023 |
PER 2024 |
13Y Median PER Low |
PER 2025e |
13Y Median PER High |
PER 2026e |
Last Updated |
| 23.3 |
37.9 |
114.2 |
90.7 |
42.7 |
64.2 |
69.6 |
56.1 |
14/9/25 |
NWL Yearly Price Earnings Ratio (PER) Highs and Lows
✅
NWL Weekly Price Chart with Average True Range (ATR) Trailing Stop (10-Year View)
Ticker code: NWH
NWH Red Flags & Risk Indicators
⚠️
⚠️ RED FLAGS: 1 identified
Income Statement
| Revenue 2024 Per Share |
Revenue 2025e Per Share |
Revenue 2026e Per Share |
Revenue 24 to 25e [%] |
Revenue 25e to 26e [%] |
EBITDA 2024 Per Share |
EBITDA 2025e Per Share |
EBITDA 2026e Per Share |
EBITDA 24 to 25e [%] |
EBITDA 25e to 26e [%] |
| 6.40081 |
7.21092 |
7.35385 |
12.7 |
2.0 |
0.73566 |
0.8577 |
0.87593 |
16.6 |
2.1 |
NWH Revenue Per Share (2012–2027)
✅
NWH Earnings before Interest, Tax, Depreciation and Amortisation (EBITDA) Per Share (2012–2027)
✅
NWH Normalised Earnings Per Share (EPS) (2012–2027)
✅
Valuation
| Price To Sales |
Price To Book |
PER 2023 |
PER 2024 |
13Y Median PER Low |
PER 2025e |
13Y Median PER High |
PER 2026e |
Last Updated |
| 0.7 |
3.6 |
20.8 |
17.7 |
6.2 |
17.1 |
13.0 |
16.0 |
29/4/25 |
NWH Yearly Price Earnings Ratio (PER) Highs and Lows
❌
NWH Weekly Price Chart with Average True Range (ATR) Trailing Stop (10-Year View)
Ticker code: NVX
NVX Red Flags & Risk Indicators
⚠️
⚠️ RED FLAGS: 2 identified
- Large Share Issuance
- Falling Earnings
Income Statement
| Revenue 2024 Per Share |
Revenue 2025e Per Share |
Revenue 2026e Per Share |
Revenue 24 to 25e [%] |
Revenue 25e to 26e [%] |
EBITDA 2024 Per Share |
EBITDA 2025e Per Share |
EBITDA 2026e Per Share |
EBITDA 24 to 25e [%] |
EBITDA 25e to 26e [%] |
| 0.03053 |
0.05902 |
0.2617 |
93.3 |
343.4 |
-0.14327 |
-0.10805 |
-0.04909 |
24.6 |
54.6 |
NVX Revenue Per Share (2012–2027)
✅✅
NVX Earnings before Interest, Tax, Depreciation and Amortisation (EBITDA) Per Share (2012–2027)
✅✅
NVX Normalised Earnings Per Share (EPS) (2012–2027)
Valuation
| Price To Sales |
Price To Book |
PER 2023 |
PER 2024 |
13Y Median PER Low |
PER 2025e |
13Y Median PER High |
PER 2026e |
Last Updated |
| 81.4 |
2.5 |
None |
None |
None |
-3.2 |
None |
None |
19/11/24 |
NVX Yearly Price Earnings Ratio (PER) Highs and Lows
NVX Weekly Price Chart with Average True Range (ATR) Trailing Stop (10-Year View)
Ticker code: NVDA
NVDA Red Flags & Risk Indicators
✅
⚠️ RED FLAGS: 0 identified
No red flags detected.
Income Statement
| Revenue 2024 Per Share |
Revenue 2025e Per Share |
Revenue 2026e Per Share |
Revenue 24 to 25e [%] |
Revenue 25e to 26e [%] |
EBITDA 2024 Per Share |
EBITDA 2025e Per Share |
EBITDA 2026e Per Share |
EBITDA 24 to 25e [%] |
EBITDA 25e to 26e [%] |
| 2.4765 |
5.24902 |
8.02617 |
112.0 |
52.9 |
1.40163 |
3.38687 |
5.22775 |
141.6 |
54.4 |
NVDA Revenue Per Share (2012–2027)
✅✅
NVDA Earnings before Interest, Tax, Depreciation and Amortisation (EBITDA) Per Share (2012–2027)
✅✅
NVDA Normalised Earnings Per Share (EPS) (2012–2027)
✅✅
Valuation
| Price To Sales |
Price To Book |
PER 2023 |
PER 2024 |
13Y Median PER Low |
PER 2025e |
13Y Median PER High |
PER 2026e |
Last Updated |
| 29.9 |
49.3 |
614.8 |
156.1 |
22.6 |
68.8 |
50.0 |
45.8 |
22/4/25 |
NVDA Yearly Price Earnings Ratio (PER) Highs and Lows
❌
NVDA Weekly Price Chart with Average True Range (ATR) Trailing Stop (10-Year View)
Ticker code: NUF
NUF Red Flags & Risk Indicators
⚠️
⚠️ RED FLAGS: 2 identified
- Increasing Shorts
- Falling Earnings
Income Statement
| Revenue 2024 Per Share |
Revenue 2025e Per Share |
Revenue 2026e Per Share |
Revenue 24 to 25e [%] |
Revenue 25e to 26e [%] |
EBITDA 2024 Per Share |
EBITDA 2025e Per Share |
EBITDA 2026e Per Share |
EBITDA 24 to 25e [%] |
EBITDA 25e to 26e [%] |
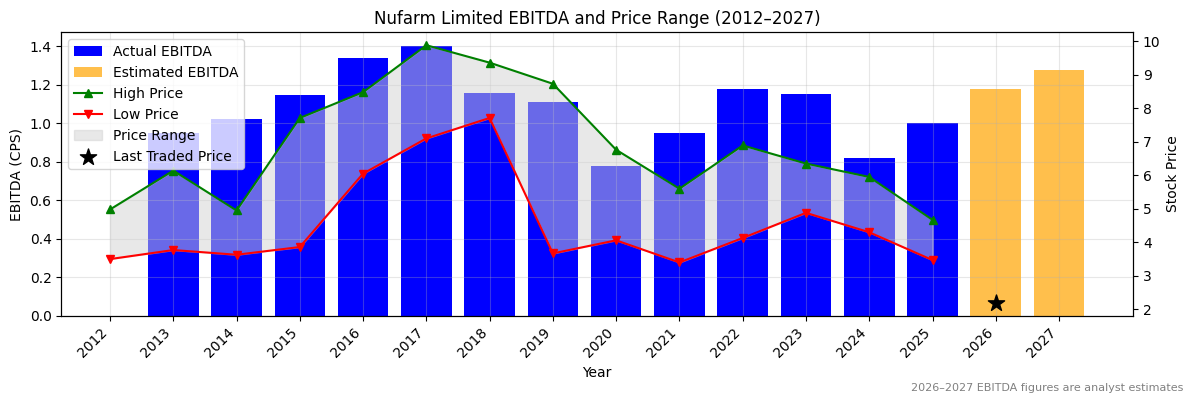
| 8.76351 |
9.42255 |
10.1552 |
7.5 |
7.8 |
0.81912 |
1.0023 |
1.17611 |
22.4 |
17.3 |
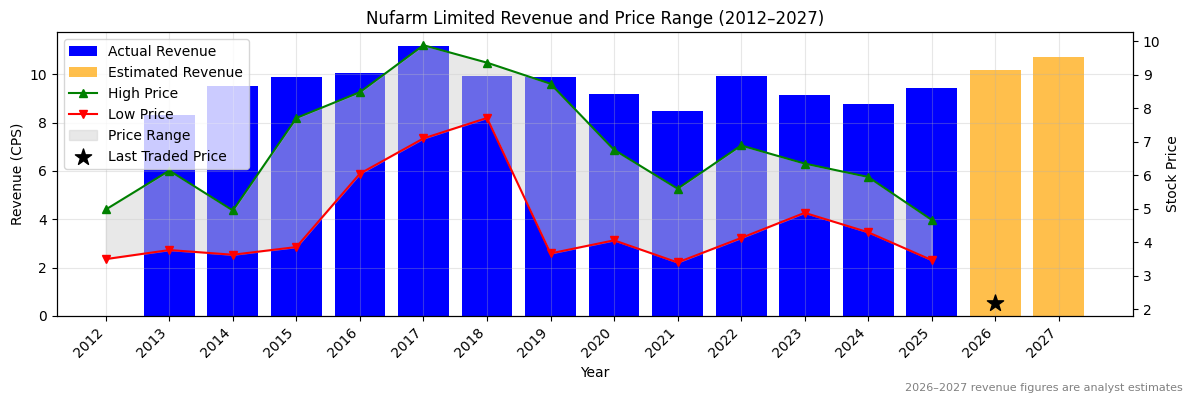
NUF Revenue Per Share (2012–2027)
✅
NUF Earnings before Interest, Tax, Depreciation and Amortisation (EBITDA) Per Share (2012–2027)
✅✅
NUF Normalised Earnings Per Share (EPS) (2012–2027)
✅✅
Valuation
| Price To Sales |
Price To Book |
PER 2023 |
PER 2024 |
13Y Median PER Low |
PER 2025e |
13Y Median PER High |
PER 2026e |
Last Updated |
| 0.2 |
0.4 |
7.2 |
-34.7 |
15.1 |
10.4 |
22.4 |
6.1 |
4/3/25 |
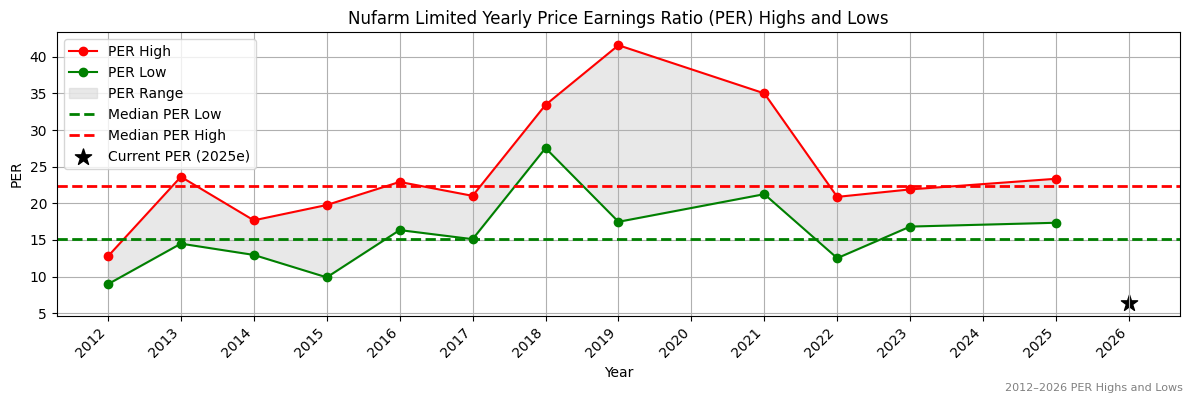
NUF Yearly Price Earnings Ratio (PER) Highs and Lows
✅✅
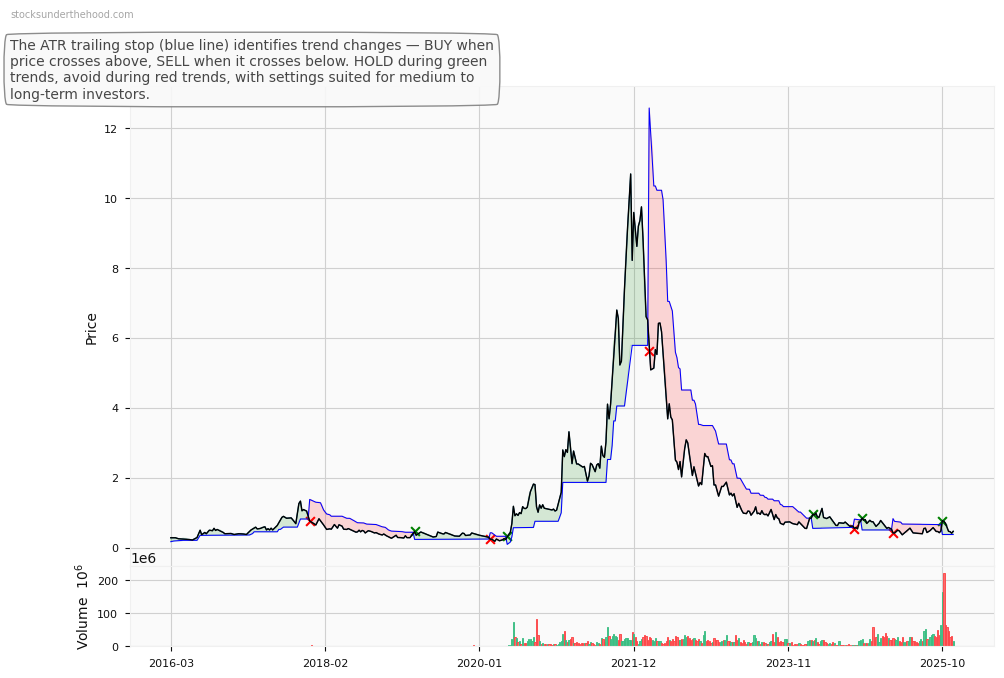
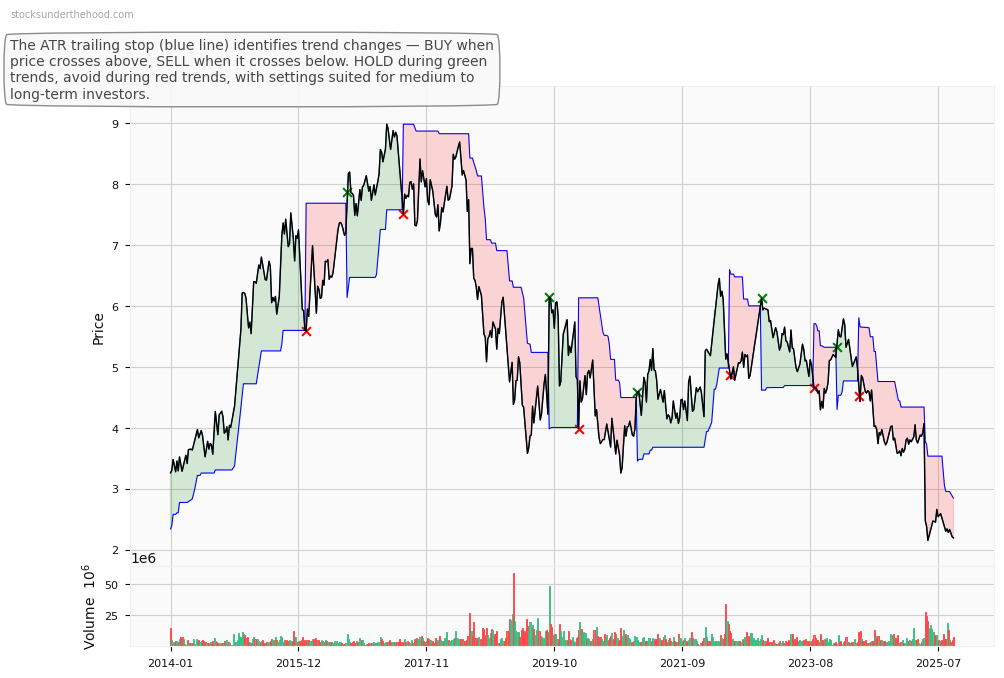
NUF Weekly Price Chart with Average True Range (ATR) Trailing Stop (10-Year View)
Ticker code: NU
NU Red Flags & Risk Indicators
✅
⚠️ RED FLAGS: 0 identified
No red flags detected.
Income Statement
| Revenue 2024 Per Share |
Revenue 2025e Per Share |
Revenue 2026e Per Share |
Revenue 24 to 25e [%] |
Revenue 25e to 26e [%] |
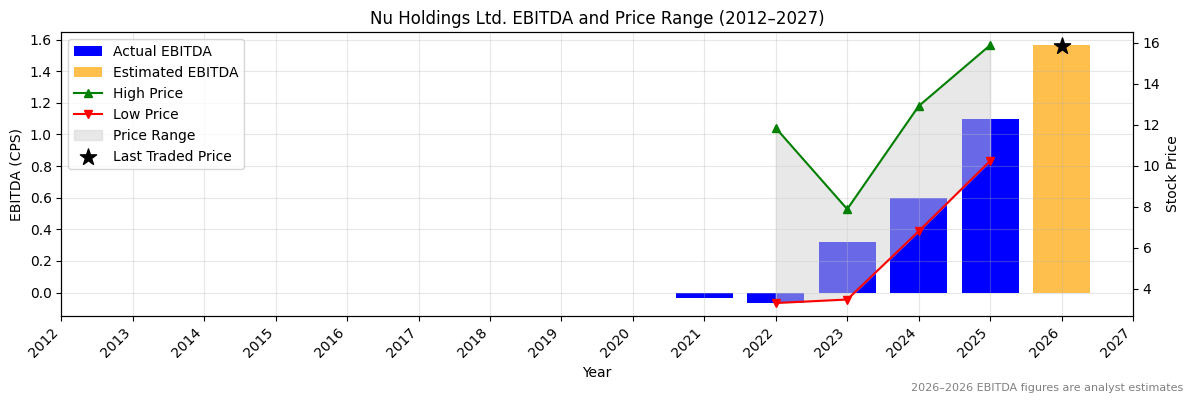
EBITDA 2024 Per Share |
EBITDA 2025e Per Share |
EBITDA 2026e Per Share |
EBITDA 24 to 25e [%] |
EBITDA 25e to 26e [%] |
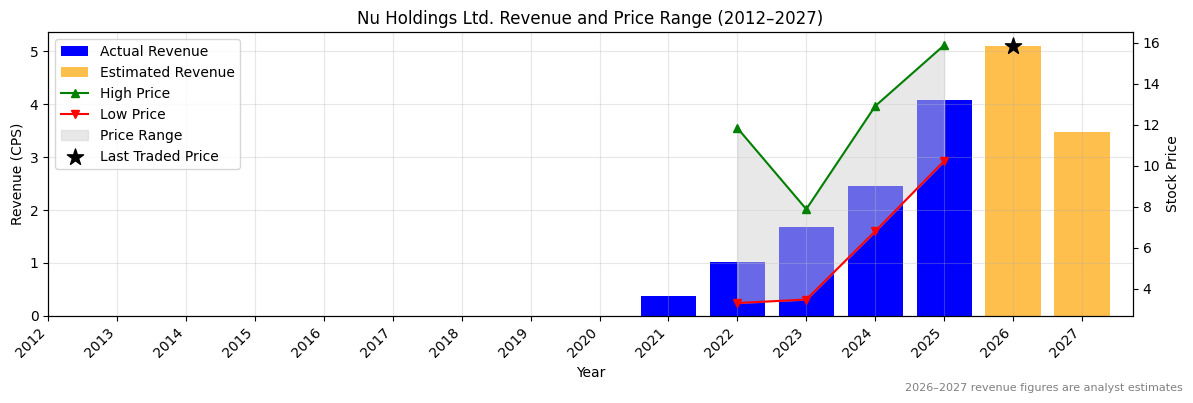
| 2.46369 |
4.08432 |
5.10489 |
65.8 |
25.0 |
0.59816 |
1.09937 |
1.56407 |
83.8 |
42.3 |
NU Revenue Per Share (2012–2027)
✅✅
NU Earnings before Interest, Tax, Depreciation and Amortisation (EBITDA) Per Share (2012–2027)
✅✅
NU Normalised Earnings Per Share (EPS) (2012–2027)
✅✅
Valuation
| Price To Sales |
Price To Book |
PER 2023 |
PER 2024 |
13Y Median PER Low |
PER 2025e |
13Y Median PER High |
PER 2026e |
Last Updated |
| 13.3 |
8.1 |
66.9 |
36.5 |
16.3 |
26.8 |
29.4 |
19.6 |
9/2/25 |
NU Yearly Price Earnings Ratio (PER) Highs and Lows
✅
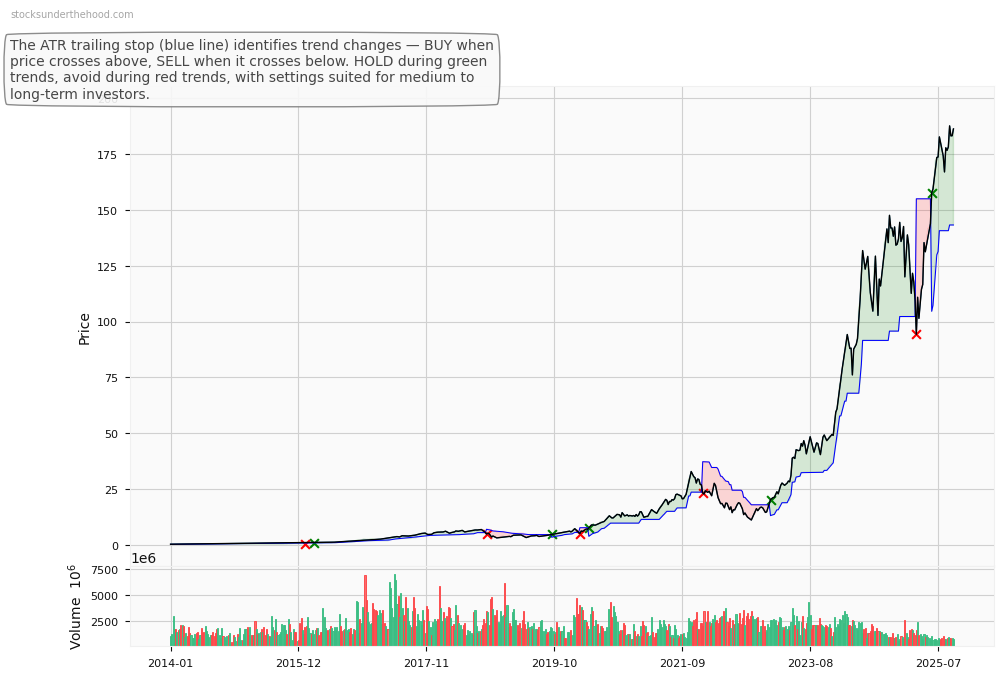
NU Weekly Price Chart with Average True Range (ATR) Trailing Stop (10-Year View)