Ticker code: NST
NST Red Flags & Risk Indicators
⚠️
⚠️ RED FLAGS: 1 identified
Income Statement
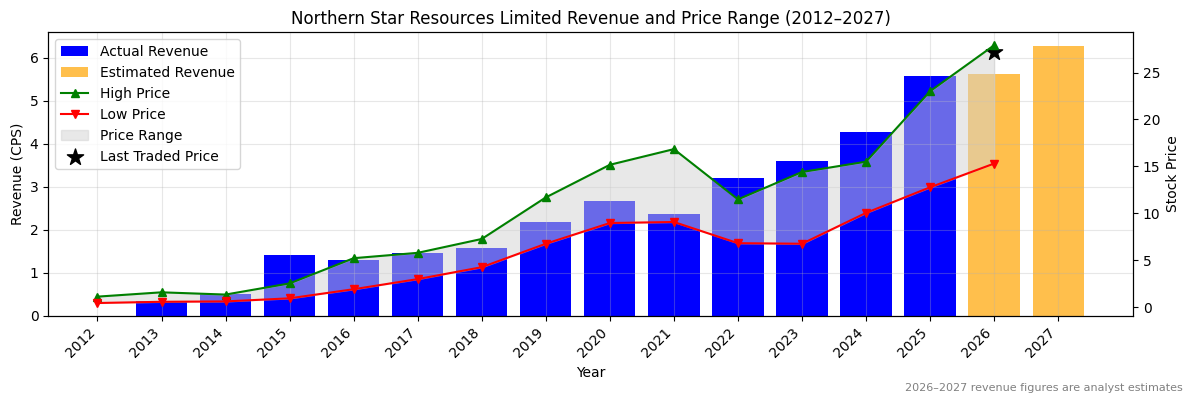
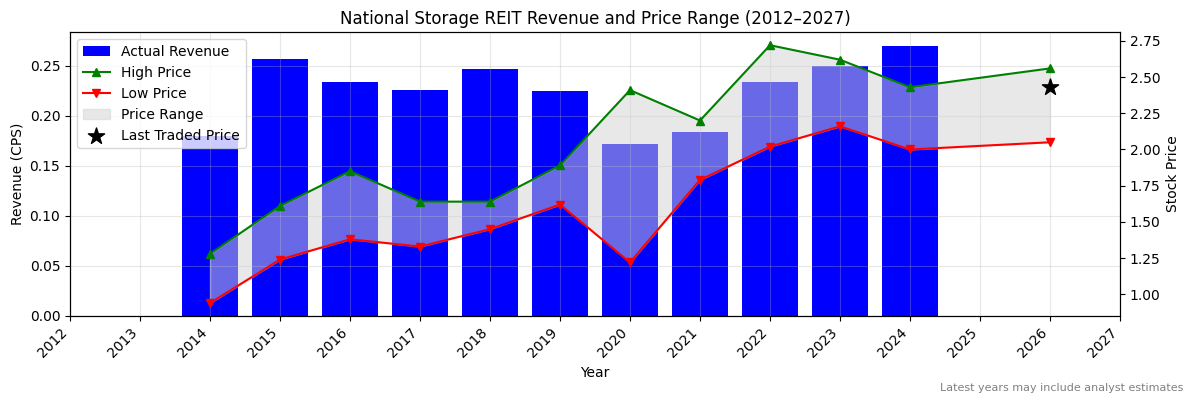
| Revenue 2024 Per Share |
Revenue 2025e Per Share |
Revenue 2026e Per Share |
Revenue 24 to 25e [%] |
Revenue 25e to 26e [%] |
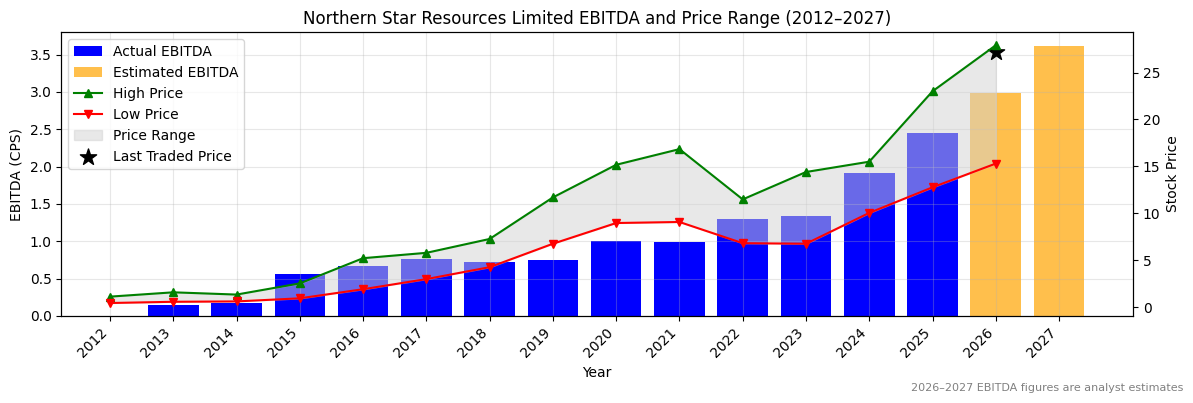
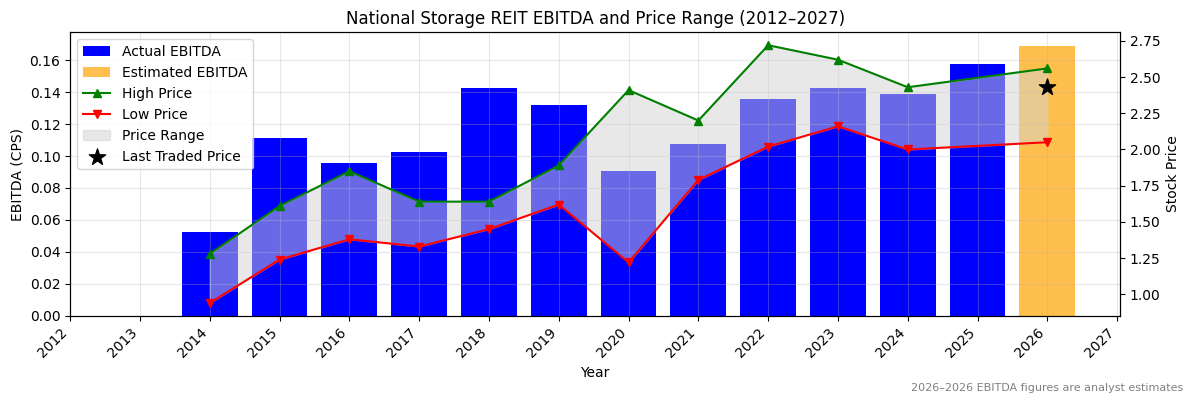
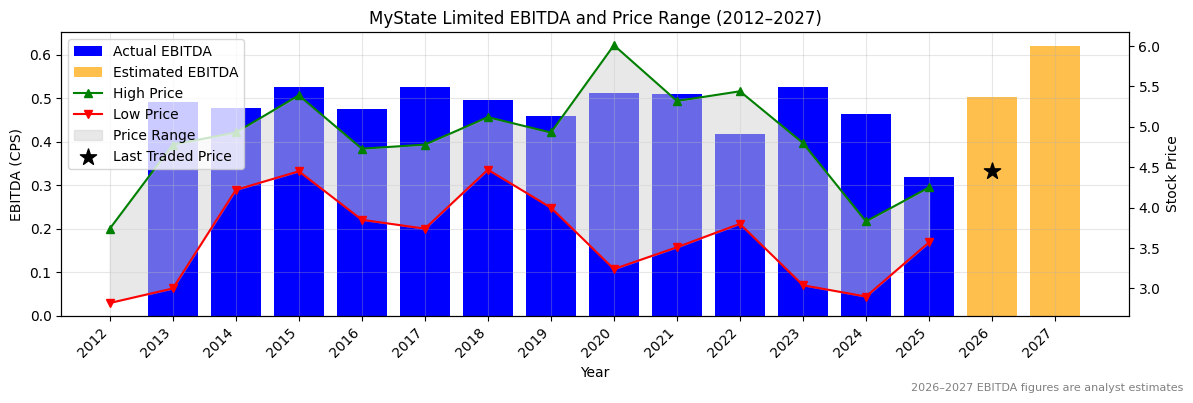
EBITDA 2024 Per Share |
EBITDA 2025e Per Share |
EBITDA 2026e Per Share |
EBITDA 24 to 25e [%] |
EBITDA 25e to 26e [%] |
| 4.28228 |
5.5797 |
5.62234 |
30.3 |
0.8 |
1.90767 |
2.45117 |
2.98249 |
28.5 |
21.7 |
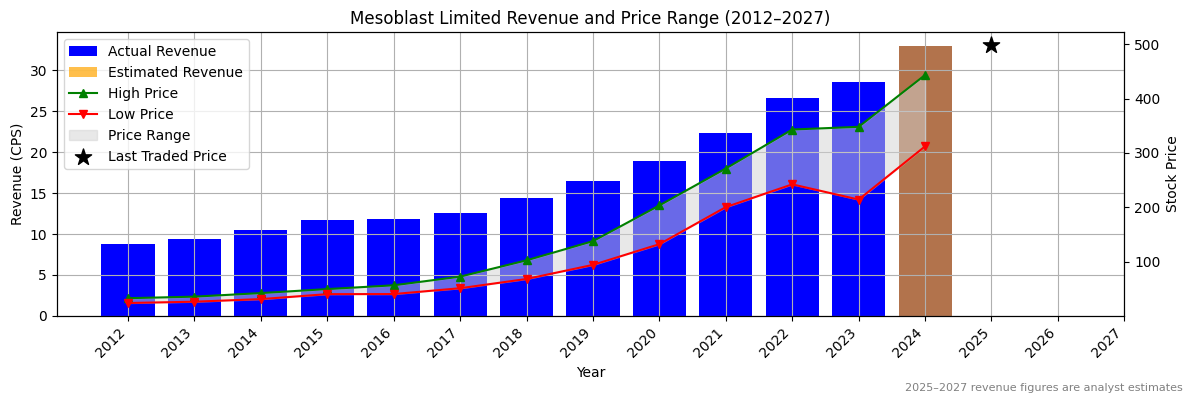
NST Revenue Per Share (2012–2027)
✅✅
NST Earnings before Interest, Tax, Depreciation and Amortisation (EBITDA) Per Share (2012–2027)
✅✅
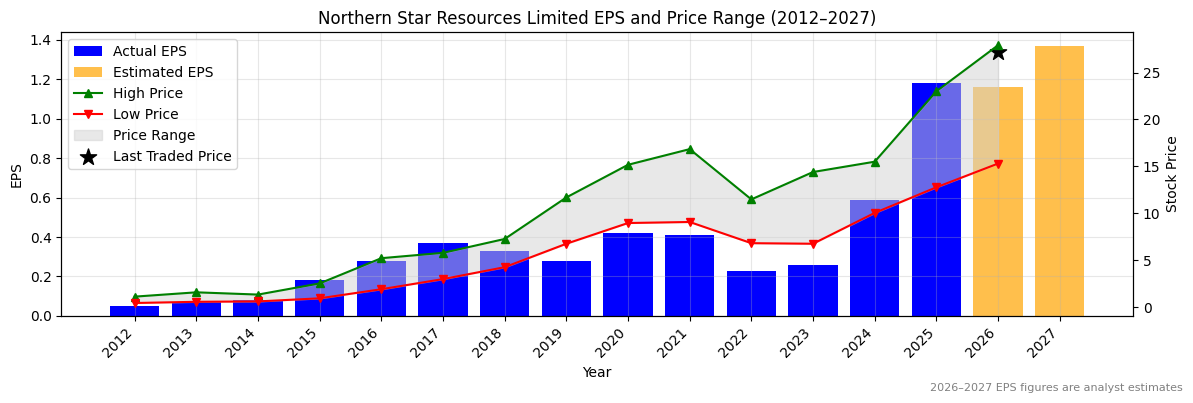
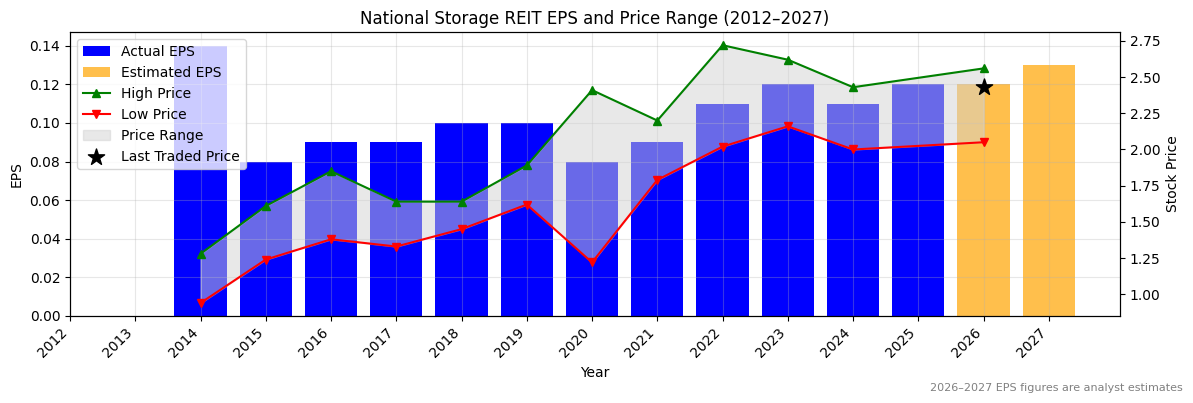
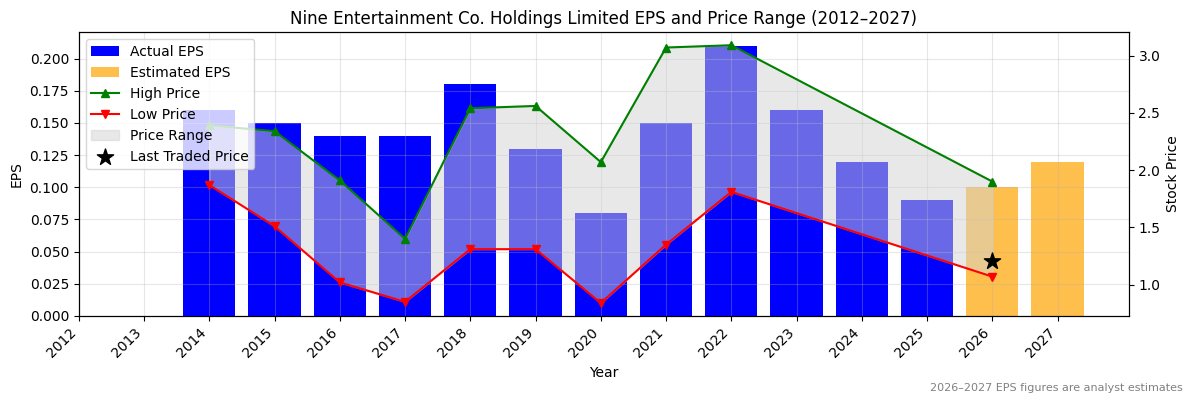
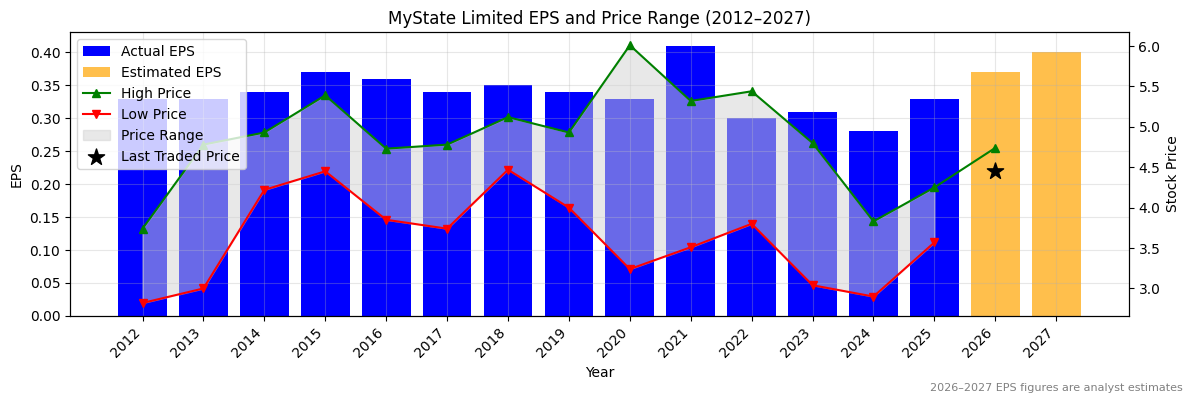
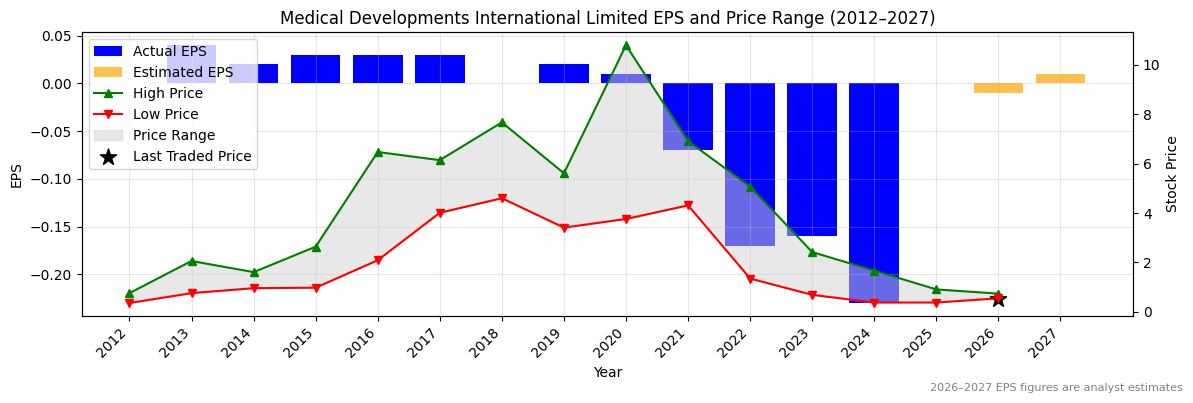
NST Normalised Earnings Per Share (EPS) (2012–2027)
✅✅
Valuation
| Price To Sales |
Price To Book |
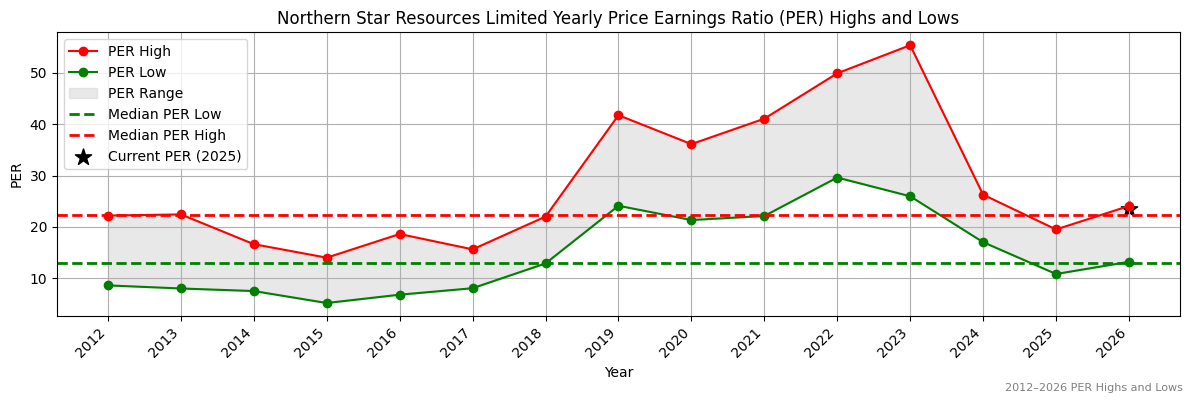
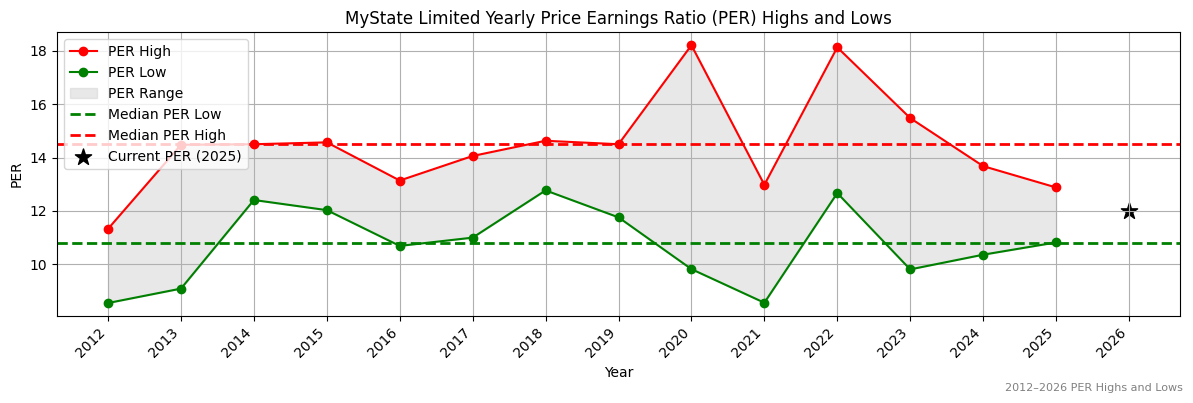
PER 2023 |
PER 2024 |
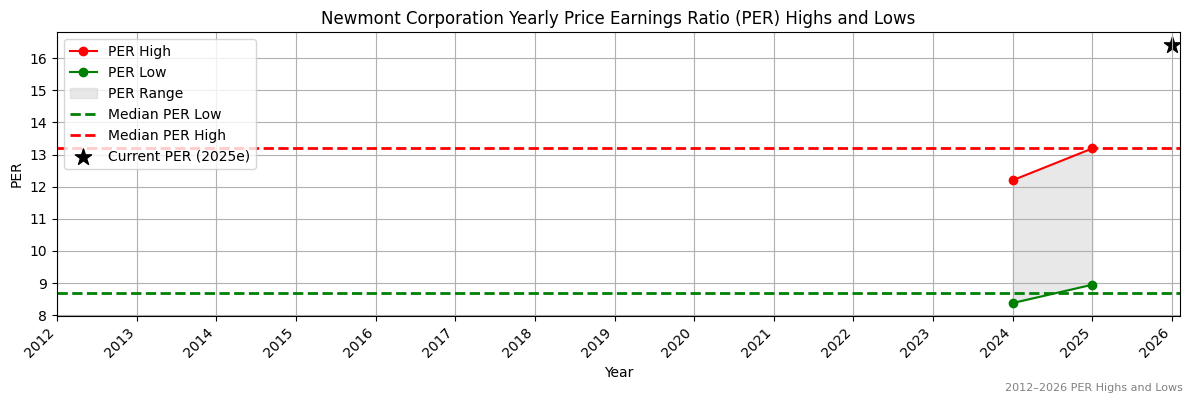
13Y Median PER Low |
PER 2025e |
13Y Median PER High |
PER 2026e |
Last Updated |
| 5.5 |
2.4 |
94.7 |
41.7 |
12.9 |
20.9 |
22.4 |
21.2 |
4/10/25 |
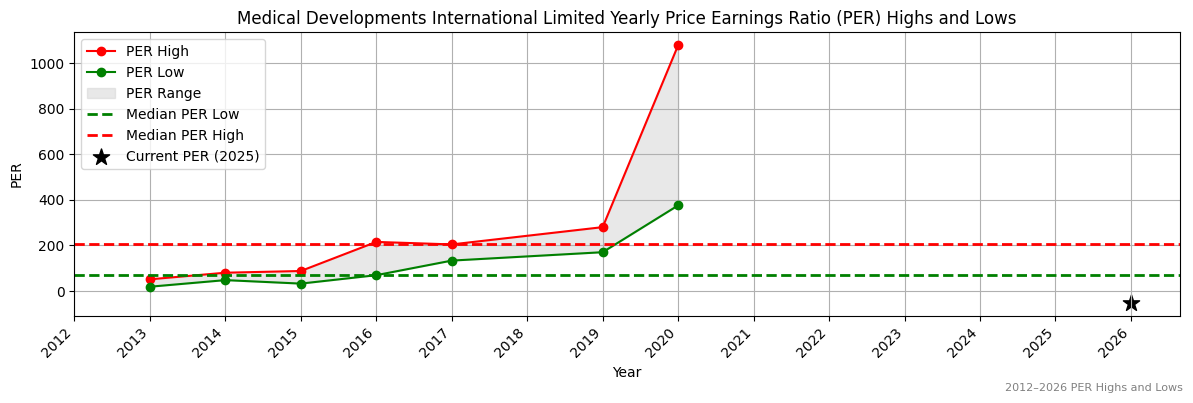
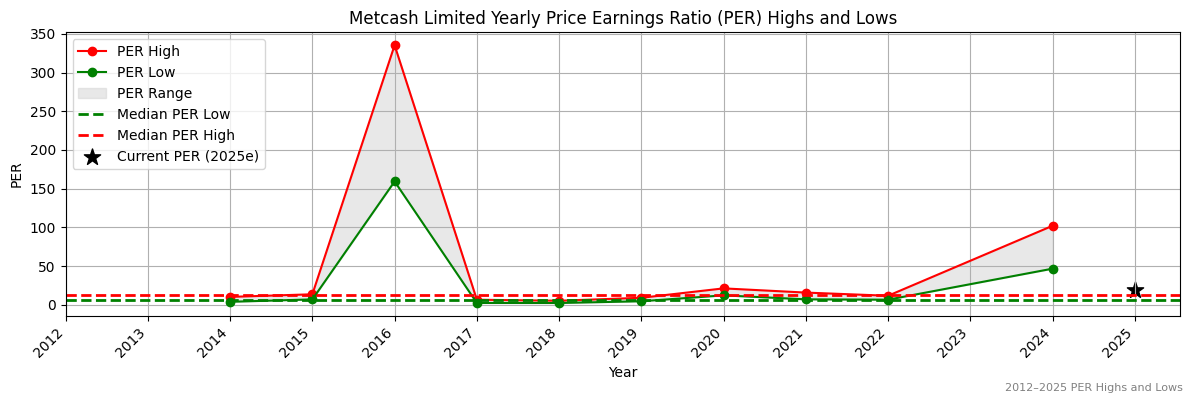
NST Yearly Price Earnings Ratio (PER) Highs and Lows
✅
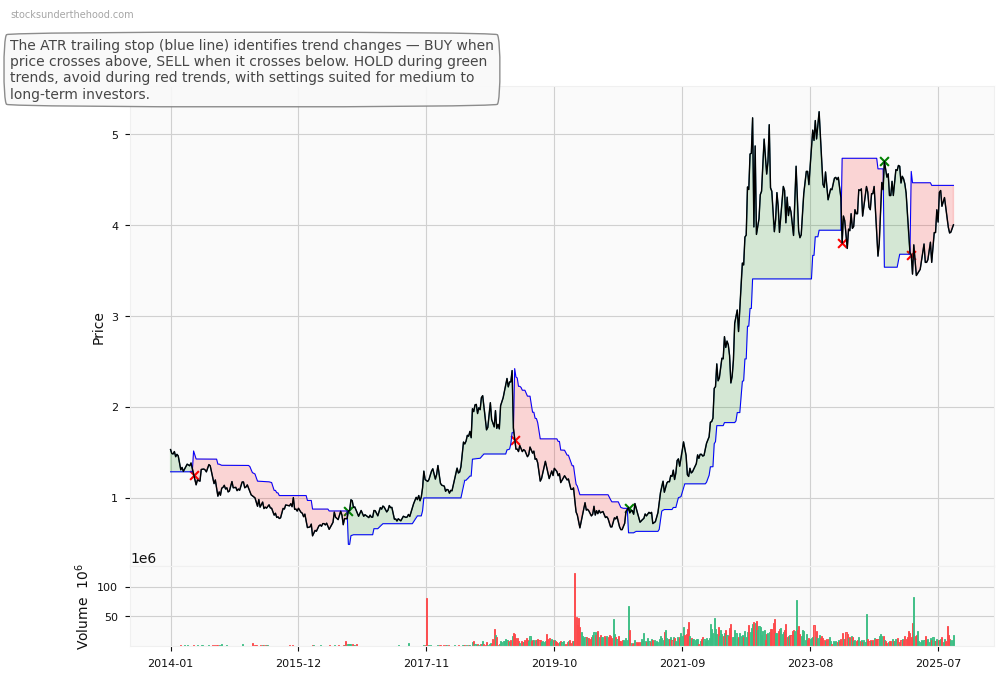
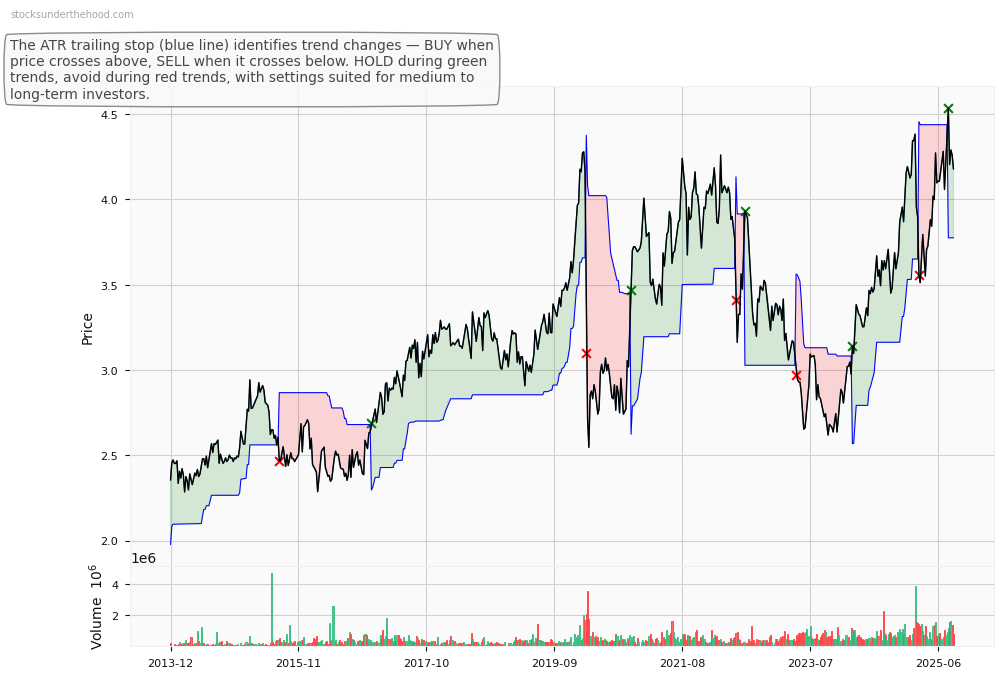
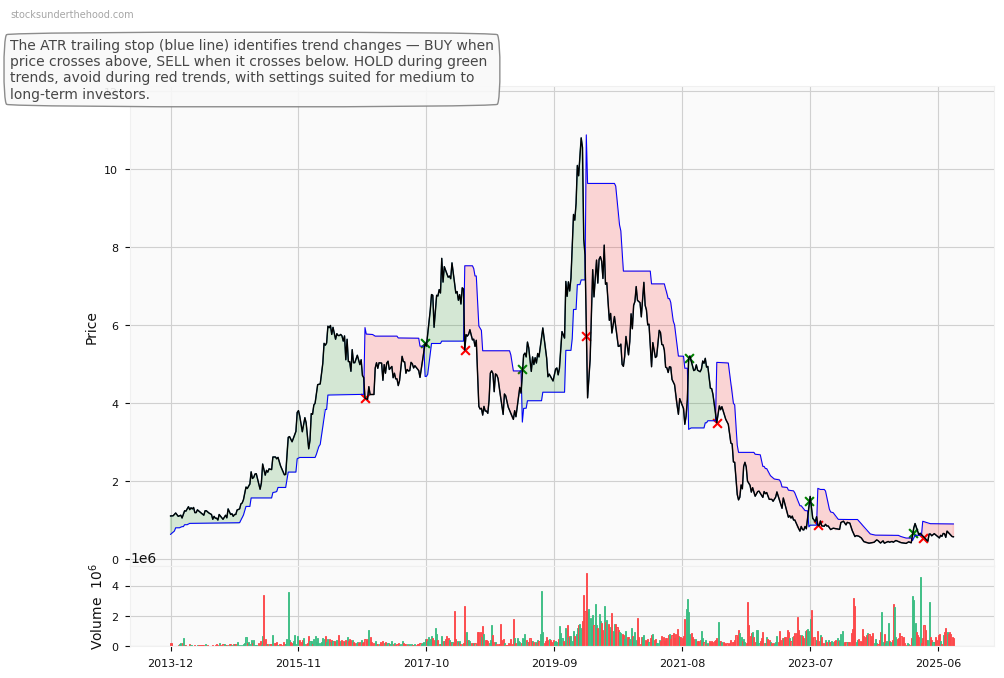
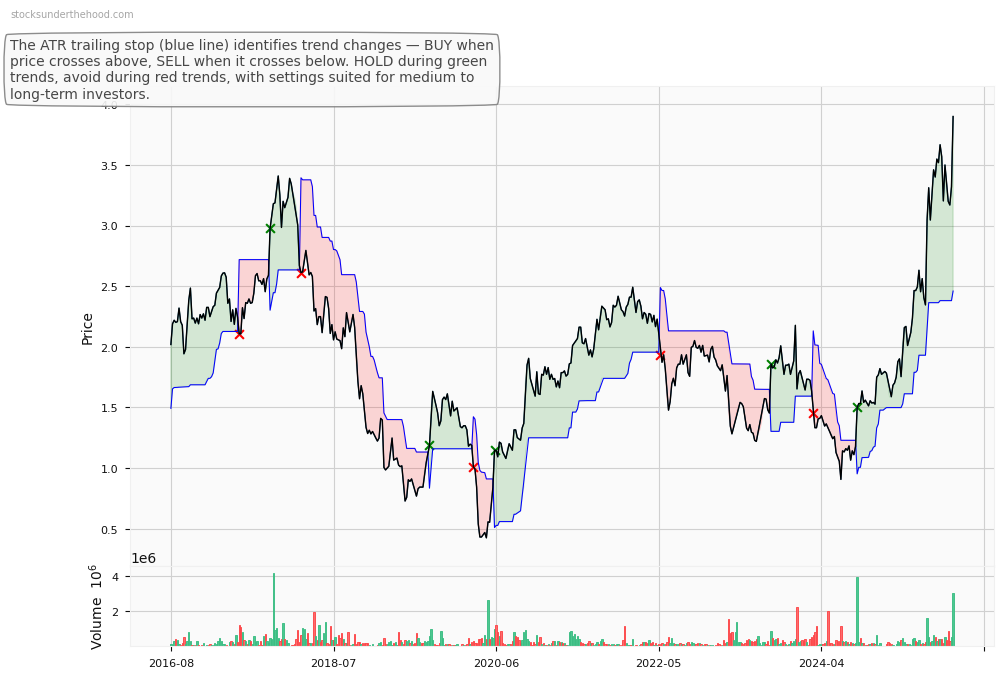
NST Weekly Price Chart with Average True Range (ATR) Trailing Stop (10-Year View)
Ticker code: NSR
NSR Red Flags & Risk Indicators
⚠️
⚠️ RED FLAGS: 1 identified
- More Net Debt Than Equity
Income Statement
| Revenue 2024 Per Share |
Revenue 2025e Per Share |
Revenue 2026e Per Share |
Revenue 24 to 25e [%] |
Revenue 25e to 26e [%] |
EBITDA 2024 Per Share |
EBITDA 2025e Per Share |
EBITDA 2026e Per Share |
EBITDA 24 to 25e [%] |
EBITDA 25e to 26e [%] |
| 0.26984 |
None |
None |
None |
None |
0.1388 |
0.15741 |
0.16887 |
13.4 |
7.3 |
NSR Revenue Per Share (2012–2027)
NSR Earnings before Interest, Tax, Depreciation and Amortisation (EBITDA) Per Share (2012–2027)
✅
NSR Normalised Earnings Per Share (EPS) (2012–2027)
✅
Valuation
| Price To Sales |
Price To Book |
PER 2023 |
PER 2024 |
13Y Median PER Low |
PER 2025e |
13Y Median PER High |
PER 2026e |
Last Updated |
| 8.3 |
9.5 |
19.2 |
20.9 |
15.9 |
19.2 |
20.9 |
19.2 |
2/11/24 |
NSR Yearly Price Earnings Ratio (PER) Highs and Lows
✅
NSR Weekly Price Chart with Average True Range (ATR) Trailing Stop (10-Year View)
Ticker code: NIC
NIC Red Flags & Risk Indicators
❌
⚠️ RED FLAGS: 3 identified
- Increasing Shorts
- Falling Earnings
- Falling Revenues
Income Statement
| Revenue 2024 Per Share |
Revenue 2025e Per Share |
Revenue 2026e Per Share |
Revenue 24 to 25e [%] |
Revenue 25e to 26e [%] |
EBITDA 2024 Per Share |
EBITDA 2025e Per Share |
EBITDA 2026e Per Share |
EBITDA 24 to 25e [%] |
EBITDA 25e to 26e [%] |
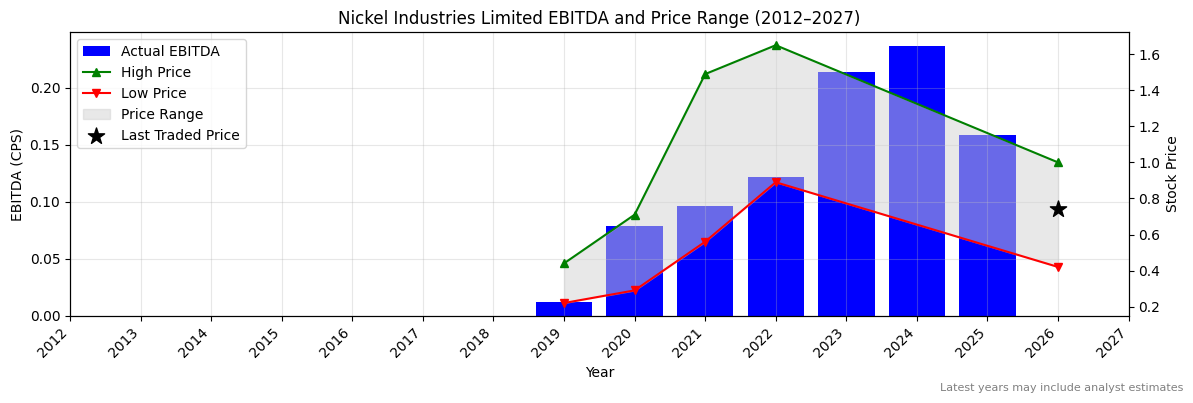
| 0.80619 |
None |
None |
None |
None |
0.23658 |
0.15853 |
None |
-33.0 |
None |
NIC Revenue Per Share (2012–2027)
NIC Earnings before Interest, Tax, Depreciation and Amortisation (EBITDA) Per Share (2012–2027)
❌
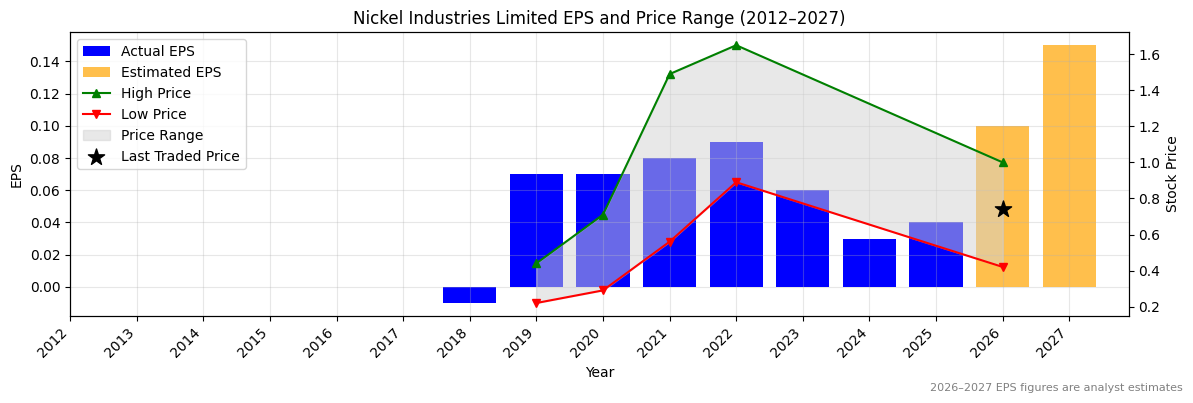
NIC Normalised Earnings Per Share (EPS) (2012–2027)
✅✅
Valuation
| Price To Sales |
Price To Book |
PER 2023 |
PER 2024 |
13Y Median PER Low |
PER 2025e |
13Y Median PER High |
PER 2026e |
Last Updated |
| 1.9 |
1.5 |
12.3 |
24.7 |
4.2 |
18.5 |
10.1 |
7.4 |
27/6/23 |
NIC Yearly Price Earnings Ratio (PER) Highs and Lows
❌
NIC Weekly Price Chart with Average True Range (ATR) Trailing Stop (10-Year View)
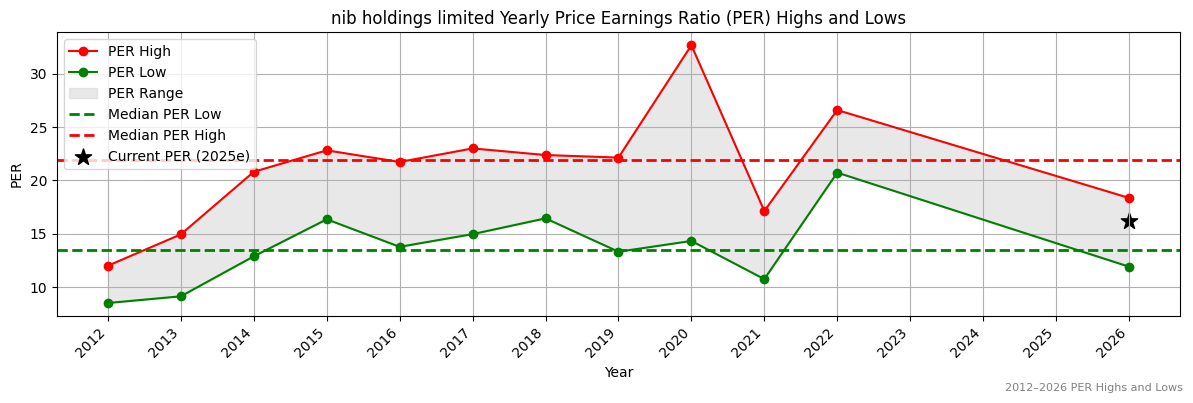
Ticker code: NHF
NHF Red Flags & Risk Indicators
⚠️
⚠️ RED FLAGS: 2 identified
- Low Operating Margin
- Falling Earnings
Income Statement
| Revenue 2024 Per Share |
Revenue 2025e Per Share |
Revenue 2026e Per Share |
Revenue 24 to 25e [%] |
Revenue 25e to 26e [%] |
EBITDA 2024 Per Share |
EBITDA 2025e Per Share |
EBITDA 2026e Per Share |
EBITDA 24 to 25e [%] |
EBITDA 25e to 26e [%] |
| 7.0979 |
None |
None |
None |
None |
0.6772 |
0.62667 |
None |
-7.5 |
None |
NHF Revenue Per Share (2012–2027)
NHF Earnings before Interest, Tax, Depreciation and Amortisation (EBITDA) Per Share (2012–2027)
❌
NHF Normalised Earnings Per Share (EPS) (2012–2027)
❌
Valuation
| Price To Sales |
Price To Book |
PER 2023 |
PER 2024 |
13Y Median PER Low |
PER 2025e |
13Y Median PER High |
PER 2026e |
Last Updated |
| 1.0 |
3.3 |
17.5 |
16.8 |
13.5 |
18.0 |
21.9 |
16.8 |
29/3/24 |
NHF Yearly Price Earnings Ratio (PER) Highs and Lows
✅
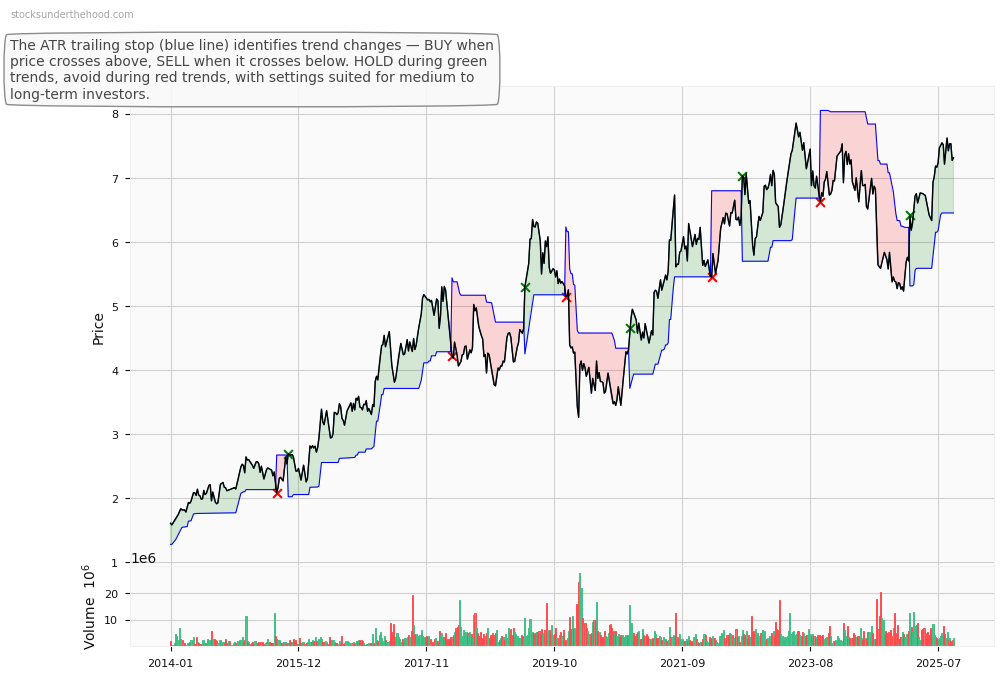
NHF Weekly Price Chart with Average True Range (ATR) Trailing Stop (10-Year View)
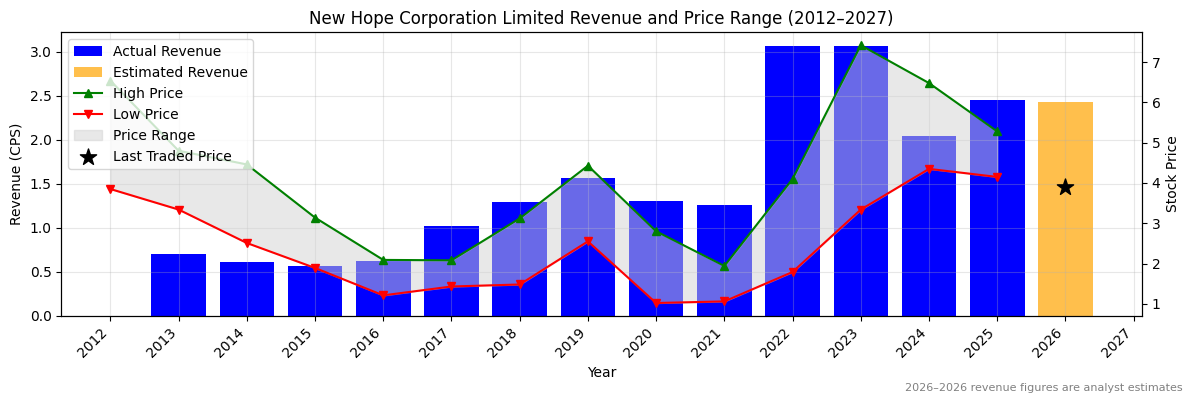
Ticker code: NHC
NHC Red Flags & Risk Indicators
❌
⚠️ RED FLAGS: 3 identified
- Highly Shorted
- Falling Earnings
- Falling EBITDA Margins
Income Statement
| Revenue 2024 Per Share |
Revenue 2025e Per Share |
Revenue 2026e Per Share |
Revenue 24 to 25e [%] |
Revenue 25e to 26e [%] |
EBITDA 2024 Per Share |
EBITDA 2025e Per Share |
EBITDA 2026e Per Share |
EBITDA 24 to 25e [%] |
EBITDA 25e to 26e [%] |
| 2.0424 |
2.44964 |
2.42758 |
19.9 |
-0.9 |
1.01815 |
1.16424 |
1.02994 |
14.3 |
-11.5 |
NHC Revenue Per Share (2012–2027)
✅
NHC Earnings before Interest, Tax, Depreciation and Amortisation (EBITDA) Per Share (2012–2027)
✅
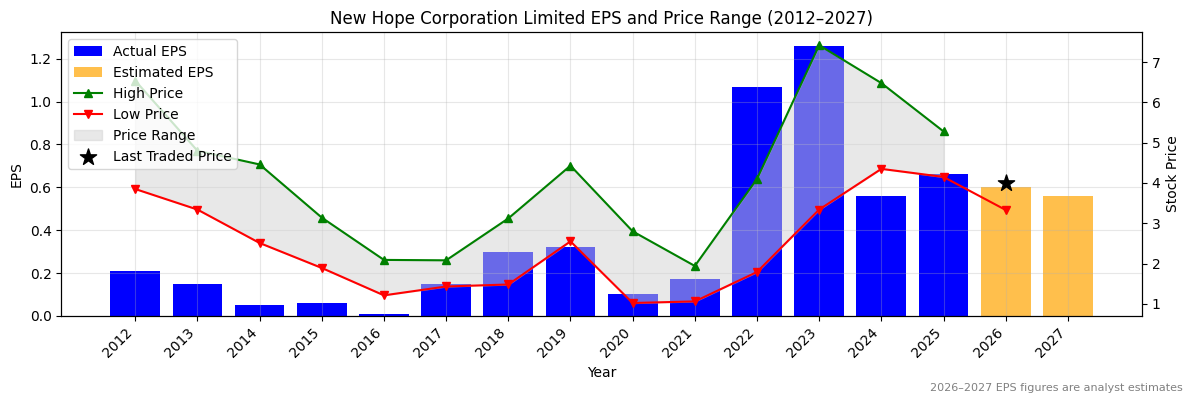
NHC Normalised Earnings Per Share (EPS) (2012–2027)
✅
Valuation
| Price To Sales |
Price To Book |
PER 2023 |
PER 2024 |
13Y Median PER Low |
PER 2025e |
13Y Median PER High |
PER 2026e |
Last Updated |
| 1.9 |
1.3 |
3.3 |
7.4 |
8.0 |
6.3 |
13.9 |
6.9 |
25/7/24 |
NHC Yearly Price Earnings Ratio (PER) Highs and Lows
✅✅
NHC Weekly Price Chart with Average True Range (ATR) Trailing Stop (10-Year View)
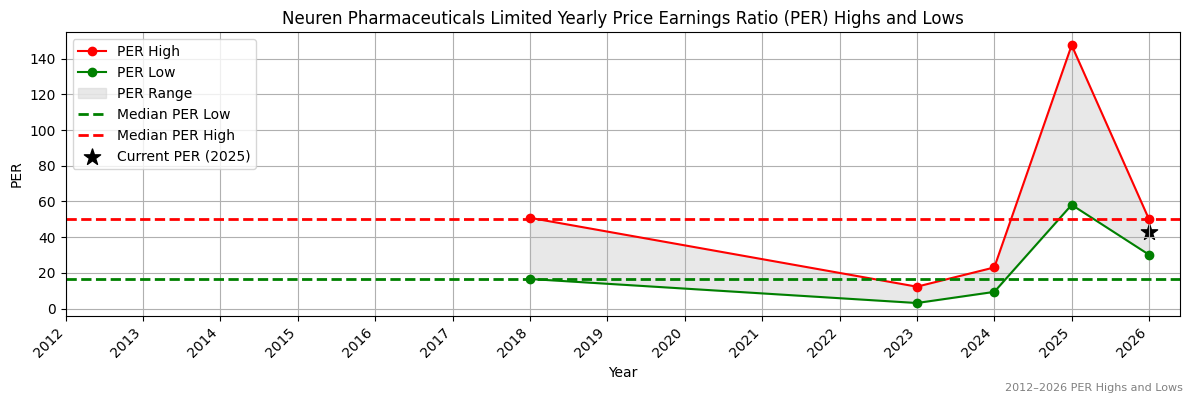
Ticker code: NEU
NEU Red Flags & Risk Indicators
❌
⚠️ RED FLAGS: 4 identified
- Highly Shorted
- Increasing Shorts
- High Price to Book vs ROE
- Falling EBITDA Margins
Income Statement
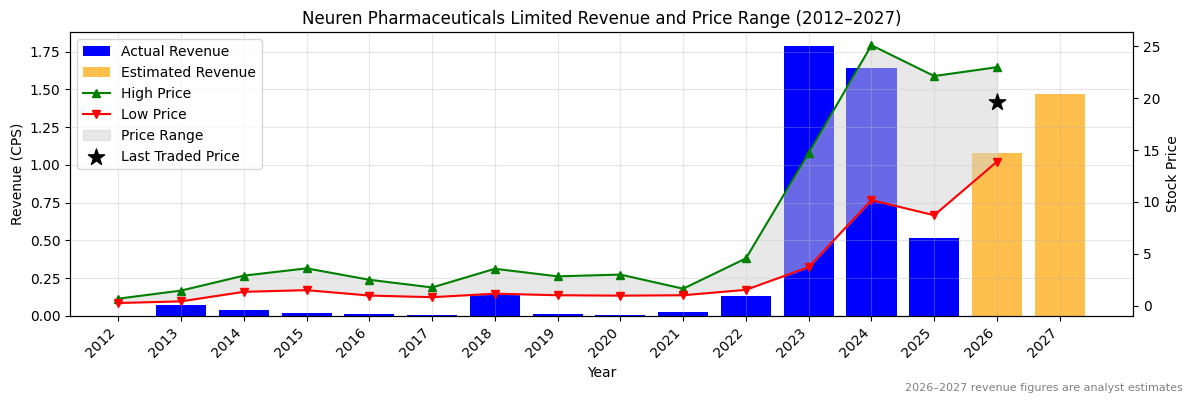
| Revenue 2024 Per Share |
Revenue 2025e Per Share |
Revenue 2026e Per Share |
Revenue 24 to 25e [%] |
Revenue 25e to 26e [%] |
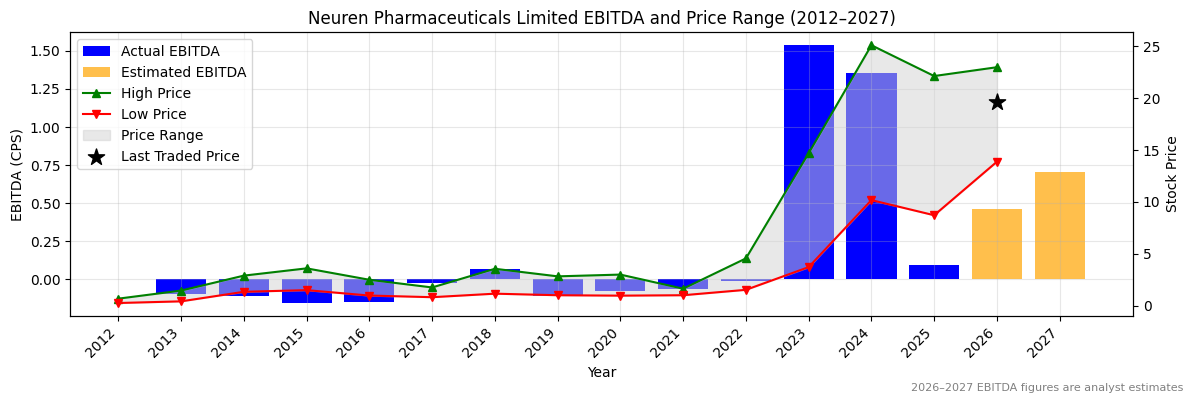
EBITDA 2024 Per Share |
EBITDA 2025e Per Share |
EBITDA 2026e Per Share |
EBITDA 24 to 25e [%] |
EBITDA 25e to 26e [%] |
| 1.64454 |
0.51696 |
1.07906 |
-68.6 |
108.7 |
1.35417 |
0.09691 |
0.4613 |
-92.8 |
376.0 |
NEU Revenue Per Share (2012–2027)
❌
NEU Earnings before Interest, Tax, Depreciation and Amortisation (EBITDA) Per Share (2012–2027)
❌
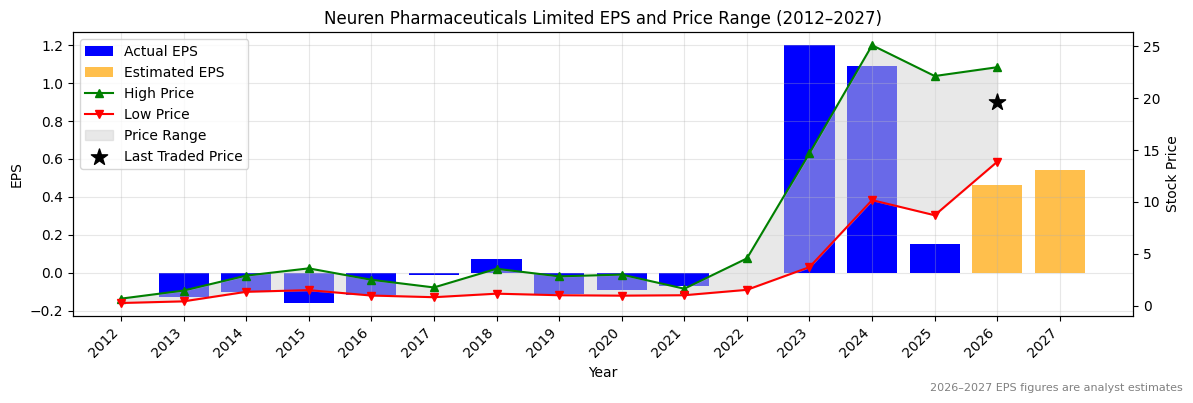
NEU Normalised Earnings Per Share (EPS) (2012–2027)
❌
Valuation
| Price To Sales |
Price To Book |
PER 2023 |
PER 2024 |
13Y Median PER Low |
PER 2025e |
13Y Median PER High |
PER 2026e |
Last Updated |
| 12.6 |
8.4 |
18.1 |
20.0 |
16.6 |
145.1 |
50.0 |
47.3 |
4/10/25 |
NEU Yearly Price Earnings Ratio (PER) Highs and Lows
❌
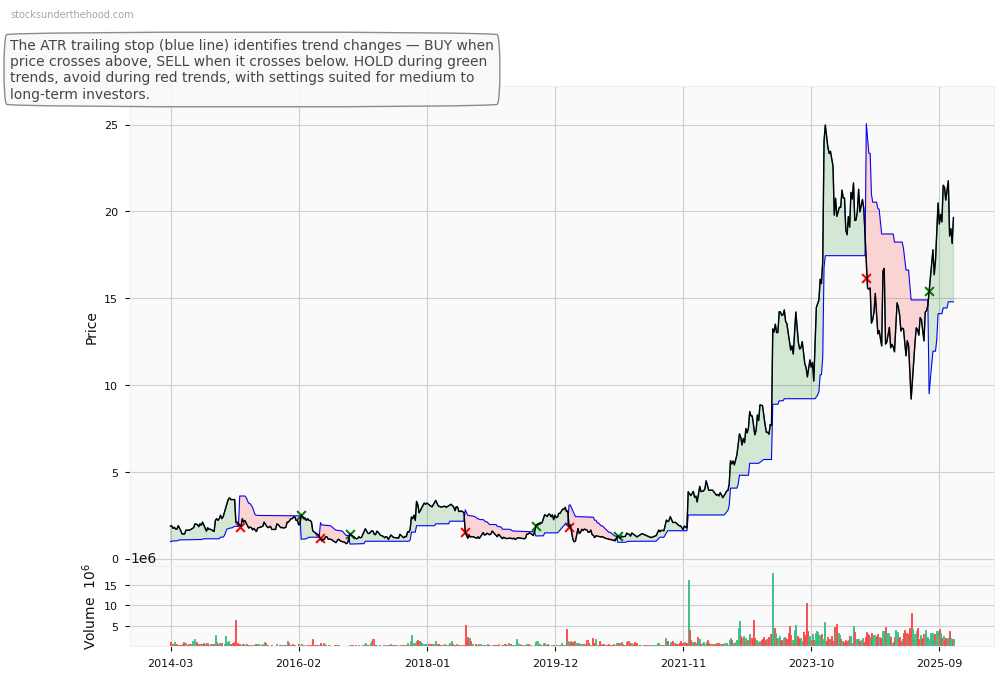
NEU Weekly Price Chart with Average True Range (ATR) Trailing Stop (10-Year View)
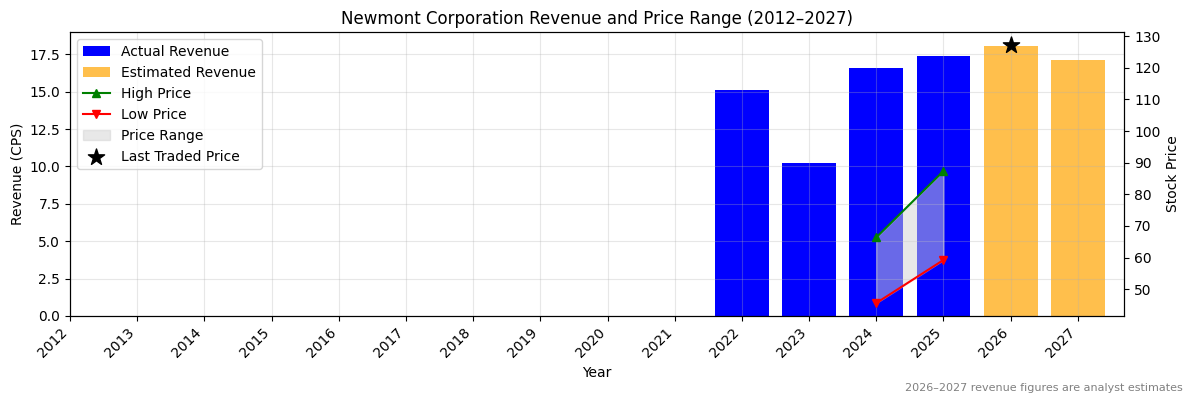
Ticker code: NEM
NEM Red Flags & Risk Indicators
⚠️
⚠️ RED FLAGS: 1 identified
Income Statement
| Revenue 2024 Per Share |
Revenue 2025e Per Share |
Revenue 2026e Per Share |
Revenue 24 to 25e [%] |
Revenue 25e to 26e [%] |
EBITDA 2024 Per Share |
EBITDA 2025e Per Share |
EBITDA 2026e Per Share |
EBITDA 24 to 25e [%] |
EBITDA 25e to 26e [%] |
| 16.57675 |
17.36497 |
18.06296 |
4.8 |
4.0 |
7.69743 |
10.76582 |
11.69338 |
39.9 |
8.6 |
NEM Revenue Per Share (2012–2027)
✅
NEM Earnings before Interest, Tax, Depreciation and Amortisation (EBITDA) Per Share (2012–2027)
✅✅
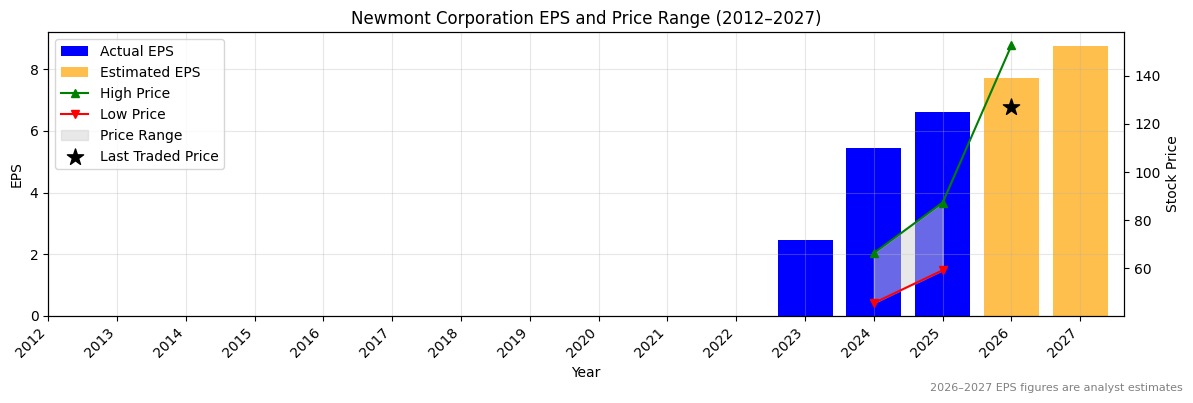
NEM Normalised Earnings Per Share (EPS) (2012–2027)
✅✅
Valuation
| Price To Sales |
Price To Book |
PER 2023 |
PER 2024 |
13Y Median PER Low |
PER 2025e |
13Y Median PER High |
PER 2026e |
Last Updated |
| 6.3 |
4.1 |
50.8 |
23.0 |
8.7 |
18.9 |
13.2 |
16.2 |
4/10/25 |
NEM Yearly Price Earnings Ratio (PER) Highs and Lows
❌
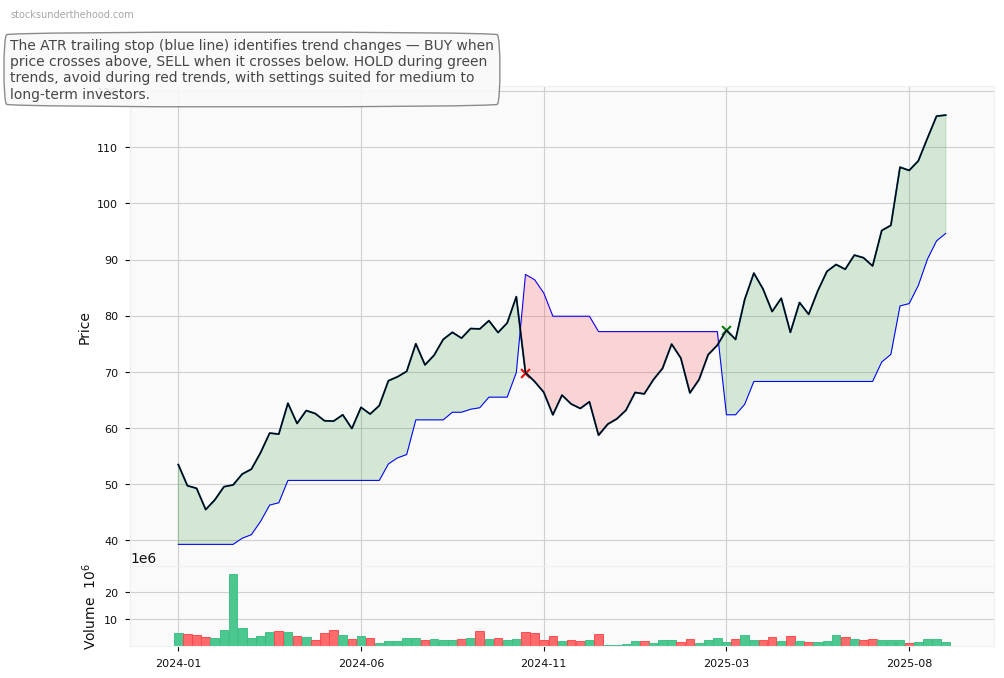
NEM Weekly Price Chart with Average True Range (ATR) Trailing Stop (10-Year View)
Ticker code: NEC
NEC Red Flags & Risk Indicators
⚠️
⚠️ RED FLAGS: 2 identified
- Falling Earnings
- Falling EBITDA Margins
Income Statement
| Revenue 2024 Per Share |
Revenue 2025e Per Share |
Revenue 2026e Per Share |
Revenue 24 to 25e [%] |
Revenue 25e to 26e [%] |
EBITDA 2024 Per Share |
EBITDA 2025e Per Share |
EBITDA 2026e Per Share |
EBITDA 24 to 25e [%] |
EBITDA 25e to 26e [%] |
| 1.53588 |
1.69887 |
1.71604 |
10.6 |
1.0 |
0.30338 |
0.29 |
0.32047 |
-4.4 |
10.5 |
NEC Revenue Per Share (2012–2027)
✅
NEC Earnings before Interest, Tax, Depreciation and Amortisation (EBITDA) Per Share (2012–2027)
❌
NEC Normalised Earnings Per Share (EPS) (2012–2027)
❌
Valuation
| Price To Sales |
Price To Book |
PER 2023 |
PER 2024 |
13Y Median PER Low |
PER 2025e |
13Y Median PER High |
PER 2026e |
Last Updated |
| 0.7 |
1.2 |
7.2 |
9.7 |
9.5 |
12.9 |
15.3 |
11.6 |
14/11/24 |
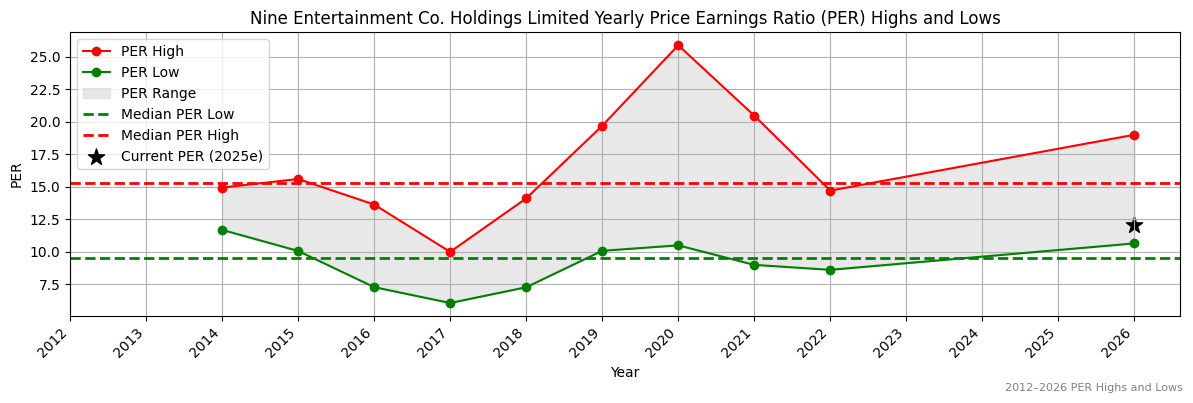
NEC Yearly Price Earnings Ratio (PER) Highs and Lows
✅
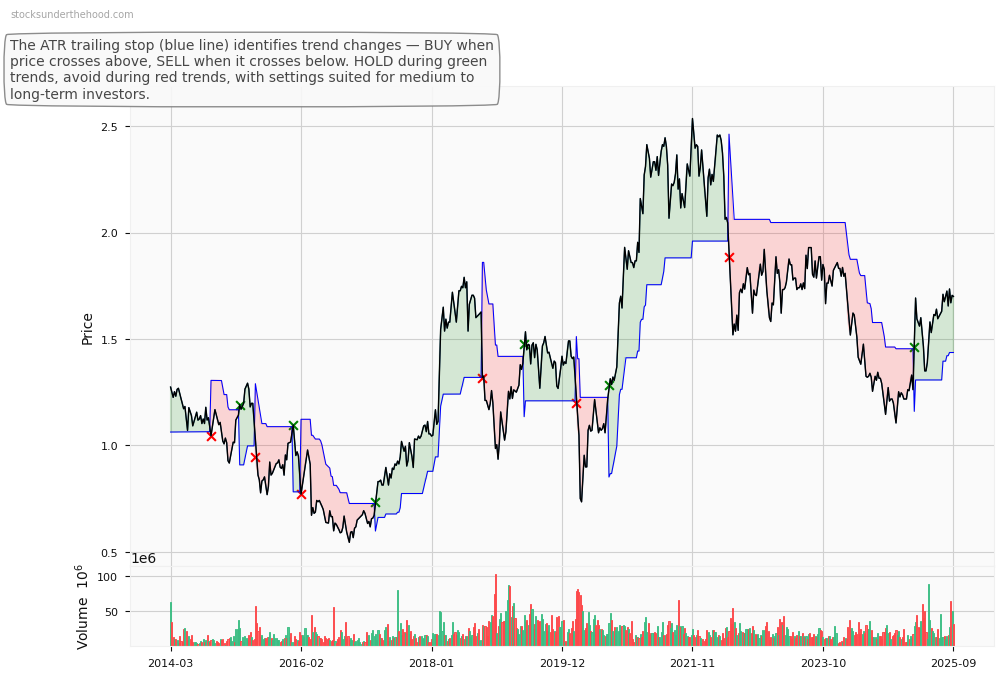
NEC Weekly Price Chart with Average True Range (ATR) Trailing Stop (10-Year View)
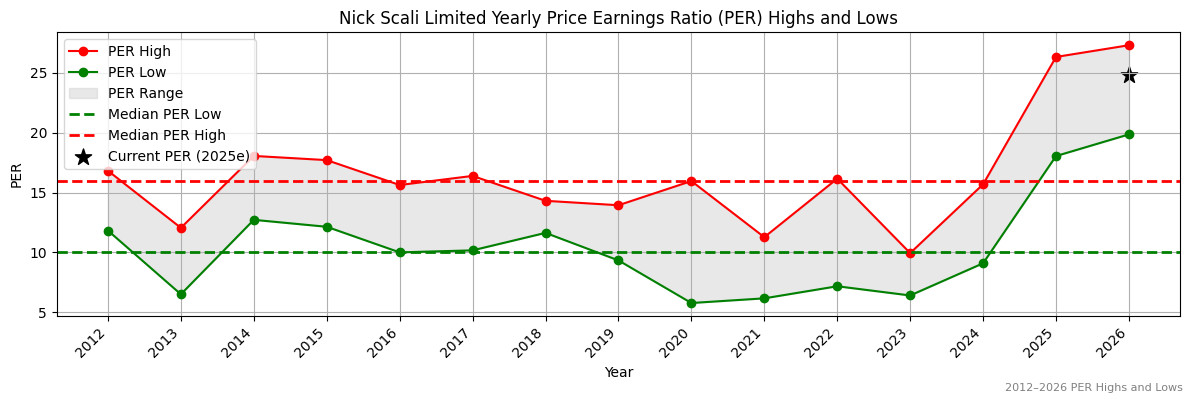
Ticker code: NCK
NCK Red Flags & Risk Indicators
❌
⚠️ RED FLAGS: 4 identified
- Highly Shorted
- Falling Earnings
- High Relative Valuation
- Falling EBITDA Margins
Income Statement
| Revenue 2024 Per Share |
Revenue 2025e Per Share |
Revenue 2026e Per Share |
Revenue 24 to 25e [%] |
Revenue 25e to 26e [%] |
EBITDA 2024 Per Share |
EBITDA 2025e Per Share |
EBITDA 2026e Per Share |
EBITDA 24 to 25e [%] |
EBITDA 25e to 26e [%] |
| 5.49518 |
5.81338 |
6.35398 |
5.8 |
9.3 |
2.05399 |
1.86737 |
2.15046 |
-9.1 |
15.2 |
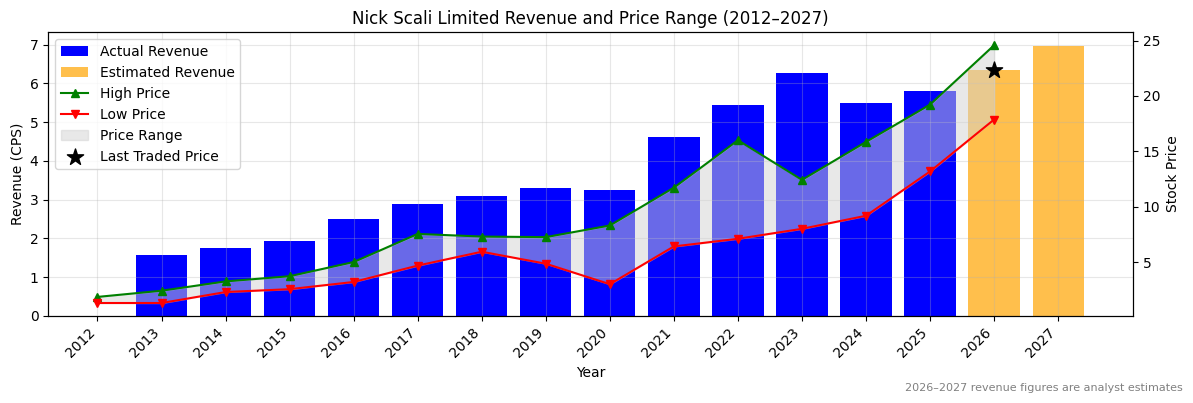
NCK Revenue Per Share (2012–2027)
✅
NCK Earnings before Interest, Tax, Depreciation and Amortisation (EBITDA) Per Share (2012–2027)
❌
NCK Normalised Earnings Per Share (EPS) (2012–2027)
❌
Valuation
| Price To Sales |
Price To Book |
PER 2023 |
PER 2024 |
13Y Median PER Low |
PER 2025e |
13Y Median PER High |
PER 2026e |
Last Updated |
| 4.4 |
8.2 |
20.3 |
25.2 |
10.0 |
34.8 |
16.0 |
28.2 |
4/10/25 |
NCK Yearly Price Earnings Ratio (PER) Highs and Lows
❌
NCK Weekly Price Chart with Average True Range (ATR) Trailing Stop (10-Year View)
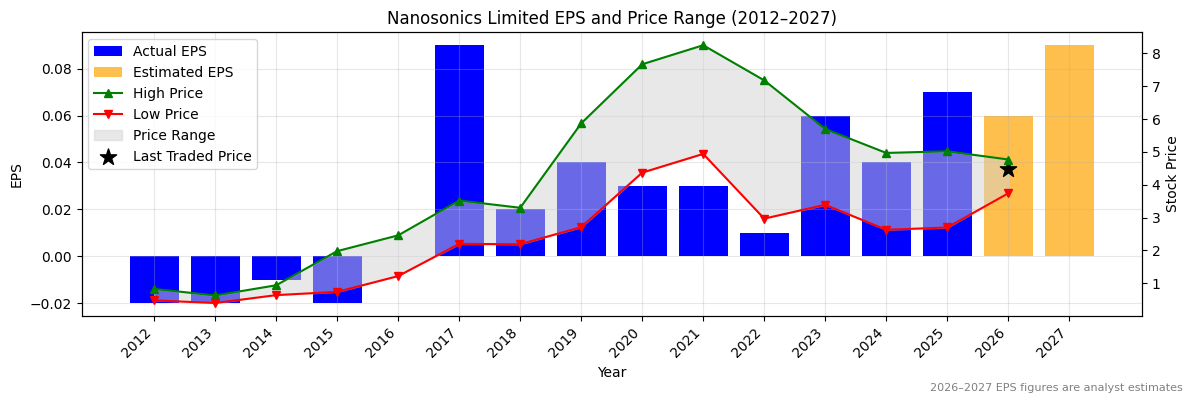
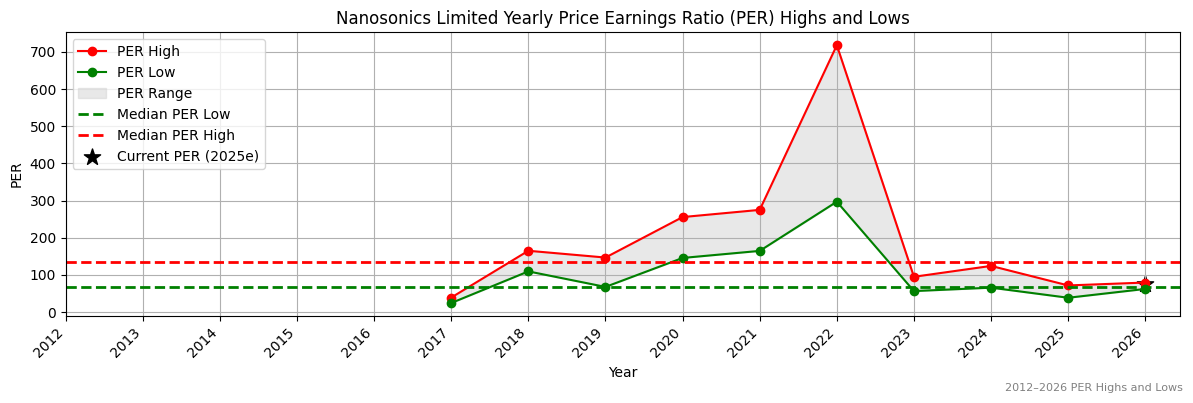
Ticker code: NAN
NAN Red Flags & Risk Indicators
⚠️
⚠️ RED FLAGS: 1 identified
Income Statement
| Revenue 2024 Per Share |
Revenue 2025e Per Share |
Revenue 2026e Per Share |
Revenue 24 to 25e [%] |
Revenue 25e to 26e [%] |
EBITDA 2024 Per Share |
EBITDA 2025e Per Share |
EBITDA 2026e Per Share |
EBITDA 24 to 25e [%] |
EBITDA 25e to 26e [%] |
| 0.56109 |
0.64955 |
0.71822 |
15.8 |
10.6 |
0.05528 |
0.08524 |
0.08659 |
54.2 |
1.6 |
NAN Revenue Per Share (2012–2027)
✅
NAN Earnings before Interest, Tax, Depreciation and Amortisation (EBITDA) Per Share (2012–2027)
✅✅
NAN Normalised Earnings Per Share (EPS) (2012–2027)
✅✅
Valuation
| Price To Sales |
Price To Book |
PER 2023 |
PER 2024 |
13Y Median PER Low |
PER 2025e |
13Y Median PER High |
PER 2026e |
Last Updated |
| 7.0 |
6.6 |
76.3 |
114.5 |
66.8 |
65.4 |
135.5 |
76.3 |
20/9/25 |
NAN Yearly Price Earnings Ratio (PER) Highs and Lows
✅✅
NAN Weekly Price Chart with Average True Range (ATR) Trailing Stop (10-Year View)
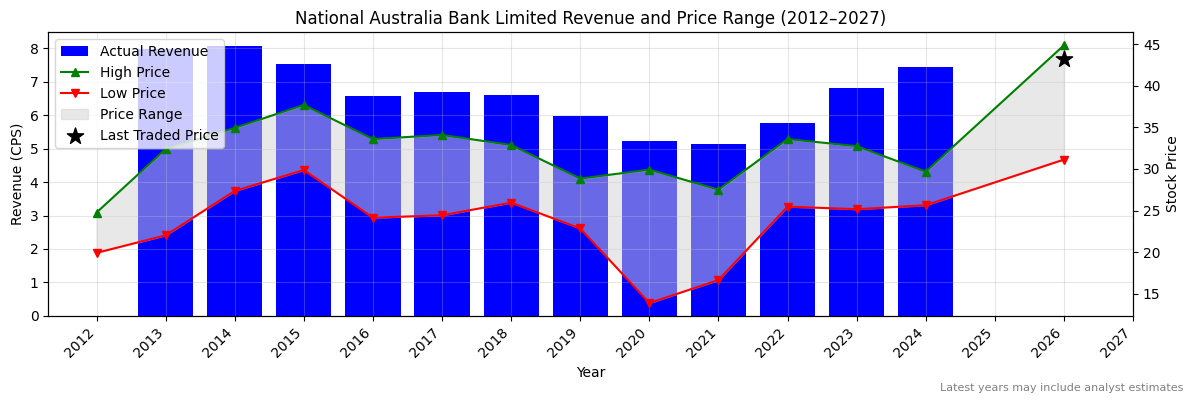
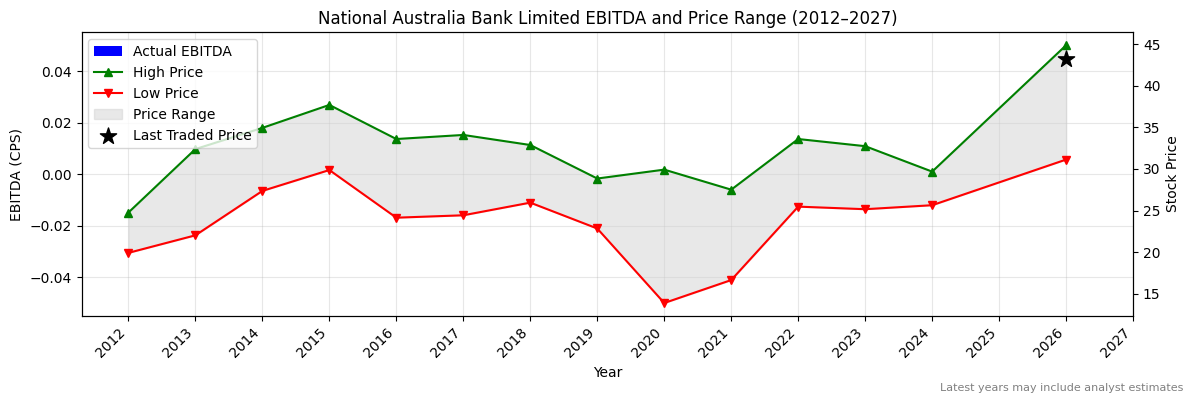
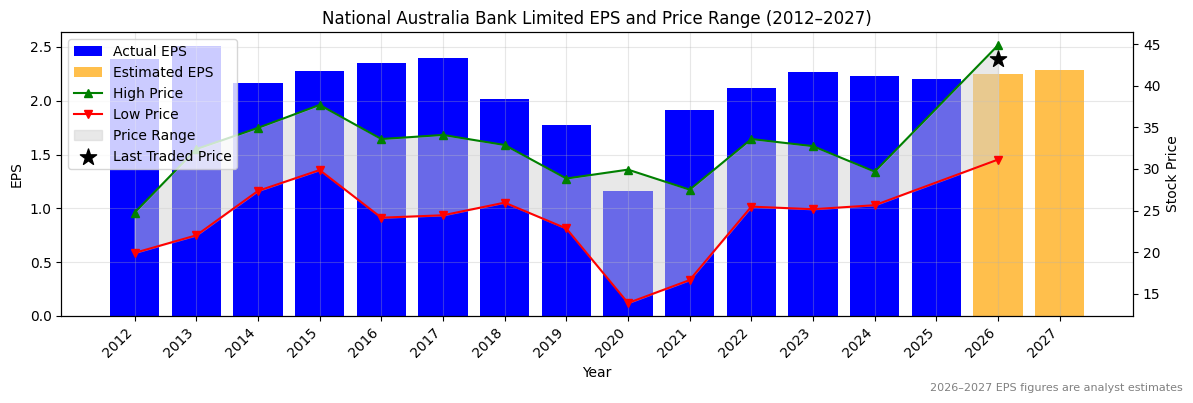
Ticker code: NAB
NAB Red Flags & Risk Indicators
⚠️
⚠️ RED FLAGS: 2 identified
- Falling Earnings
- High Relative Valuation
Income Statement
| Revenue 2024 Per Share |
Revenue 2025e Per Share |
Revenue 2026e Per Share |
Revenue 24 to 25e [%] |
Revenue 25e to 26e [%] |
EBITDA 2024 Per Share |
EBITDA 2025e Per Share |
EBITDA 2026e Per Share |
EBITDA 24 to 25e [%] |
EBITDA 25e to 26e [%] |
| 7.44369 |
None |
None |
None |
None |
None |
None |
None |
None |
None |
NAB Revenue Per Share (2012–2027)
NAB Earnings before Interest, Tax, Depreciation and Amortisation (EBITDA) Per Share (2012–2027)
NAB Normalised Earnings Per Share (EPS) (2012–2027)
❌
Valuation
| Price To Sales |
Price To Book |
PER 2023 |
PER 2024 |
13Y Median PER Low |
PER 2025e |
13Y Median PER High |
PER 2026e |
Last Updated |
| 6.7 |
2.1 |
19.2 |
19.6 |
11.7 |
19.8 |
15.1 |
19.4 |
23/7/25 |
NAB Yearly Price Earnings Ratio (PER) Highs and Lows
❌
NAB Weekly Price Chart with Average True Range (ATR) Trailing Stop (10-Year View)
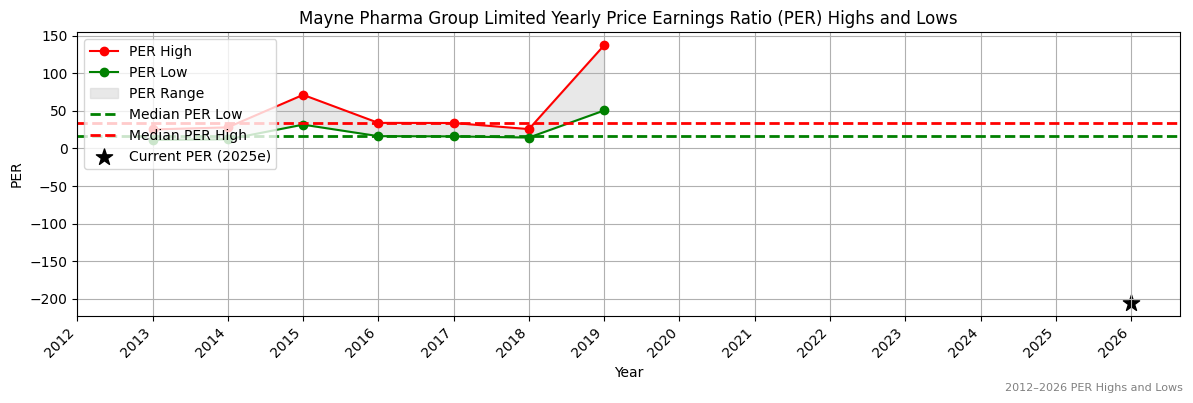
Ticker code: MYX
MYX Red Flags & Risk Indicators
⚠️
⚠️ RED FLAGS: 2 identified
- Negative Operating Cash Flow
- Low Operating Margin
Income Statement
| Revenue 2024 Per Share |
Revenue 2025e Per Share |
Revenue 2026e Per Share |
Revenue 24 to 25e [%] |
Revenue 25e to 26e [%] |
EBITDA 2024 Per Share |
EBITDA 2025e Per Share |
EBITDA 2026e Per Share |
EBITDA 24 to 25e [%] |
EBITDA 25e to 26e [%] |
| 4.78324 |
5.25308 |
5.63229 |
9.8 |
7.2 |
0.28202 |
0.57849 |
0.54526 |
105.1 |
-5.7 |
MYX Revenue Per Share (2012–2027)
✅
MYX Earnings before Interest, Tax, Depreciation and Amortisation (EBITDA) Per Share (2012–2027)
✅✅
MYX Normalised Earnings Per Share (EPS) (2012–2027)
✅✅
Valuation
| Price To Sales |
Price To Book |
PER 2023 |
PER 2024 |
13Y Median PER Low |
PER 2025e |
13Y Median PER High |
PER 2026e |
Last Updated |
| 0.8 |
0.9 |
-1.5 |
-2.3 |
16.0 |
-53.1 |
33.9 |
-141.7 |
11/10/25 |
MYX Yearly Price Earnings Ratio (PER) Highs and Lows
✅✅
MYX Weekly Price Chart with Average True Range (ATR) Trailing Stop (10-Year View)
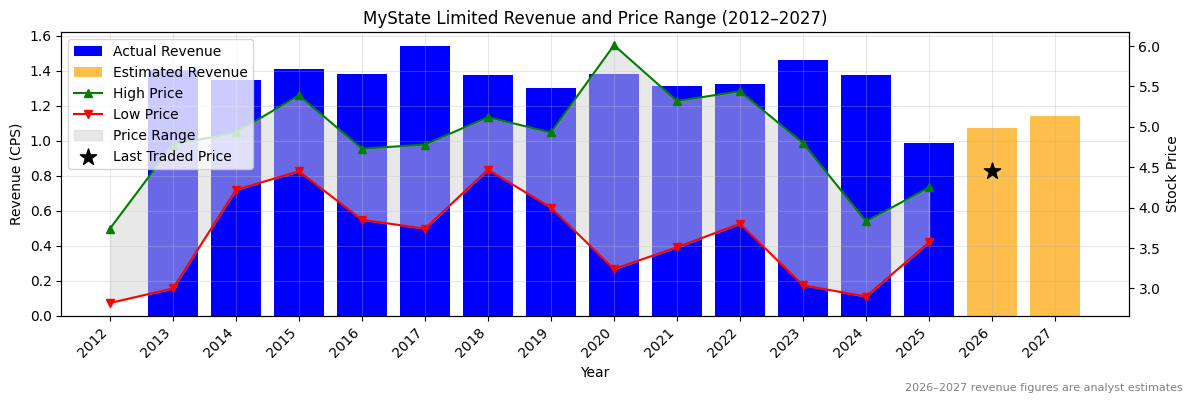
Ticker code: MYS
MYS Red Flags & Risk Indicators
⚠️
⚠️ RED FLAGS: 1 identified
Income Statement
| Revenue 2024 Per Share |
Revenue 2025e Per Share |
Revenue 2026e Per Share |
Revenue 24 to 25e [%] |
Revenue 25e to 26e [%] |
EBITDA 2024 Per Share |
EBITDA 2025e Per Share |
EBITDA 2026e Per Share |
EBITDA 24 to 25e [%] |
EBITDA 25e to 26e [%] |
| 1.37821 |
0.98593 |
1.07126 |
-28.5 |
8.7 |
None |
None |
None |
None |
None |
MYS Revenue Per Share (2012–2027)
❌
MYS Earnings before Interest, Tax, Depreciation and Amortisation (EBITDA) Per Share (2012–2027)
MYS Normalised Earnings Per Share (EPS) (2012–2027)
✅
Valuation
| Price To Sales |
Price To Book |
PER 2023 |
PER 2024 |
13Y Median PER Low |
PER 2025e |
13Y Median PER High |
PER 2026e |
Last Updated |
| 4.1 |
1.0 |
14.4 |
15.9 |
10.8 |
13.5 |
14.5 |
12.0 |
14/11/24 |
MYS Yearly Price Earnings Ratio (PER) Highs and Lows
✅
MYS Weekly Price Chart with Average True Range (ATR) Trailing Stop (10-Year View)
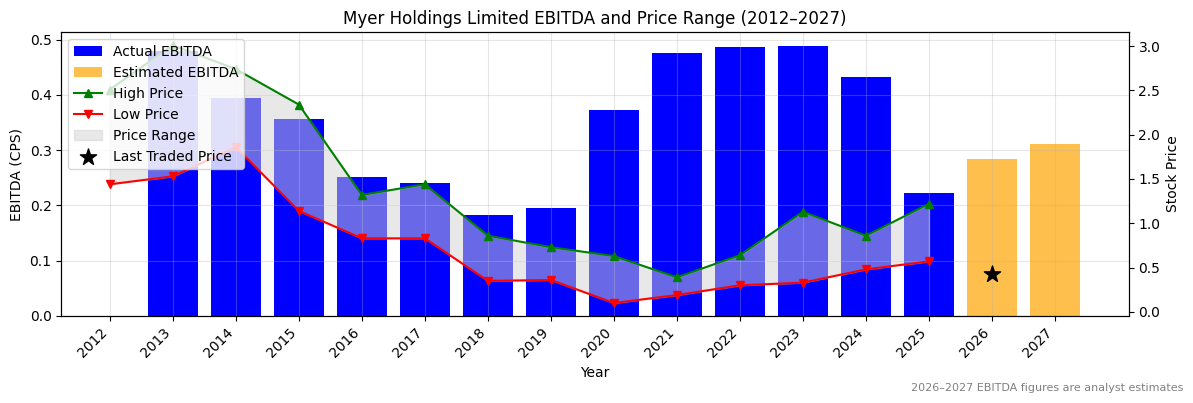
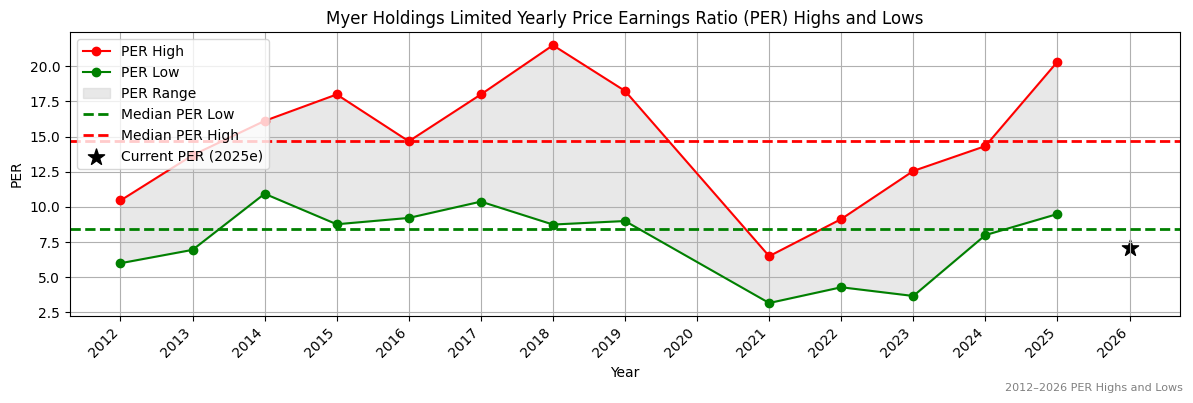
Ticker code: MYR
MYR Red Flags & Risk Indicators
⚠️
⚠️ RED FLAGS: 2 identified
- Falling Earnings
- Falling EBITDA Margins
Income Statement
| Revenue 2024 Per Share |
Revenue 2025e Per Share |
Revenue 2026e Per Share |
Revenue 24 to 25e [%] |
Revenue 25e to 26e [%] |
EBITDA 2024 Per Share |
EBITDA 2025e Per Share |
EBITDA 2026e Per Share |
EBITDA 24 to 25e [%] |
EBITDA 25e to 26e [%] |
| 3.92843 |
4.38633 |
2.42353 |
11.7 |
-44.7 |
0.43264 |
0.22175 |
0.28319 |
-48.7 |
27.7 |
MYR Revenue Per Share (2012–2027)
✅
MYR Earnings before Interest, Tax, Depreciation and Amortisation (EBITDA) Per Share (2012–2027)
❌
MYR Normalised Earnings Per Share (EPS) (2012–2027)
❌
Valuation
| Price To Sales |
Price To Book |
PER 2023 |
PER 2024 |
13Y Median PER Low |
PER 2025e |
13Y Median PER High |
PER 2026e |
Last Updated |
| 0.2 |
0.8 |
4.4 |
6.6 |
8.4 |
6.6 |
14.7 |
6.6 |
28/9/25 |
MYR Yearly Price Earnings Ratio (PER) Highs and Lows
✅✅
MYR Weekly Price Chart with Average True Range (ATR) Trailing Stop (10-Year View)
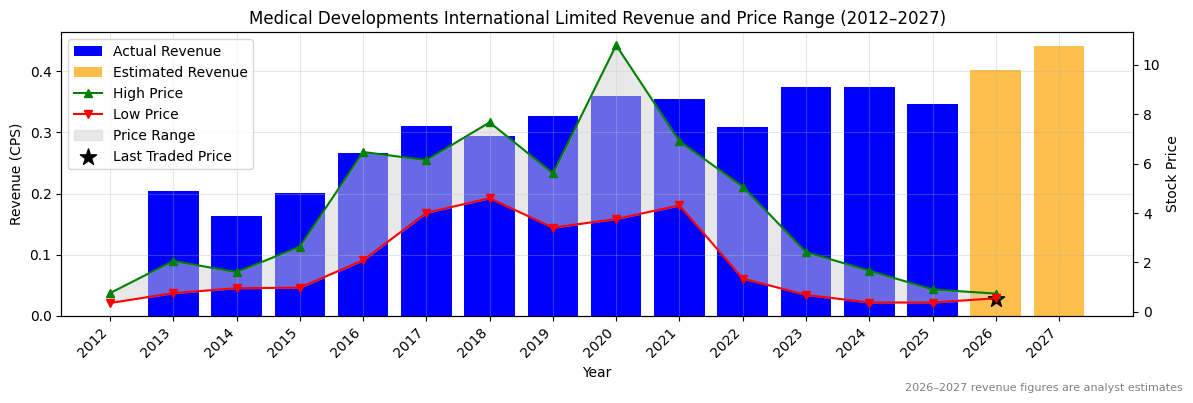
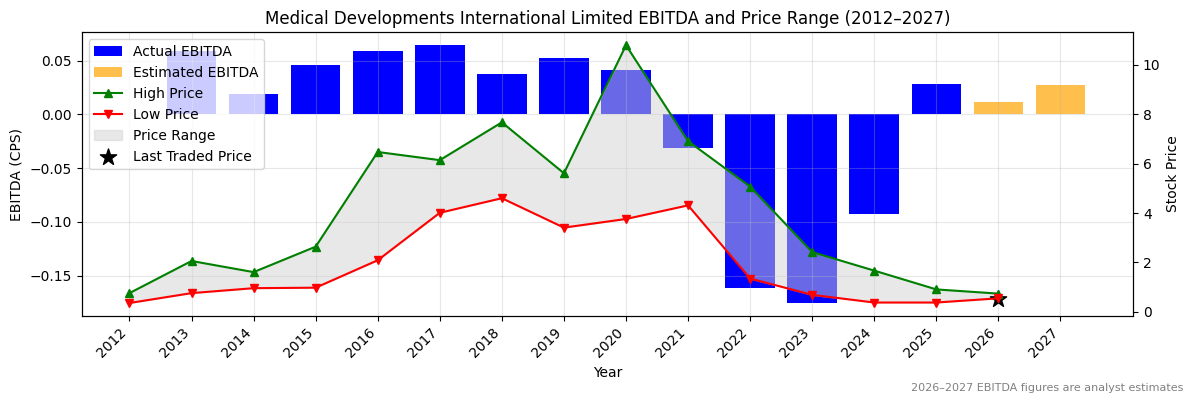
Ticker code: MVP
MVP Red Flags & Risk Indicators
⚠️
⚠️ RED FLAGS: 1 identified
Income Statement
| Revenue 2024 Per Share |
Revenue 2025e Per Share |
Revenue 2026e Per Share |
Revenue 24 to 25e [%] |
Revenue 25e to 26e [%] |
EBITDA 2024 Per Share |
EBITDA 2025e Per Share |
EBITDA 2026e Per Share |
EBITDA 24 to 25e [%] |
EBITDA 25e to 26e [%] |
| 0.37472 |
0.34671 |
0.40166 |
-7.5 |
15.8 |
-0.09255 |
0.02805 |
0.0111 |
130.3 |
-60.4 |
MVP Revenue Per Share (2012–2027)
❌
MVP Earnings before Interest, Tax, Depreciation and Amortisation (EBITDA) Per Share (2012–2027)
✅✅
MVP Normalised Earnings Per Share (EPS) (2012–2027)
✅✅
Valuation
| Price To Sales |
Price To Book |
PER 2023 |
PER 2024 |
13Y Median PER Low |
PER 2025e |
13Y Median PER High |
PER 2026e |
Last Updated |
| 2.0 |
1.4 |
-4.4 |
-3.0 |
69.7 |
None |
204.7 |
-70.0 |
28/9/25 |
MVP Yearly Price Earnings Ratio (PER) Highs and Lows
MVP Weekly Price Chart with Average True Range (ATR) Trailing Stop (10-Year View)
Ticker code: MVF
MVF Red Flags & Risk Indicators
⚠️
⚠️ RED FLAGS: 1 identified
Income Statement
| Revenue 2024 Per Share |
Revenue 2025e Per Share |
Revenue 2026e Per Share |
Revenue 24 to 25e [%] |
Revenue 25e to 26e [%] |
EBITDA 2024 Per Share |
EBITDA 2025e Per Share |
EBITDA 2026e Per Share |
EBITDA 24 to 25e [%] |
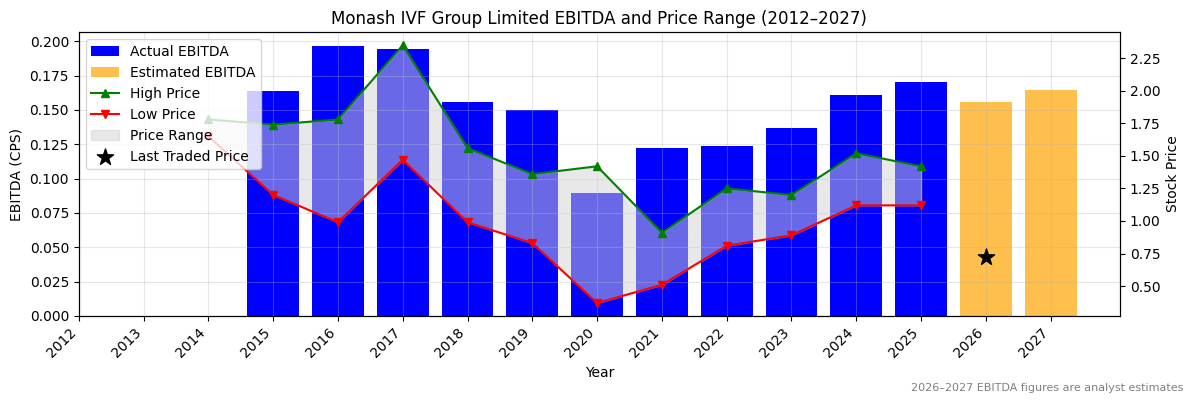
EBITDA 25e to 26e [%] |
| 0.65436 |
0.69788 |
0.67779 |
6.7 |
-2.9 |
0.1612 |
0.17026 |
0.15574 |
5.6 |
-8.5 |
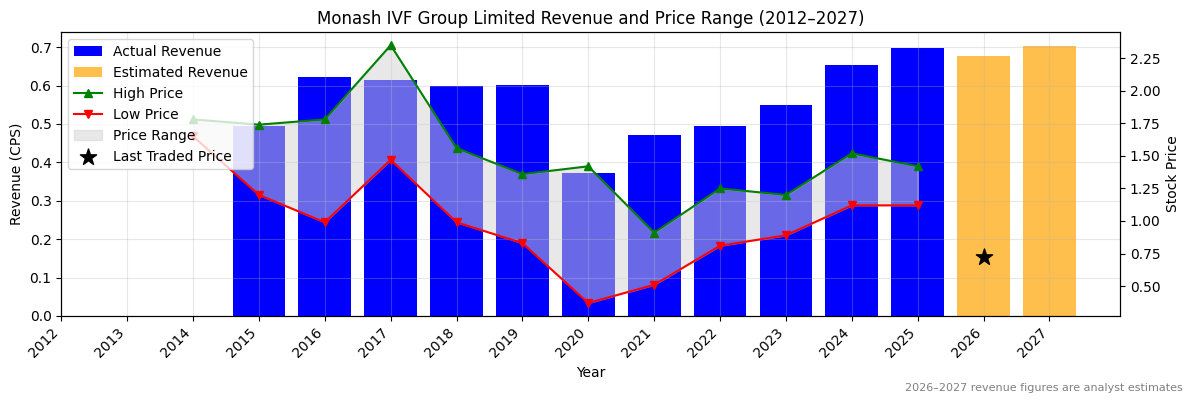
MVF Revenue Per Share (2012–2027)
✅
MVF Earnings before Interest, Tax, Depreciation and Amortisation (EBITDA) Per Share (2012–2027)
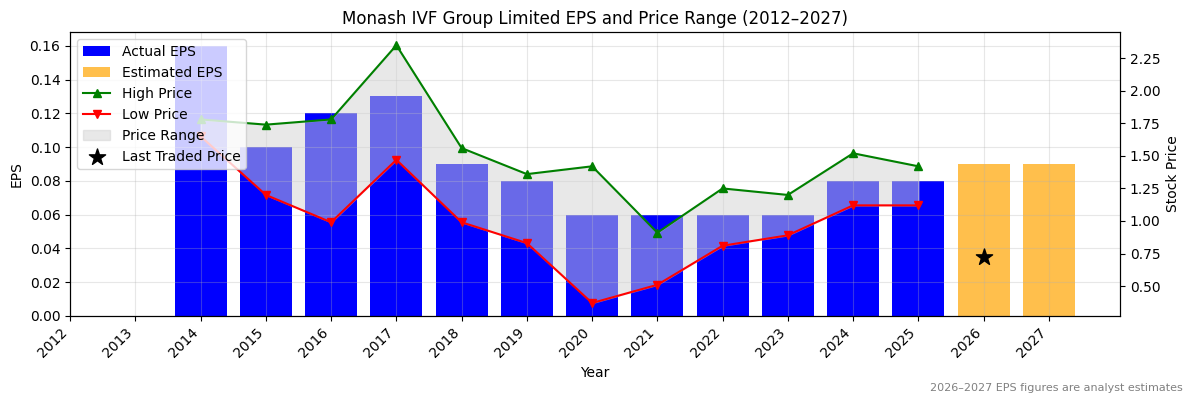
✅
MVF Normalised Earnings Per Share (EPS) (2012–2027)
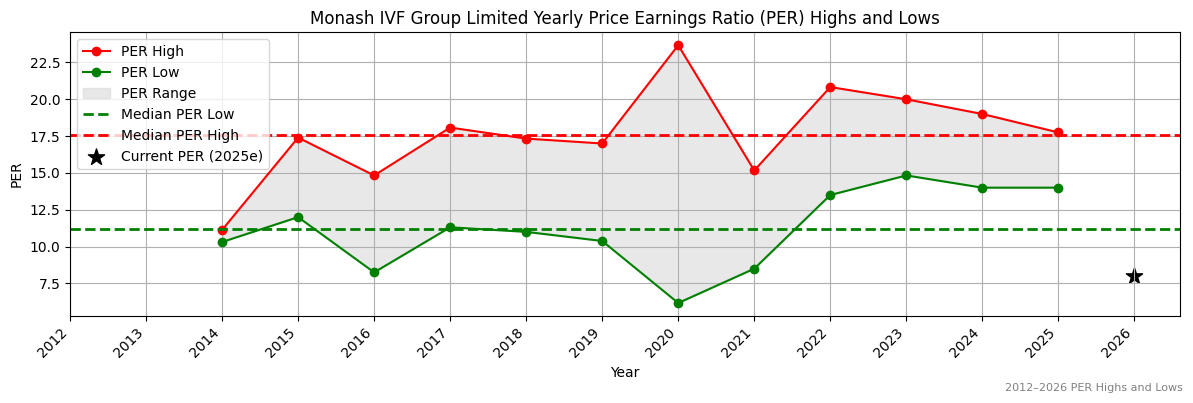
❌
Valuation
| Price To Sales |
Price To Book |
PER 2023 |
PER 2024 |
13Y Median PER Low |
PER 2025e |
13Y Median PER High |
PER 2026e |
Last Updated |
| 1.0 |
1.1 |
11.5 |
8.6 |
11.2 |
8.6 |
17.6 |
7.7 |
26/10/25 |
MVF Yearly Price Earnings Ratio (PER) Highs and Lows
✅✅
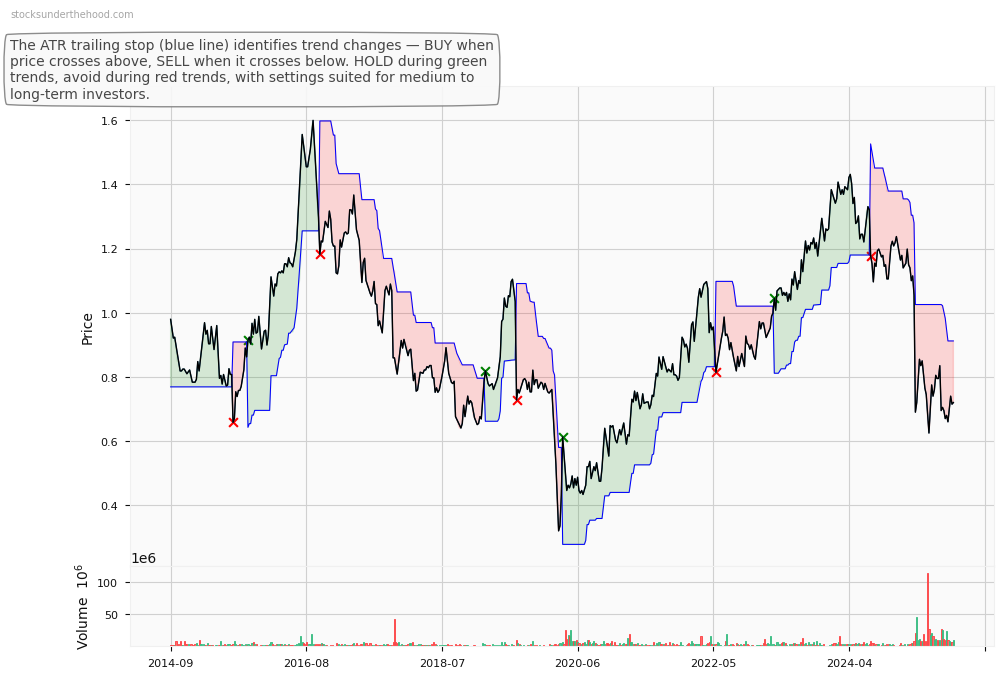
MVF Weekly Price Chart with Average True Range (ATR) Trailing Stop (10-Year View)
Ticker code: MU
MU Red Flags & Risk Indicators
⚠️
⚠️ RED FLAGS: 2 identified
- Falling Earnings
- High Relative Valuation
Income Statement
| Revenue 2024 Per Share |
Revenue 2025e Per Share |
Revenue 2026e Per Share |
Revenue 24 to 25e [%] |
Revenue 25e to 26e [%] |
EBITDA 2024 Per Share |
EBITDA 2025e Per Share |
EBITDA 2026e Per Share |
EBITDA 24 to 25e [%] |
EBITDA 25e to 26e [%] |
| 22.67625 |
34.02983 |
39.32907 |
50.1 |
15.6 |
8.22879 |
18.42437 |
22.04836 |
123.9 |
19.7 |
MU Revenue Per Share (2012–2027)
✅✅
MU Earnings before Interest, Tax, Depreciation and Amortisation (EBITDA) Per Share (2012–2027)
✅✅
MU Normalised Earnings Per Share (EPS) (2012–2027)
✅✅
Valuation
| Price To Sales |
Price To Book |
PER 2023 |
PER 2024 |
13Y Median PER Low |
PER 2025e |
13Y Median PER High |
PER 2026e |
Last Updated |
| 6.7 |
4.6 |
-50.3 |
172.3 |
6.6 |
32.1 |
13.6 |
20.2 |
28/7/24 |
MU Yearly Price Earnings Ratio (PER) Highs and Lows
❌
MU Weekly Price Chart with Average True Range (ATR) Trailing Stop (10-Year View)
Ticker code: MTS
MTS Red Flags & Risk Indicators
❌
⚠️ RED FLAGS: 3 identified
- Low Operating Margin
- Falling Earnings
- More Net Debt Than Equity
Income Statement
| Revenue 2024 Per Share |
Revenue 2025e Per Share |
Revenue 2026e Per Share |
Revenue 24 to 25e [%] |
Revenue 25e to 26e [%] |
EBITDA 2024 Per Share |
EBITDA 2025e Per Share |
EBITDA 2026e Per Share |
EBITDA 24 to 25e [%] |
EBITDA 25e to 26e [%] |
| 14.57713 |
15.70516 |
16.04438 |
7.7 |
2.2 |
0.63054 |
0.66858 |
0.71189 |
6.0 |
6.5 |
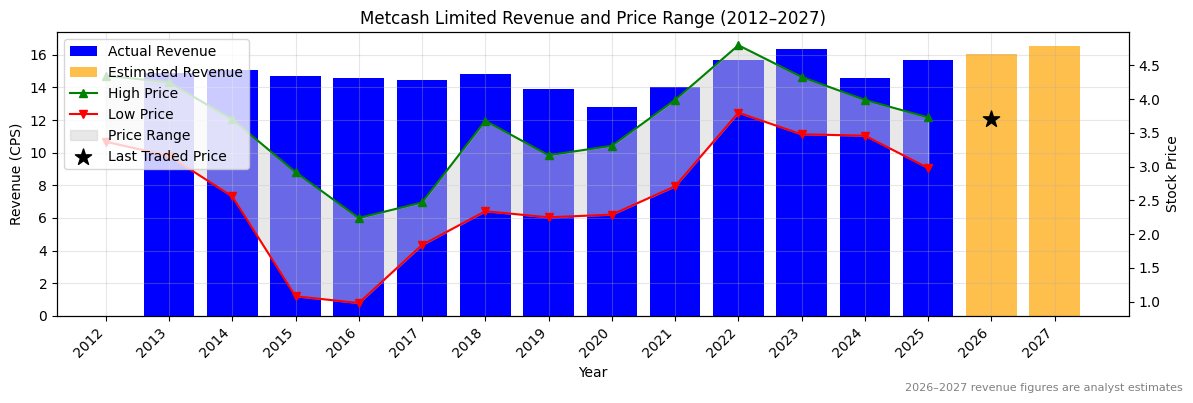
MTS Revenue Per Share (2012–2027)
✅
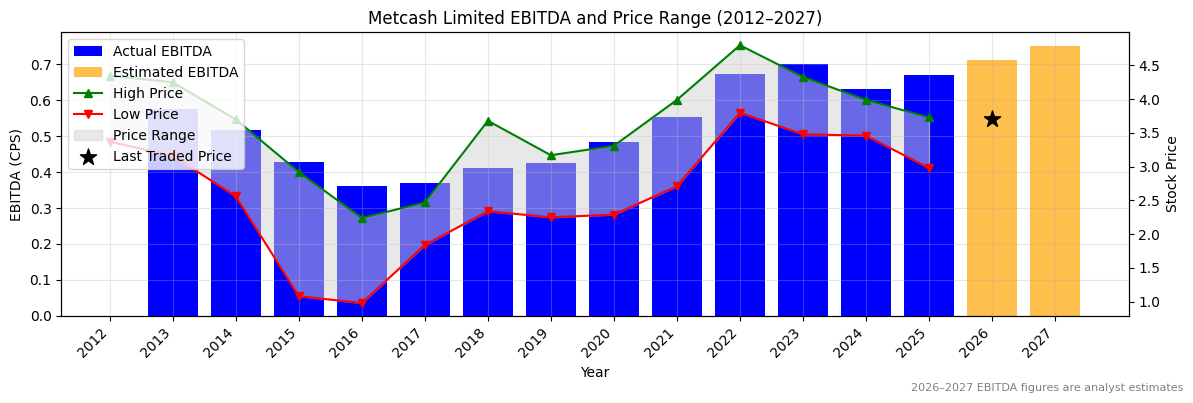
MTS Earnings before Interest, Tax, Depreciation and Amortisation (EBITDA) Per Share (2012–2027)
✅
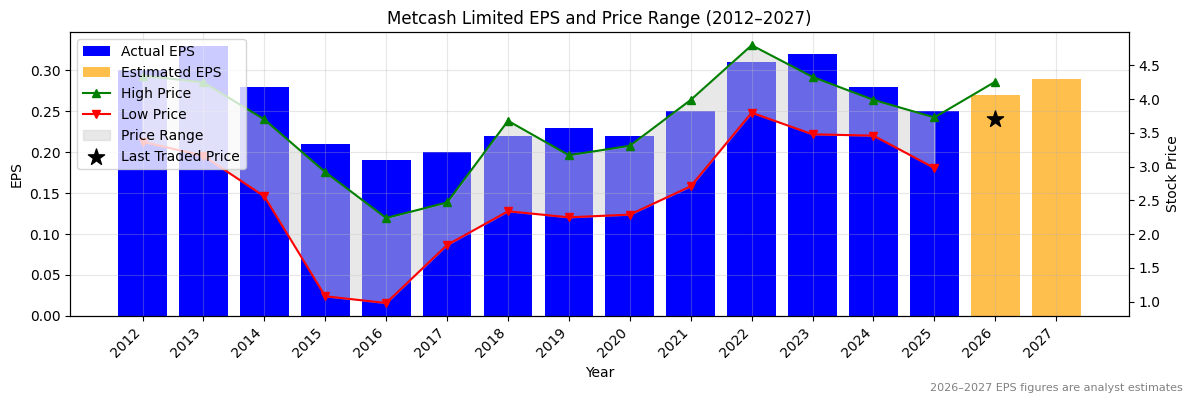
MTS Normalised Earnings Per Share (EPS) (2012–2027)
❌
Valuation
| Price To Sales |
Price To Book |
PER 2023 |
PER 2024 |
13Y Median PER Low |
PER 2025e |
13Y Median PER High |
PER 2026e |
Last Updated |
| 0.2 |
2.6 |
11.9 |
13.6 |
10.5 |
15.2 |
14.3 |
14.1 |
23/6/25 |
MTS Yearly Price Earnings Ratio (PER) Highs and Lows
❌
MTS Weekly Price Chart with Average True Range (ATR) Trailing Stop (10-Year View)
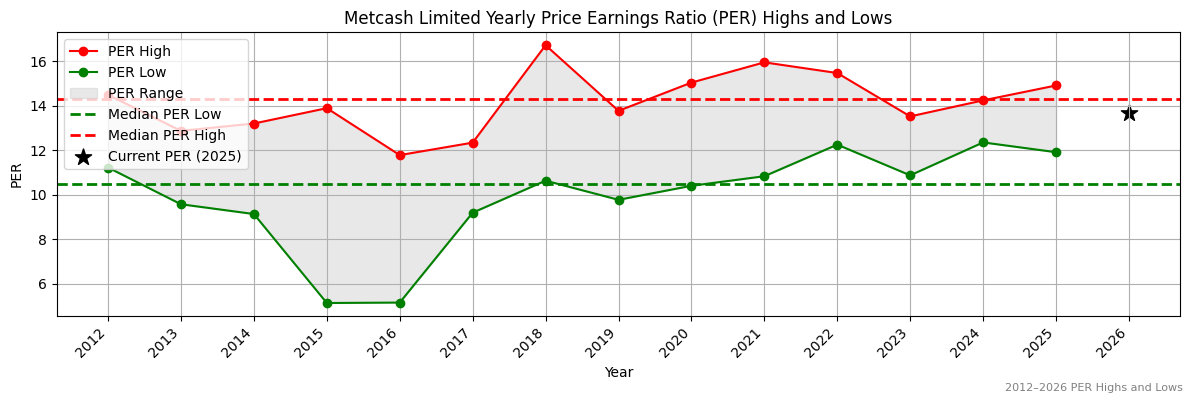
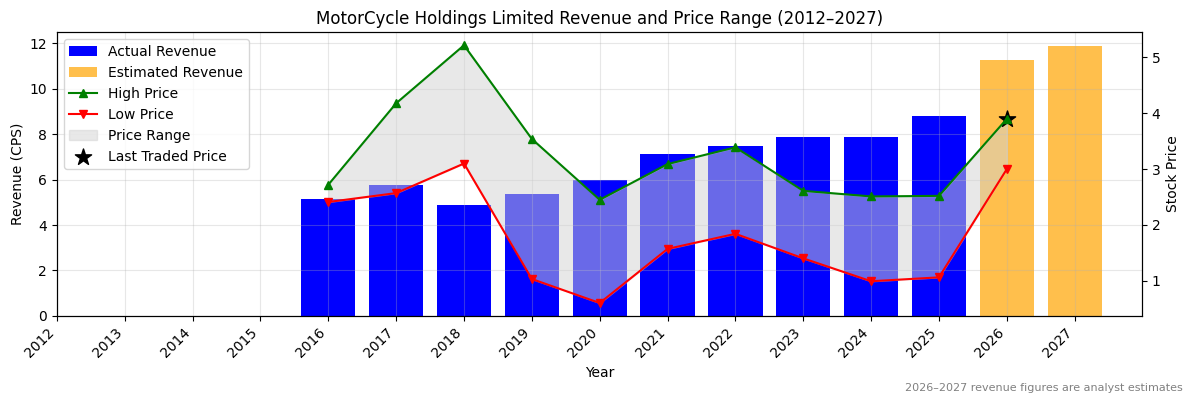
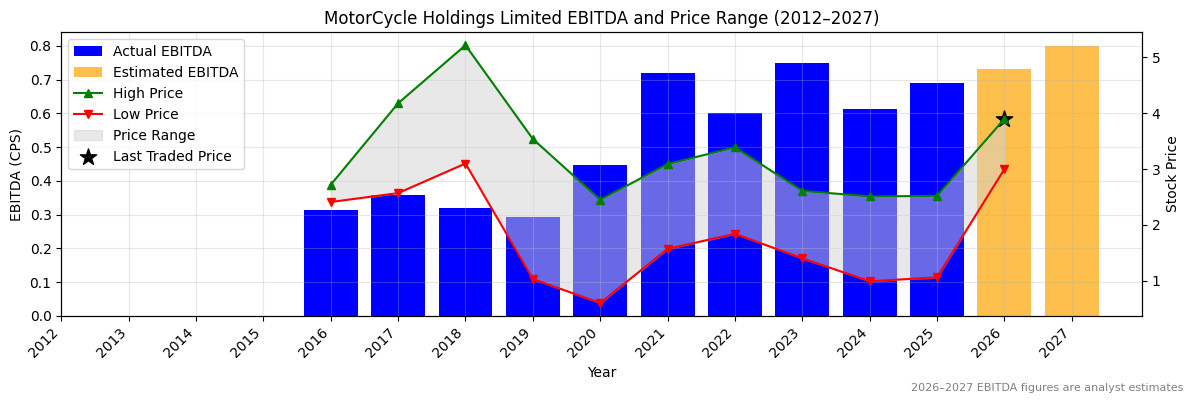
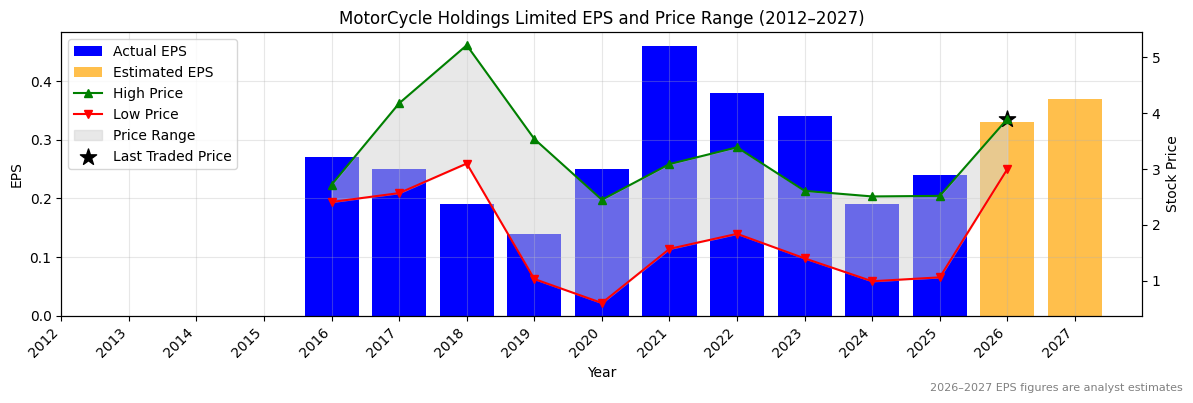
Ticker code: MTO
MTO Red Flags & Risk Indicators
⚠️
⚠️ RED FLAGS: 1 identified
Income Statement
| Revenue 2024 Per Share |
Revenue 2025e Per Share |
Revenue 2026e Per Share |
Revenue 24 to 25e [%] |
Revenue 25e to 26e [%] |
EBITDA 2024 Per Share |
EBITDA 2025e Per Share |
EBITDA 2026e Per Share |
EBITDA 24 to 25e [%] |
EBITDA 25e to 26e [%] |
| 7.89024 |
8.80745 |
11.26108 |
11.6 |
27.9 |
0.61247 |
0.69106 |
0.73083 |
12.8 |
5.8 |
MTO Revenue Per Share (2012–2027)
✅
MTO Earnings before Interest, Tax, Depreciation and Amortisation (EBITDA) Per Share (2012–2027)
✅
MTO Normalised Earnings Per Share (EPS) (2012–2027)
✅✅
Valuation
| Price To Sales |
Price To Book |
PER 2023 |
PER 2024 |
13Y Median PER Low |
PER 2025e |
13Y Median PER High |
PER 2026e |
Last Updated |
| 0.4 |
1.4 |
11.1 |
19.9 |
5.2 |
15.7 |
10.5 |
11.5 |
20/10/25 |
MTO Yearly Price Earnings Ratio (PER) Highs and Lows
❌
MTO Weekly Price Chart with Average True Range (ATR) Trailing Stop (10-Year View)
Ticker code: MSFT
MSFT Red Flags & Risk Indicators
⚠️
⚠️ RED FLAGS: 2 identified
- Falling Earnings
- High Relative Valuation
Income Statement
| Revenue 2024 Per Share |
Revenue 2025e Per Share |
Revenue 2026e Per Share |
Revenue 24 to 25e [%] |
Revenue 25e to 26e [%] |
EBITDA 2024 Per Share |
EBITDA 2025e Per Share |
EBITDA 2026e Per Share |
EBITDA 24 to 25e [%] |
EBITDA 25e to 26e [%] |
| 32.9889 |
None |
None |
None |
None |
17.45149 |
19.94415 |
23.18467 |
14.3 |
16.2 |
MSFT Revenue Per Share (2012–2027)
MSFT Earnings before Interest, Tax, Depreciation and Amortisation (EBITDA) Per Share (2012–2027)
✅
MSFT Normalised Earnings Per Share (EPS) (2012–2027)
✅
Valuation
| Price To Sales |
Price To Book |
PER 2023 |
PER 2024 |
13Y Median PER Low |
PER 2025e |
13Y Median PER High |
PER 2026e |
Last Updated |
| 13.9 |
11.4 |
53.6 |
44.6 |
18.7 |
40.0 |
27.7 |
35.1 |
29/7/24 |
MSFT Yearly Price Earnings Ratio (PER) Highs and Lows
❌
MSFT Weekly Price Chart with Average True Range (ATR) Trailing Stop (10-Year View)