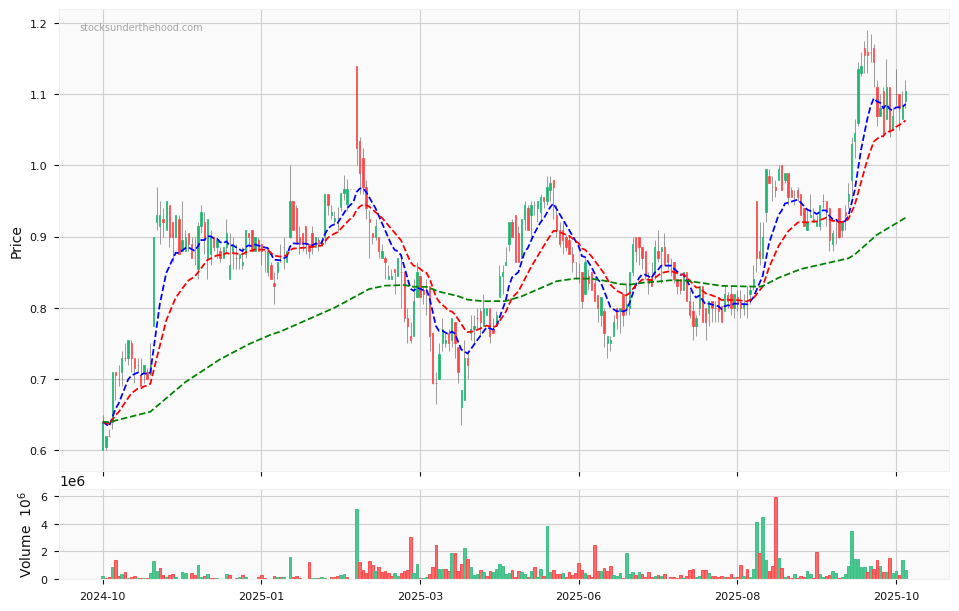
Smart Parking Limited (ASX:SPZ) is a global parking technology company managing car park spaces through Smart Cloud and ANPR/LPR systems. With operations in Australia, New Zealand, Europe, and the UK, it focuses on design, development, and integrated parking management services.
Ticker code: SPZ
Market Information
| Market Capitalisation |
Enterprise Value |
Shares Outstanding |
Free Float [%] |
Free Float Value |
| $581,214,066 |
$570,322,151 |
415152911.0 |
44.99 |
$261,511,236 |
Balance Sheet & Quality
| Equity |
Cash |
Debt |
Return On Equity (ROE) |
EBITDA 25 Margin [%] |
Net Debt / Equity [%] |
Rule of 40 |
| $88,842,722 |
$21,378,512 |
$10,486,597 |
7.9 |
22.3 |
-12.3 |
67.4 |
Technicals & Short Data
| 3EMA Status |
Volatility [%] |
Value Traded Today |
Average Daily Liquidity |
Short [%] |
Days To Cover |
| Positive |
5.9 |
$1,345,803 |
$1,188,638 |
0.01 |
0.0 |
Dividends
| Previous Dividend |
Last Dividend |
Franking [%] |
Ex-Div Date |
Gross Yield [%] |
| None |
None |
100.0 |
None |
0.0 |
Price Performance Snapshot
| Last Traded Price |
Change [%] |
1 Week [%] |
1 Month [%] |
3 Months [%] |
6 Months [%] |
12 Months [%] |
| $1.400 |
6.5 |
8.9 |
11.1 |
45.1 |
72.8 |
53.0 |
SPZ Price Chart with Volume and 3EMA
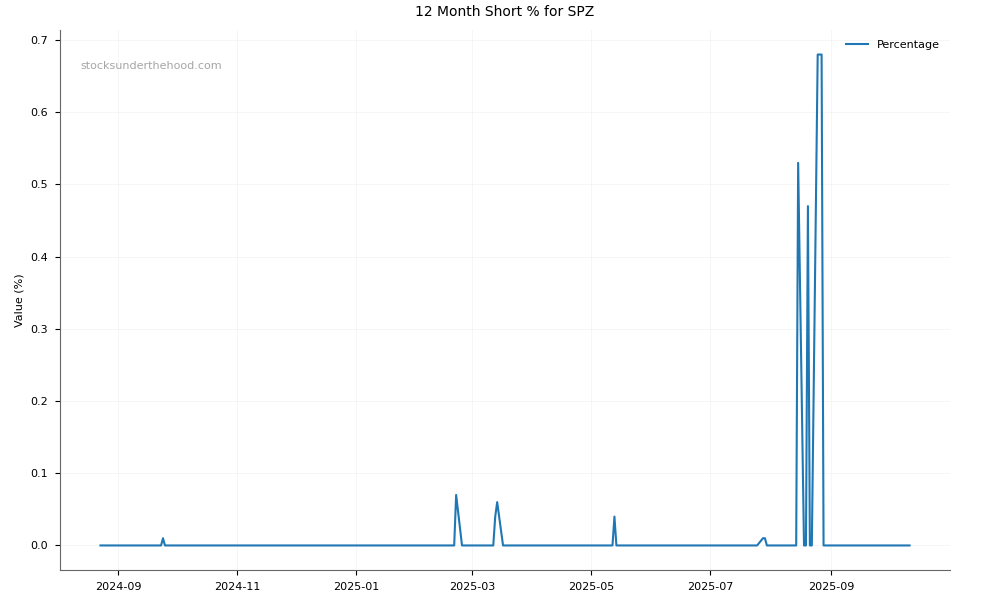
SPZ Short Positions
Click HERE to understand why the above moving averages have been chosen.
Ticker code: None
None Red Flags & Risk Indicators
✅
⚠️ RED FLAGS: 0 identified
No red flags detected.
Income Statement
| Revenue 2024 Per Share |
Revenue 2025e Per Share |
Revenue 2026e Per Share |
Revenue 24 to 25e [%] |
Revenue 25e to 26e [%] |
EBITDA 2024 Per Share |
EBITDA 2025e Per Share |
EBITDA 2026e Per Share |
EBITDA 24 to 25e [%] |
EBITDA 25e to 26e [%] |
| 1.54665 |
2.03965 |
2.73857 |
31.9 |
34.3 |
1.15093 |
1.55971 |
2.16207 |
35.5 |
38.6 |
None Revenue Per Share (2012–2027)
✅✅
None Earnings before Interest, Tax, Depreciation and Amortisation (EBITDA) Per Share (2012–2027)
✅✅
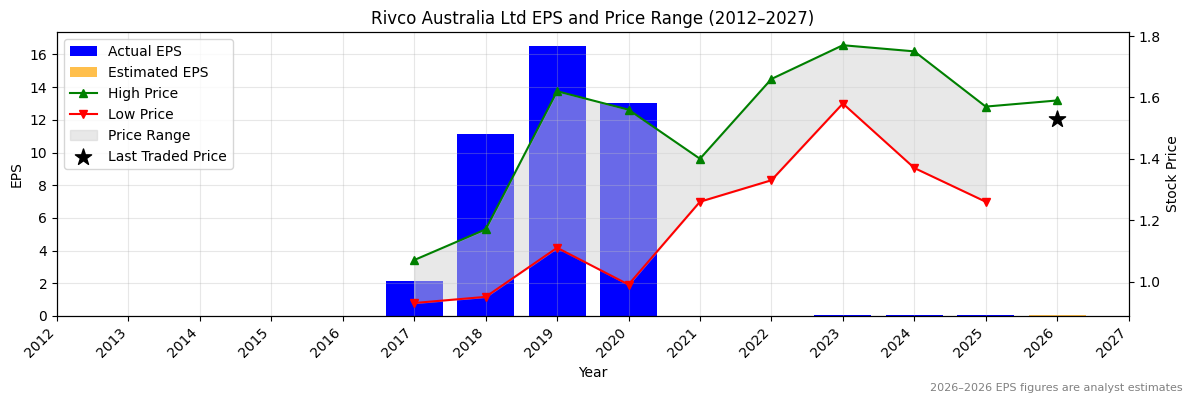
None Normalised Earnings Per Share (EPS) (2012–2027)
✅✅
Valuation
| Price To Sales |
Price To Book |
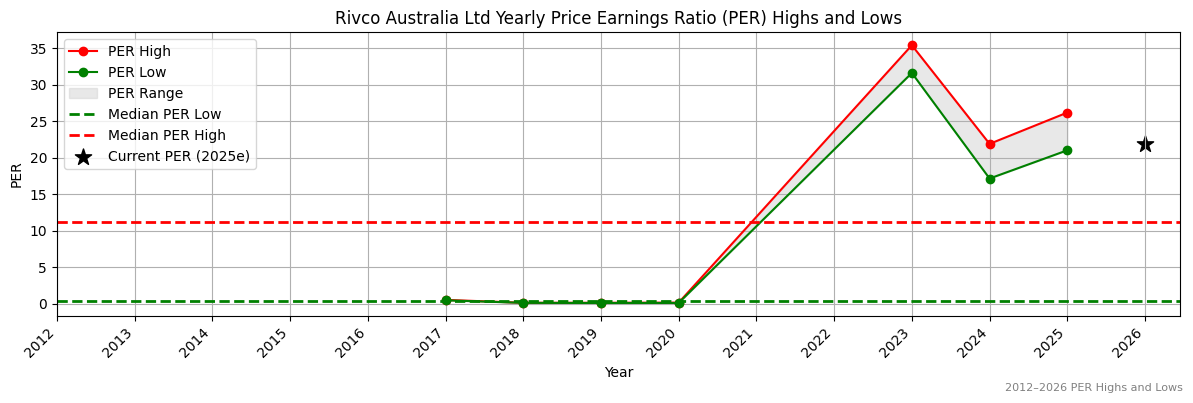
PER 2023 |
PER 2024 |
13Y Median PER Low |
PER 2025e |
13Y Median PER High |
PER 2026e |
Last Updated |
| 140.8 |
116.6 |
494.6 |
377.4 |
70.7 |
263.2 |
137.6 |
188.7 |
4/10/25 |
None Yearly Price Earnings Ratio (PER) Highs and Lows
❌
None Weekly Price Chart with Average True Range (ATR) Trailing Stop (10-Year View)
Ticker code: SOL
SOL Red Flags & Risk Indicators
⚠️
⚠️ RED FLAGS: 2 identified
- Falling Earnings
- High Relative Valuation
Income Statement
| Revenue 2024 Per Share |
Revenue 2025e Per Share |
Revenue 2026e Per Share |
Revenue 24 to 25e [%] |
Revenue 25e to 26e [%] |
EBITDA 2024 Per Share |
EBITDA 2025e Per Share |
EBITDA 2026e Per Share |
EBITDA 24 to 25e [%] |
EBITDA 25e to 26e [%] |
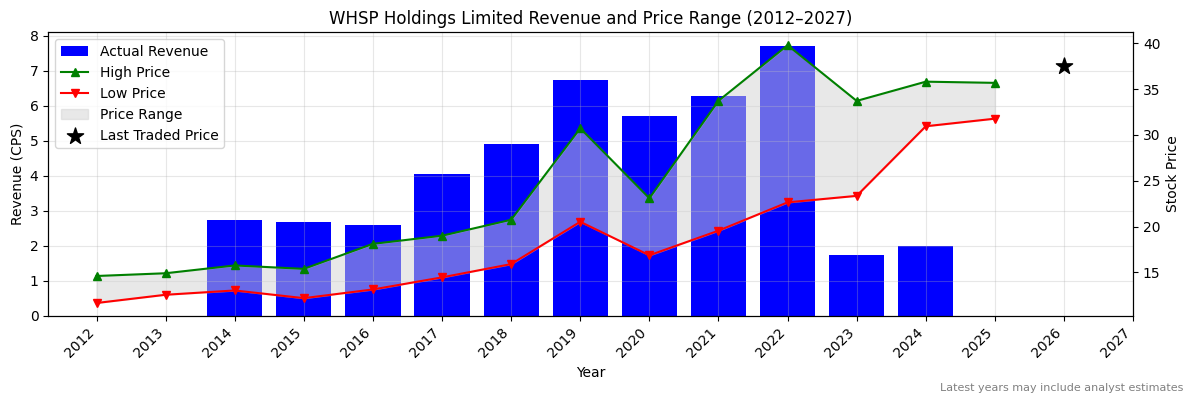
| 1.9891 |
None |
None |
None |
None |
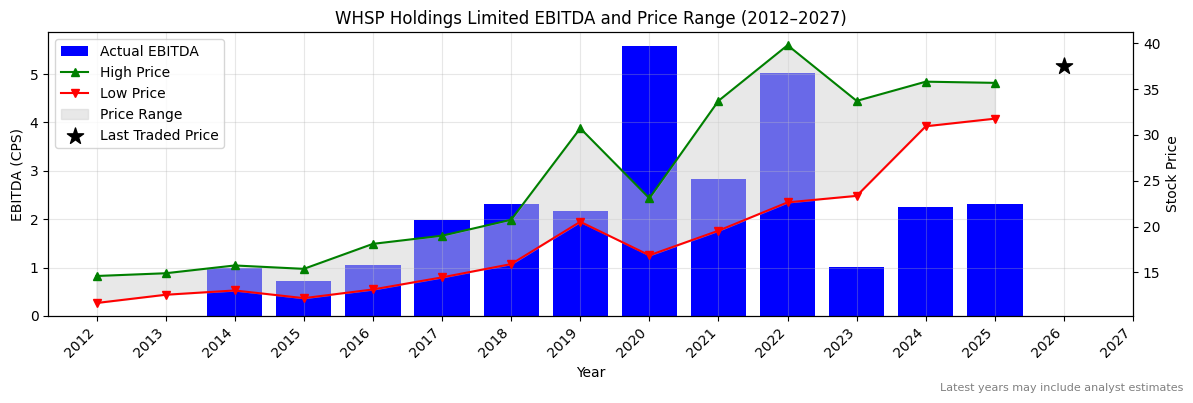
2.25782 |
2.31066 |
None |
2.3 |
None |
SOL Revenue Per Share (2012–2027)
SOL Earnings before Interest, Tax, Depreciation and Amortisation (EBITDA) Per Share (2012–2027)
✅
SOL Normalised Earnings Per Share (EPS) (2012–2027)
❌
Valuation
| Price To Sales |
Price To Book |
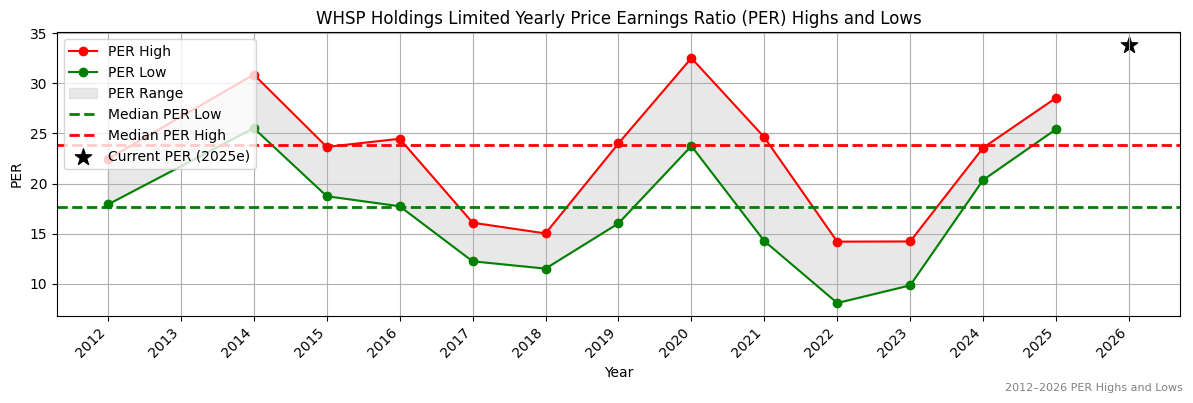
PER 2023 |
PER 2024 |
13Y Median PER Low |
PER 2025e |
13Y Median PER High |
PER 2026e |
Last Updated |
| 10.1 |
1.5 |
15.9 |
24.7 |
17.7 |
30.1 |
23.8 |
33.9 |
21/4/25 |
SOL Yearly Price Earnings Ratio (PER) Highs and Lows
❌
SOL Weekly Price Chart with Average True Range (ATR) Trailing Stop (10-Year View)
Ticker code: D2O
D2O Red Flags & Risk Indicators
❌
⚠️ RED FLAGS: 3 identified
- Falling Earnings
- High Relative Valuation
- Falling EBITDA Margins
Income Statement
| Revenue 2024 Per Share |
Revenue 2025e Per Share |
Revenue 2026e Per Share |
Revenue 24 to 25e [%] |
Revenue 25e to 26e [%] |
EBITDA 2024 Per Share |
EBITDA 2025e Per Share |
EBITDA 2026e Per Share |
EBITDA 24 to 25e [%] |
EBITDA 25e to 26e [%] |
| 0.15655 |
0.17316 |
None |
10.6 |
None |
0.14952 |
0.12396 |
0.1395 |
-17.1 |
12.5 |
D2O Revenue Per Share (2012–2027)
✅
D2O Earnings before Interest, Tax, Depreciation and Amortisation (EBITDA) Per Share (2012–2027)
❌
D2O Normalised Earnings Per Share (EPS) (2012–2027)
❌
Valuation
| Price To Sales |
Price To Book |
PER 2023 |
PER 2024 |
13Y Median PER Low |
PER 2025e |
13Y Median PER High |
PER 2026e |
Last Updated |
| 4.9 |
1.1 |
None |
None |
0.4 |
None |
11.2 |
None |
14/11/24 |
D2O Yearly Price Earnings Ratio (PER) Highs and Lows
D2O Weekly Price Chart with Average True Range (ATR) Trailing Stop (10-Year View)
Washington H. Soul Pattinson and Company Limited is a diversified investment company with interests in various sectors, including telecommunications, resources, building materials, and pharmaceuticals.
Ticker code: SOL
Market Information
| Market Capitalisation |
Enterprise Value |
Shares Outstanding |
Free Float [%] |
Free Float Value |
| $14,368,562,257 |
$14,228,762,193 |
379919682 |
64.55 |
$9,275,421,602 |
Balance Sheet & Quality
| Equity |
Cash |
Debt |
Return On Equity (ROE) |
EBITDA 25 Margin [%] |
Net Debt / Equity [%] |
Rule of 40 |
| $9,719,105,478 |
$1,149,900,032 |
$1,010,099,968 |
4.9 |
None |
-1.4 |
None |
Technicals & Short Data
| 3EMA Status |
Volatility [%] |
Value Traded Today |
Average Daily Liquidity |
Short [%] |
Days To Cover |
| Negative |
3.1 |
$27,746,567 |
$32,968,450 |
1.59 |
6.9 |
Dividends
| Previous Dividend |
Last Dividend |
Franking [%] |
Ex-Div Date |
Gross Yield [%] |
| $0.440 |
$0.590 |
100.0 |
2025-08-21 |
2.2 |
Price Performance Snapshot
| Last Traded Price |
Change [%] |
1 Week [%] |
1 Month [%] |
3 Months [%] |
6 Months [%] |
12 Months [%] |
| $37.820 |
1.1 |
2.0 |
0.6 |
-14.1 |
-10.2 |
10.2 |
SOL Price Chart with Volume and 3EMA
SOL Short Positions
Click HERE to understand why the above moving averages have been chosen.
Duxton Water Limited invests in and manages a portfolio of water entitlements, providing water supply solutions to agricultural businesses in Australia.
Ticker code: D2O
Market Information
| Market Capitalisation |
Enterprise Value |
Shares Outstanding |
Free Float [%] |
Free Float Value |
| $238,005,137 |
$251,691,137 |
155558916 |
68.72 |
$163,545,845 |
Balance Sheet & Quality
| Equity |
Cash |
Debt |
Return On Equity (ROE) |
EBITDA 25 Margin [%] |
Net Debt / Equity [%] |
Rule of 40 |
| $213,426,838 |
$4,314,000 |
$18,000,000 |
4.4 |
71.6 |
6.4 |
106.1 |
Technicals & Short Data
| 3EMA Status |
Volatility [%] |
Value Traded Today |
Average Daily Liquidity |
Short [%] |
Days To Cover |
| Partial |
2.0 |
$83,105 |
$77,701 |
0.0 |
0.0 |
Dividends
| Previous Dividend |
Last Dividend |
Franking [%] |
Ex-Div Date |
Gross Yield [%] |
| $0.037 |
$0.037 |
100.0 |
2025-10-09 |
3.5 |
Price Performance Snapshot
| Last Traded Price |
Change [%] |
1 Week [%] |
1 Month [%] |
3 Months [%] |
6 Months [%] |
12 Months [%] |
| $1.530 |
None |
None |
None |
6.3 |
2.1 |
18.3 |
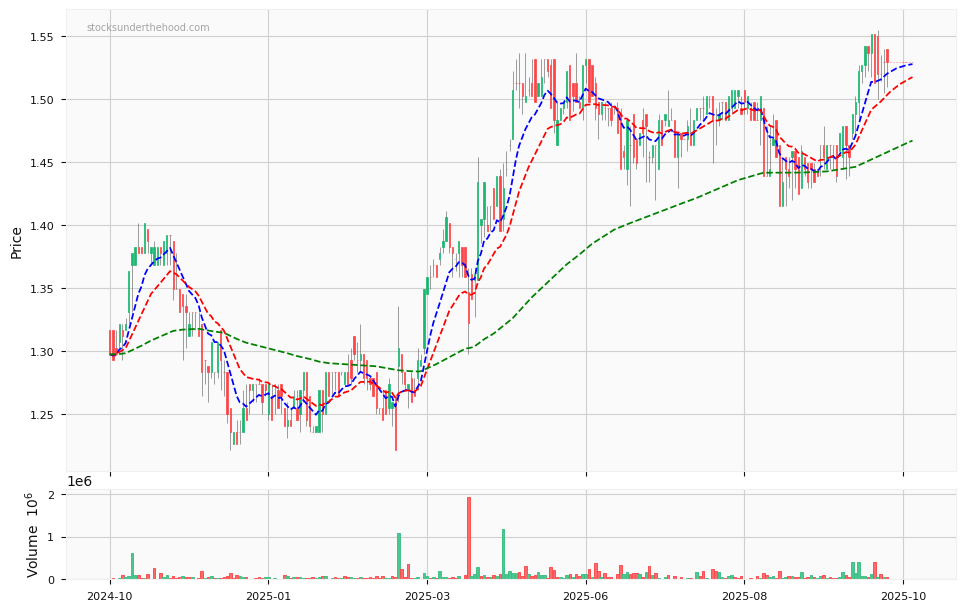
D2O Price Chart with Volume and 3EMA
D2O Short Positions
Click HERE to understand why the above moving averages have been chosen.
Ticker code: ERD
ERD Red Flags & Risk Indicators
⚠️
⚠️ RED FLAGS: 1 identified
Income Statement
| Revenue 2024 Per Share |
Revenue 2025e Per Share |
Revenue 2026e Per Share |
Revenue 24 to 25e [%] |
Revenue 25e to 26e [%] |
EBITDA 2024 Per Share |
EBITDA 2025e Per Share |
EBITDA 2026e Per Share |
EBITDA 24 to 25e [%] |
EBITDA 25e to 26e [%] |
| 0.9849 |
1.04481 |
1.07822 |
6.1 |
3.2 |
0.28842 |
0.31804 |
0.31615 |
10.3 |
-0.6 |
ERD Revenue Per Share (2012–2027)
✅
ERD Earnings before Interest, Tax, Depreciation and Amortisation (EBITDA) Per Share (2012–2027)
✅
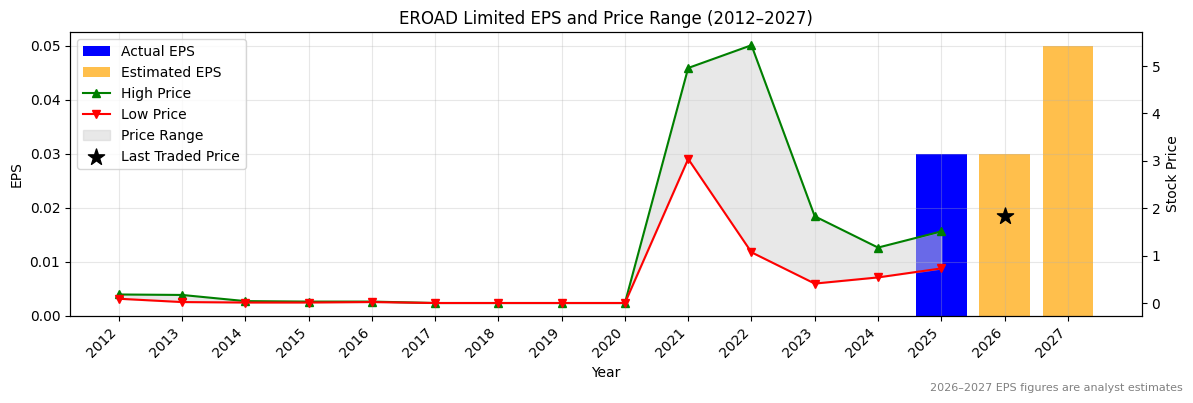
ERD Normalised Earnings Per Share (EPS) (2012–2027)
✅✅
Valuation
| Price To Sales |
Price To Book |
PER 2023 |
PER 2024 |
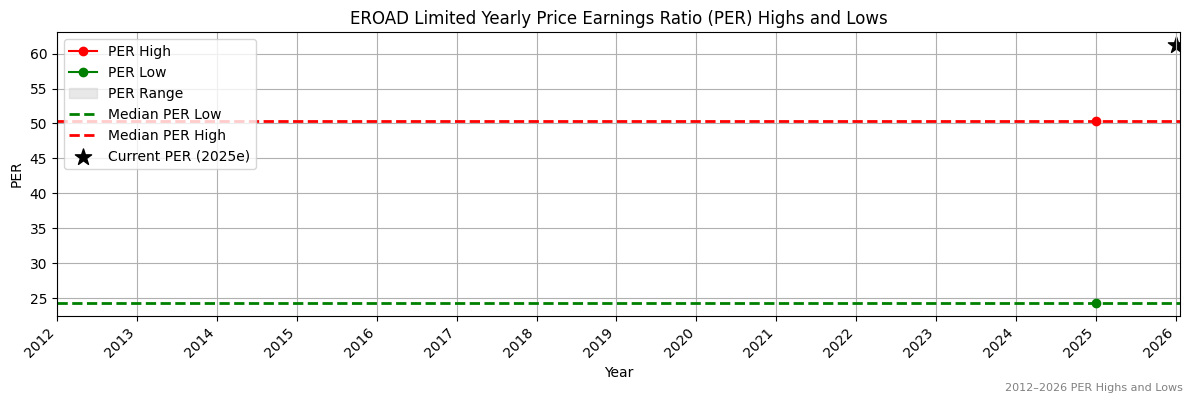
13Y Median PER Low |
PER 2025e |
13Y Median PER High |
PER 2026e |
Last Updated |
| 1.6 |
1.0 |
None |
None |
24.3 |
56.7 |
50.3 |
56.7 |
20/10/25 |
ERD Yearly Price Earnings Ratio (PER) Highs and Lows
❌
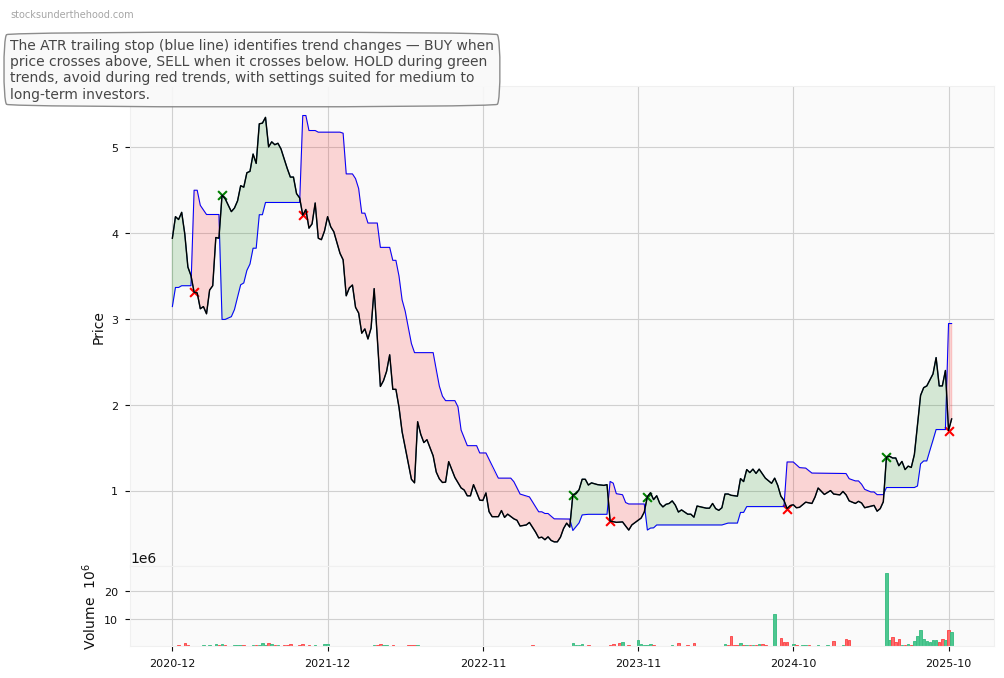
ERD Weekly Price Chart with Average True Range (ATR) Trailing Stop (10-Year View)
Ticker code: MLG
MLG Red Flags & Risk Indicators
✅
⚠️ RED FLAGS: 0 identified
No red flags detected.
Income Statement
| Revenue 2024 Per Share |
Revenue 2025e Per Share |
Revenue 2026e Per Share |
Revenue 24 to 25e [%] |
Revenue 25e to 26e [%] |
EBITDA 2024 Per Share |
EBITDA 2025e Per Share |
EBITDA 2026e Per Share |
EBITDA 24 to 25e [%] |
EBITDA 25e to 26e [%] |
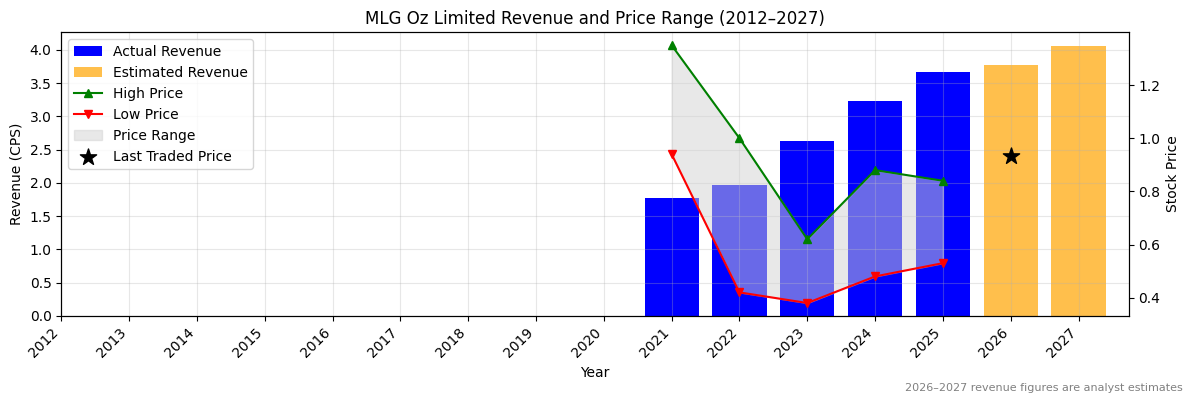
| 3.23467 |
3.66739 |
3.77577 |
13.4 |
3.0 |
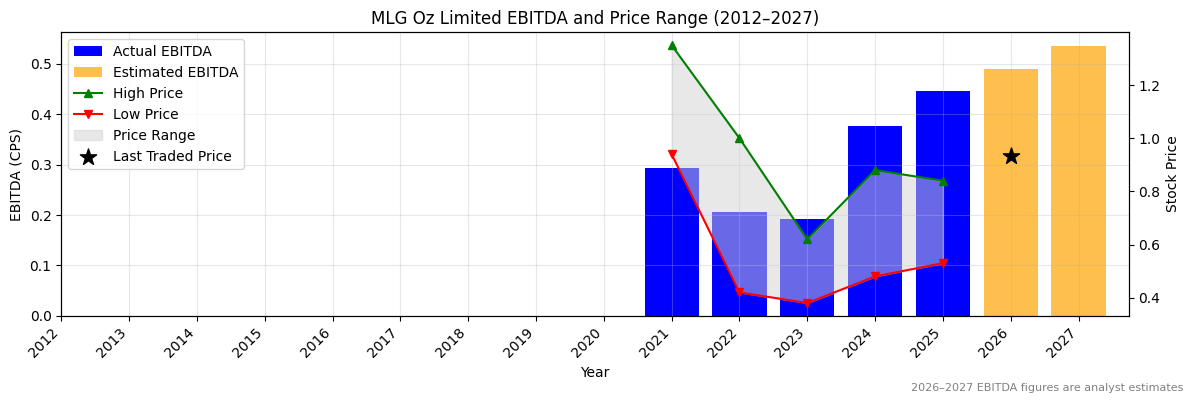
0.37663 |
0.44692 |
0.49053 |
18.7 |
9.8 |
MLG Revenue Per Share (2012–2027)
✅
MLG Earnings before Interest, Tax, Depreciation and Amortisation (EBITDA) Per Share (2012–2027)
✅
MLG Normalised Earnings Per Share (EPS) (2012–2027)
❌
Valuation
| Price To Sales |
Price To Book |
PER 2023 |
PER 2024 |
13Y Median PER Low |
PER 2025e |
13Y Median PER High |
PER 2026e |
Last Updated |
| 0.3 |
0.9 |
29.7 |
8.9 |
7.8 |
12.7 |
11.6 |
7.4 |
7/10/25 |
MLG Yearly Price Earnings Ratio (PER) Highs and Lows
❌
MLG Weekly Price Chart with Average True Range (ATR) Trailing Stop (10-Year View)
EROAD Limited (ASX:ERD) is a New Zealand-based technology provider offering electronic on-board units and SaaS solutions for the transport industry. It operates in New Zealand, the US, and Australia, connecting drivers, vehicles, and operations for compliance, safety, and real-time visibility.
Ticker code: ERD
Market Information
| Market Capitalisation |
Enterprise Value |
Shares Outstanding |
Free Float [%] |
Free Float Value |
| $244,801,712 |
$259,801,712 |
187587526.0 |
74.54 |
$182,463,613 |
Balance Sheet & Quality
| Equity |
Cash |
Debt |
Return On Equity (ROE) |
EBITDA 25 Margin [%] |
Net Debt / Equity [%] |
Rule of 40 |
| $187,212,348 |
$15,500,000 |
$30,500,000 |
3.0 |
30.4 |
8.0 |
35.4 |
Technicals & Short Data
| 3EMA Status |
Volatility [%] |
Value Traded Today |
Average Daily Liquidity |
Short [%] |
Days To Cover |
| Negative |
9.6 |
$114,631 |
$910,398 |
0.0 |
0.0 |
Dividends
| Previous Dividend |
Last Dividend |
Franking [%] |
Ex-Div Date |
Gross Yield [%] |
| None |
None |
100.0 |
None |
0.0 |
Price Performance Snapshot
| Last Traded Price |
Change [%] |
1 Week [%] |
1 Month [%] |
3 Months [%] |
6 Months [%] |
12 Months [%] |
| $1.305 |
0.8 |
-1.1 |
-23.2 |
-39.9 |
-6.8 |
54.4 |
ERD Price Chart with Volume and 3EMA
ERD Short Positions
Click HERE to understand why the above moving averages have been chosen.
MLG Oz Limited (ASX:MLG) is a Kalgoorlie-based integrated mining services and resource asset management company in Western Australia. It offers mine site solutions such as bulk haulage, crushing, civil construction, and materials supply across gold, iron ore, and base metals sectors.
Ticker code: MLG
Market Information
| Market Capitalisation |
Enterprise Value |
Shares Outstanding |
Free Float [%] |
Free Float Value |
| $133,244,260 |
$199,639,260 |
154935183.0 |
38.74 |
$51,614,381 |
Balance Sheet & Quality
| Equity |
Cash |
Debt |
Return On Equity (ROE) |
EBITDA 25 Margin [%] |
Net Debt / Equity [%] |
Rule of 40 |
| $151,991,412 |
$9,241,000 |
$75,636,000 |
6.8 |
12.2 |
43.7 |
25.0 |
Technicals & Short Data
| 3EMA Status |
Volatility [%] |
Value Traded Today |
Average Daily Liquidity |
Short [%] |
Days To Cover |
| Partial |
5.4 |
$62,657 |
$271,379 |
0.0 |
0.0 |
Dividends
| Previous Dividend |
Last Dividend |
Franking [%] |
Ex-Div Date |
Gross Yield [%] |
| None |
None |
100.0 |
2021-09-15 |
0.0 |
Price Performance Snapshot
| Last Traded Price |
Change [%] |
1 Week [%] |
1 Month [%] |
3 Months [%] |
6 Months [%] |
12 Months [%] |
| $0.860 |
-0.6 |
-3.4 |
-3.4 |
8.2 |
26.5 |
45.8 |
MLG Price Chart with Volume and 3EMA
MLG Short Positions
Click HERE to understand why the above moving averages have been chosen.
Ticker code: PTM
PTM Red Flags & Risk Indicators
⚠️
⚠️ RED FLAGS: 1 identified
Income Statement
| Revenue 2024 Per Share |
Revenue 2025e Per Share |
Revenue 2026e Per Share |
Revenue 24 to 25e [%] |
Revenue 25e to 26e [%] |
EBITDA 2024 Per Share |
EBITDA 2025e Per Share |
EBITDA 2026e Per Share |
EBITDA 24 to 25e [%] |
EBITDA 25e to 26e [%] |
| 0.29947 |
0.24033 |
0.05706 |
-19.7 |
-76.3 |
0.13979 |
0.11584 |
None |
-17.1 |
None |
PTM Revenue Per Share (2012–2027)
❌
PTM Earnings before Interest, Tax, Depreciation and Amortisation (EBITDA) Per Share (2012–2027)
❌
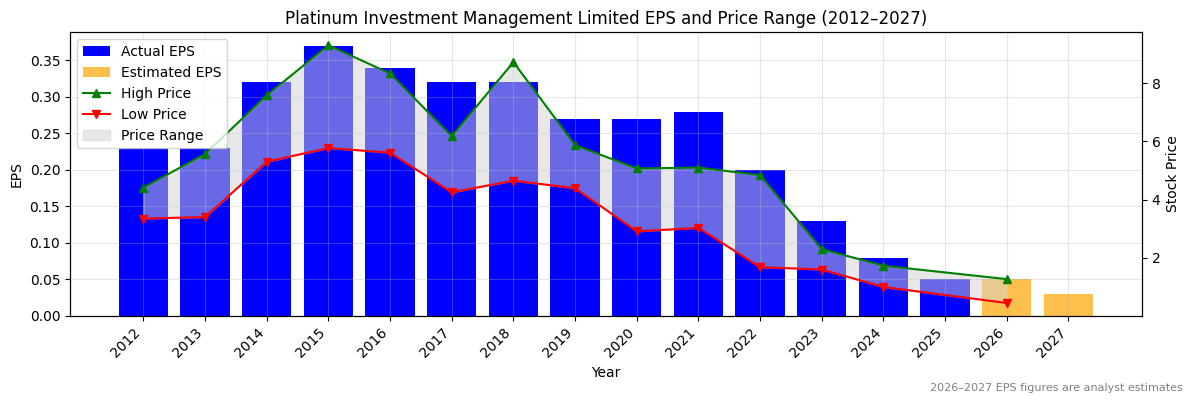
PTM Normalised Earnings Per Share (EPS) (2012–2027)
❌
Valuation
| Price To Sales |
Price To Book |
PER 2023 |
PER 2024 |
13Y Median PER Low |
PER 2025e |
13Y Median PER High |
PER 2026e |
Last Updated |
| 11.0 |
1.8 |
None |
None |
14.5 |
None |
21.7 |
None |
16/6/24 |
PTM Yearly Price Earnings Ratio (PER) Highs and Lows
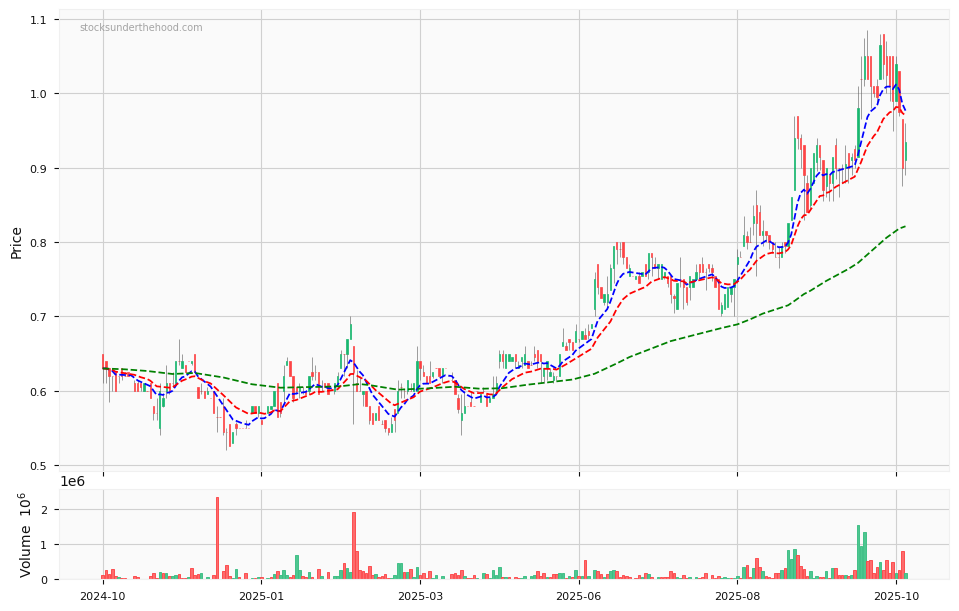
PTM Weekly Price Chart with Average True Range (ATR) Trailing Stop (10-Year View)
Platinum Asset Management Limited is an Australian-based fund manager specializing in international equities, offering a range of investment funds to retail and institutional investors.
Ticker code: PTM
Market Information
| Market Capitalisation |
Enterprise Value |
Shares Outstanding |
Free Float [%] |
Free Float Value |
| $404,606,146 |
$275,024,448 |
2239104293 |
13.18 |
$53,344,650 |
Balance Sheet & Quality
| Equity |
Cash |
Debt |
Return On Equity (ROE) |
EBITDA 24 Margin [%] |
Net Debt / Equity [%] |
Rule of 40 |
| None |
$122,247,000 |
$10,639,000 |
14.3 |
46.7 |
0.0 |
26.9 |
Technicals & Short Data
| 3EMA Status |
Volatility [%] |
Value Traded Today |
Average Daily Liquidity |
Short [%] |
Days To Cover |
| Partial |
None |
None |
None |
2.52 |
0.0 |
Dividends
| Previous Dividend |
Last Dividend |
Franking [%] |
Ex-Div Date |
Gross Yield [%] |
| $0.200 |
None |
100.0 |
2025-03-06 |
3.1 |
Price Performance Snapshot
| Last Traded Price |
Change [%] |
1 Week [%] |
1 Month [%] |
3 Months [%] |
6 Months [%] |
12 Months [%] |
| None |
None |
None |
None |
None |
None |
None |
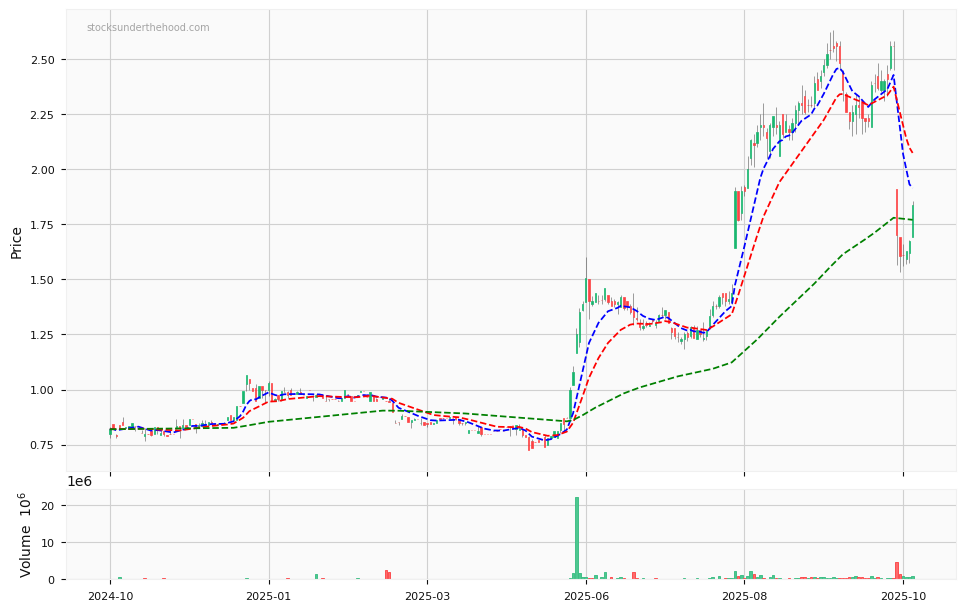
PTM Price Chart with Volume and 3EMA
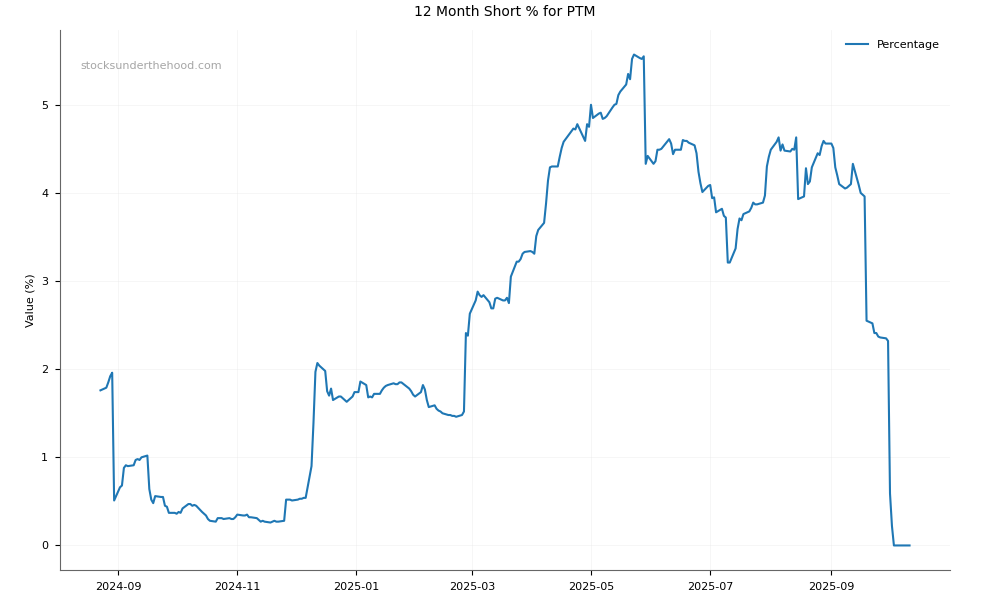
PTM Short Positions
Click HERE to understand why the above moving averages have been chosen.
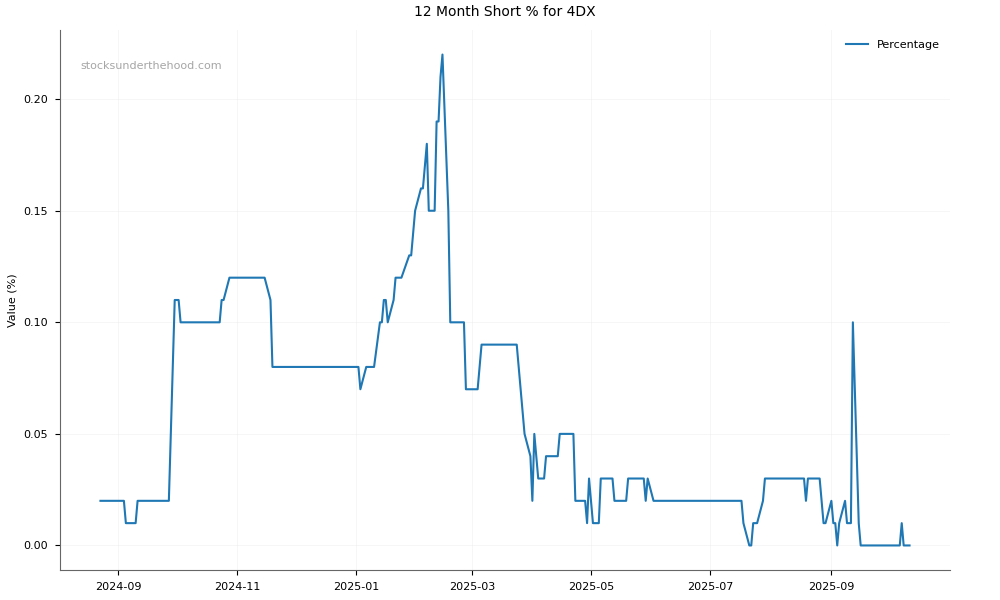
Ticker code: 4DX
4DX Red Flags & Risk Indicators
❌
⚠️ RED FLAGS: 5 identified
- Negative Operating Cash Flow
- Low Operating Margin
- Falling Revenues
- High Price to Book vs ROE
- Risk Of Capital Raise
Income Statement
| Revenue 2024 Per Share |
Revenue 2025e Per Share |
Revenue 2026e Per Share |
Revenue 24 to 25e [%] |
Revenue 25e to 26e [%] |
EBITDA 2024 Per Share |
EBITDA 2025e Per Share |
EBITDA 2026e Per Share |
EBITDA 24 to 25e [%] |
EBITDA 25e to 26e [%] |
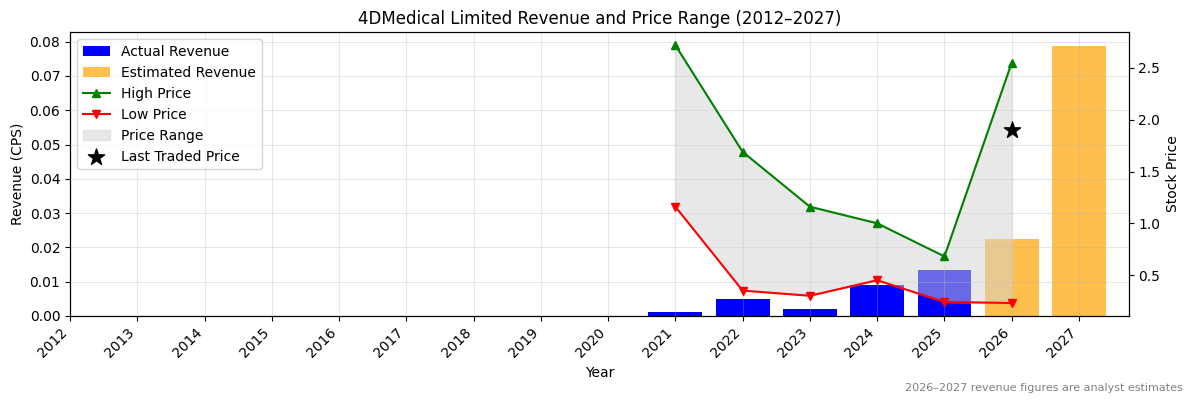
| 0.00914 |
0.01336 |
0.02246 |
46.2 |
68.1 |
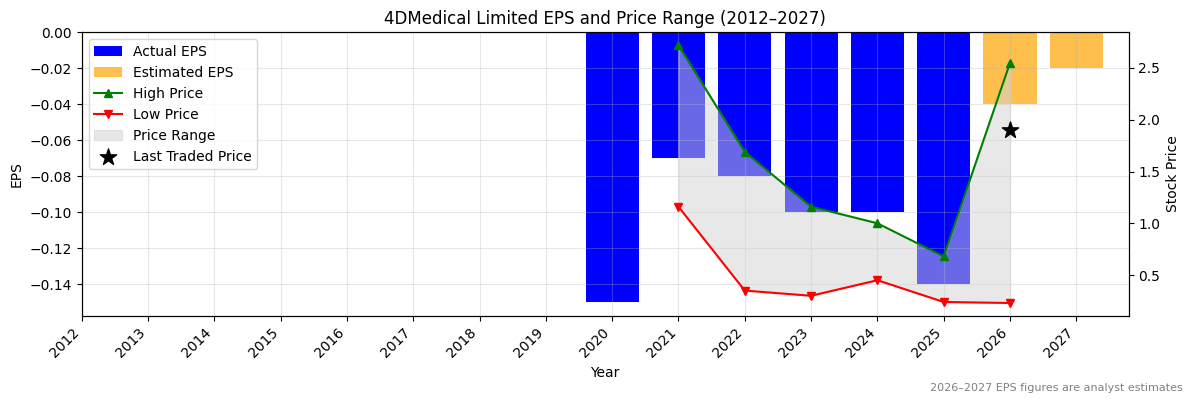
-0.08002 |
-0.05351 |
-0.06366 |
33.1 |
-19.0 |
4DX Revenue Per Share (2012–2027)
✅✅
4DX Earnings before Interest, Tax, Depreciation and Amortisation (EBITDA) Per Share (2012–2027)
✅✅
4DX Normalised Earnings Per Share (EPS) (2012–2027)
❌
Valuation
| Price To Sales |
Price To Book |
PER 2023 |
PER 2024 |
13Y Median PER Low |
PER 2025e |
13Y Median PER High |
PER 2026e |
Last Updated |
| 152.2 |
12.6 |
-17.4 |
-17.4 |
None |
-12.4 |
None |
-43.5 |
4/10/25 |
4DX Yearly Price Earnings Ratio (PER) Highs and Lows
4DX Weekly Price Chart with Average True Range (ATR) Trailing Stop (10-Year View)
Ticker code: PMT
PMT Red Flags & Risk Indicators
❌
⚠️ RED FLAGS: 4 identified
- Negative Operating Cash Flow
- Large Share Issuance
- Zero Revenue
- Falling Earnings
Income Statement
| Revenue 2024 Per Share |
Revenue 2025e Per Share |
Revenue 2026e Per Share |
Revenue 24 to 25e [%] |
Revenue 25e to 26e [%] |
EBITDA 2024 Per Share |
EBITDA 2025e Per Share |
EBITDA 2026e Per Share |
EBITDA 24 to 25e [%] |
EBITDA 25e to 26e [%] |
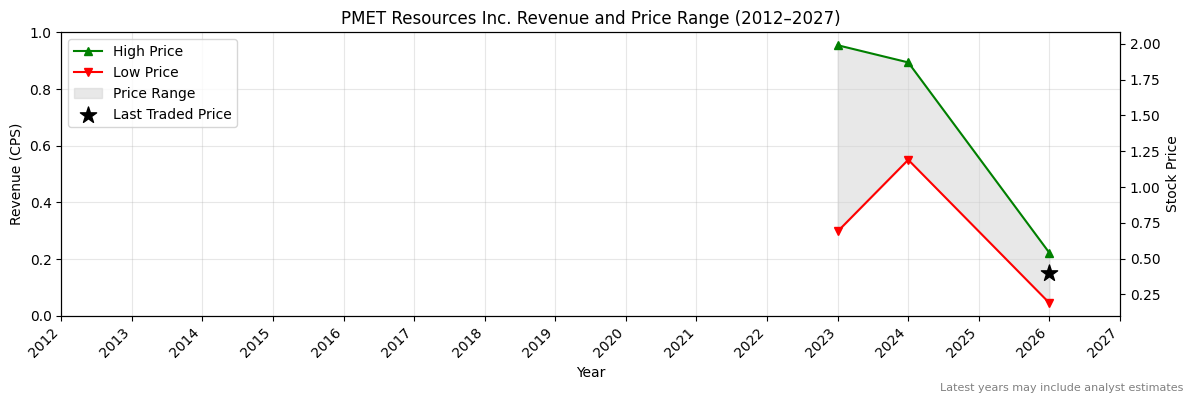
| None |
None |
None |
None |
None |
-0.01592 |
-0.0133 |
-0.01226 |
16.4 |
7.8 |
PMT Revenue Per Share (2012–2027)
PMT Earnings before Interest, Tax, Depreciation and Amortisation (EBITDA) Per Share (2012–2027)
✅
PMT Normalised Earnings Per Share (EPS) (2012–2027)
Valuation
| Price To Sales |
Price To Book |
PER 2023 |
PER 2024 |
13Y Median PER Low |
PER 2025e |
13Y Median PER High |
PER 2026e |
Last Updated |
| None |
0.2 |
None |
None |
None |
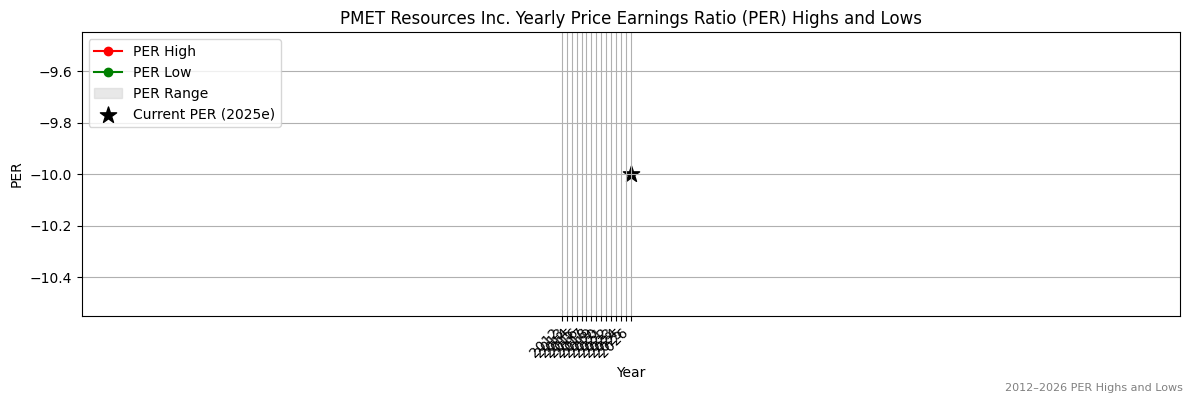
-10.0 |
None |
-10.0 |
27/11/24 |
PMT Yearly Price Earnings Ratio (PER) Highs and Lows
PMT Weekly Price Chart with Average True Range (ATR) Trailing Stop (10-Year View)
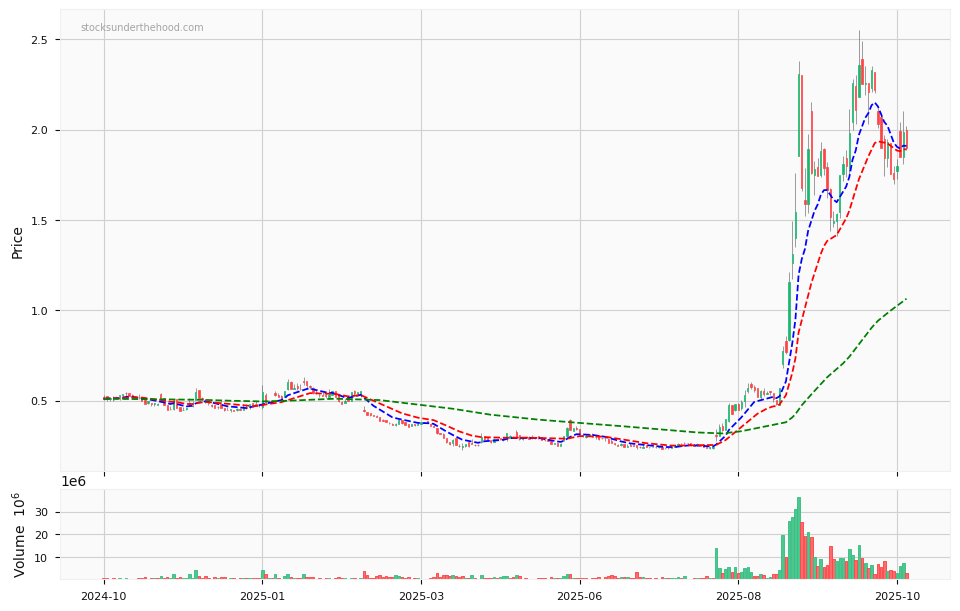
4DMedical Limited (ASX:4DX) is an Australian medical technology company specializing in advanced diagnostic imaging solutions for respiratory conditions. It leverages proprietary XV Technology and Imbio Technology to provide thoracic imaging tools, including lung ventilation analysis software and scanners.
Ticker code: 4DX
Market Information
| Market Capitalisation |
Enterprise Value |
Shares Outstanding |
Free Float [%] |
Free Float Value |
| $882,448,312 |
$879,877,618 |
516051633.0 |
77.47 |
$683,651,109 |
Balance Sheet & Quality
| Equity |
Cash |
Debt |
Return On Equity (ROE) |
EBITDA 25 Margin [%] |
Net Debt / Equity [%] |
Rule of 40 |
| $71,215,123 |
$6,878,735 |
$4,308,041 |
-86.1 |
-400.6 |
-3.6 |
None |
Technicals & Short Data
| 3EMA Status |
Volatility [%] |
Value Traded Today |
Average Daily Liquidity |
Short [%] |
Days To Cover |
| Partial |
8.7 |
$5,849,481 |
$13,830,316 |
0.02 |
0.0 |
Dividends
| Previous Dividend |
Last Dividend |
Franking [%] |
Ex-Div Date |
Gross Yield [%] |
| None |
None |
100.0 |
None |
0.0 |
Price Performance Snapshot
| Last Traded Price |
Change [%] |
1 Week [%] |
1 Month [%] |
3 Months [%] |
6 Months [%] |
12 Months [%] |
| $1.710 |
6.2 |
11.0 |
-1.7 |
120.6 |
460.7 |
232.0 |
4DX Price Chart with Volume and 3EMA
4DX Short Positions
Click HERE to understand why the above moving averages have been chosen.
Patriot Battery Metals Inc. is a mineral exploration company focused on the acquisition and development of mineral properties, particularly those containing battery metals such as lithium and copper, with projects in Canada.
Ticker code: PMT
Sector:
Basic Materials | Industry:
Other Industrial Metals & Mining | Website:
https://www.pmet.ca
Market Information
| Market Capitalisation |
Enterprise Value |
Shares Outstanding |
Free Float [%] |
Free Float Value |
| $892,486,312 |
$831,604,312 |
1622702350 |
8.34 |
$74,474,413 |
Balance Sheet & Quality
| Equity |
Cash |
Debt |
Return On Equity (ROE) |
EBITDA 25 Margin [%] |
Net Debt / Equity [%] |
Rule of 40 |
| $3,165,892,292 |
$61,204,000 |
$322,000 |
-2.1 |
None |
-1.9 |
None |
Technicals & Short Data
| 3EMA Status |
Volatility [%] |
Value Traded Today |
Average Daily Liquidity |
Short [%] |
Days To Cover |
| Positive |
15.6 |
$1,297,525 |
$1,441,839 |
None |
0.0 |
Dividends
| Previous Dividend |
Last Dividend |
Franking [%] |
Ex-Div Date |
Gross Yield [%] |
| None |
None |
None |
None |
0.0 |
Price Performance Snapshot
| Last Traded Price |
Change [%] |
1 Week [%] |
1 Month [%] |
3 Months [%] |
6 Months [%] |
12 Months [%] |
| $0.550 |
2.8 |
17.0 |
37.5 |
32.5 |
144.4 |
89.7 |
PMT Price Chart with Volume and 3EMA
PMT Short Positions
Click HERE to understand why the above moving averages have been chosen.
Ticker code: ELV
ELV Red Flags & Risk Indicators
✅
⚠️ RED FLAGS: 0 identified
No red flags detected.
Income Statement
| Revenue 2024 Per Share |
Revenue 2025e Per Share |
Revenue 2026e Per Share |
Revenue 24 to 25e [%] |
Revenue 25e to 26e [%] |
EBITDA 2024 Per Share |
EBITDA 2025e Per Share |
EBITDA 2026e Per Share |
EBITDA 24 to 25e [%] |
EBITDA 25e to 26e [%] |
| None |
None |
None |
None |
None |
None |
None |
None |
None |
None |
ELV Revenue Per Share (2012–2027)
ELV Earnings before Interest, Tax, Depreciation and Amortisation (EBITDA) Per Share (2012–2027)
ELV Normalised Earnings Per Share (EPS) (2012–2027)
Valuation
| Price To Sales |
Price To Book |
PER 2023 |
PER 2024 |
13Y Median PER Low |
PER 2025e |
13Y Median PER High |
PER 2026e |
Last Updated |
| 3.4 |
0.8 |
None |
None |
None |
None |
None |
None |
None |
ELV Yearly Price Earnings Ratio (PER) Highs and Lows
ELV Weekly Price Chart with Average True Range (ATR) Trailing Stop (10-Year View)
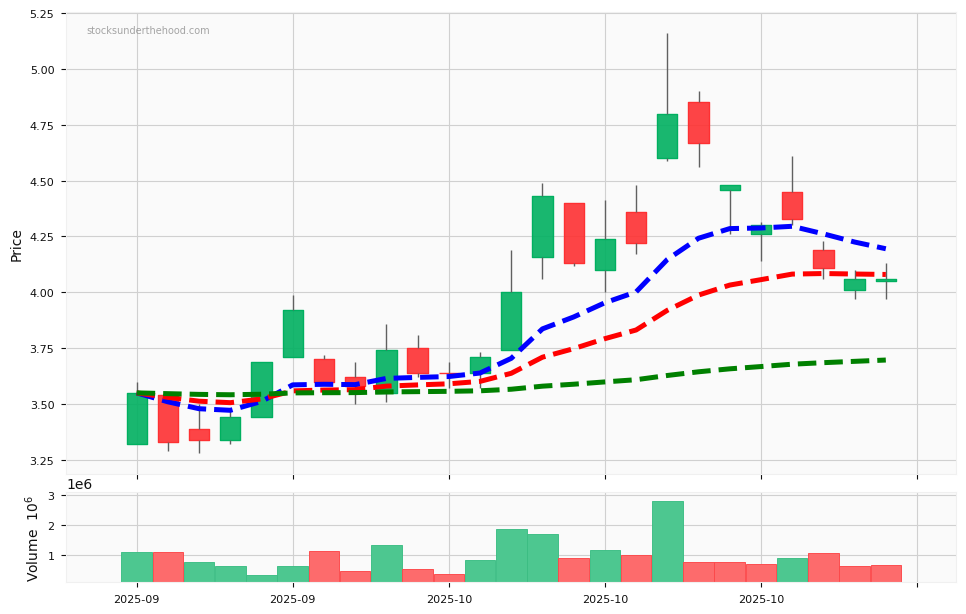
Elevra Lithium Limited (ASX:ELV) explores and develops lithium assets in North America and Australia. It holds projects like Moblan and Carolina Lithium, plus graphite and gold interests.
Ticker code: ELV
Market Information
| Market Capitalisation |
Enterprise Value |
Shares Outstanding |
Free Float [%] |
Free Float Value |
| $978,722,240 |
$495,656,544 |
169329111 |
39.27 |
$384,384,372 |
Balance Sheet & Quality
| Equity |
Cash |
Debt |
Return On Equity (ROE) |
EBITDA 25 Margin [%] |
Net Debt / Equity [%] |
Rule of 40 |
| $945,025,705 |
$72,290,000 |
$77,551,000 |
None |
None |
0.6 |
None |
Technicals & Short Data
| 3EMA Status |
Volatility [%] |
Value Traded Today |
Average Daily Liquidity |
Short [%] |
Days To Cover |
| Positive |
15.5 |
$7,838,247 |
$6,845,445 |
None |
0.0 |
Dividends
| Previous Dividend |
Last Dividend |
Franking [%] |
Ex-Div Date |
Gross Yield [%] |
| None |
None |
None |
None |
None |
Price Performance Snapshot
| Last Traded Price |
Change [%] |
1 Week [%] |
1 Month [%] |
3 Months [%] |
6 Months [%] |
12 Months [%] |
| $5.780 |
5.9 |
12.7 |
29.9 |
126.7 |
None |
None |
ELV Price Chart with Volume and 3EMA
ELV Short Positions
No chart available for this company.
Click HERE to understand why the above moving averages have been chosen.
Ticker code: None
None Red Flags & Risk Indicators
✅
⚠️ RED FLAGS: 0 identified
No red flags detected.
Income Statement
| Revenue 2024 Per Share |
Revenue 2025e Per Share |
Revenue 2026e Per Share |
Revenue 24 to 25e [%] |
Revenue 25e to 26e [%] |
EBITDA 2024 Per Share |
EBITDA 2025e Per Share |
EBITDA 2026e Per Share |
EBITDA 24 to 25e [%] |
EBITDA 25e to 26e [%] |
| 0.77084 |
0.80453 |
0.78713 |
4.4 |
-2.2 |
$0.130 |
$0.160 |
None |
23.08% |
None |
None Revenue Per Share (2012–2027)
✅
None Earnings before Interest, Tax, Depreciation and Amortisation (EBITDA) Per Share (2012–2027)
✅✅
None Normalised Earnings Per Share (EPS) (2012–2027)
Valuation
| Price To Sales |
Price To Book |
PER 2023 |
PER 2024 |
13Y Median PER Low |
PER 2025e |
13Y Median PER High |
PER 2026e |
Last Updated |
| 17.2 |
None |
None |
9/2/25 |
0.0 |
15.6 |
14.3 |
0.0 |
10.1 |
None Yearly Price Earnings Ratio (PER) Highs and Lows
❌
None Weekly Price Chart with Average True Range (ATR) Trailing Stop (10-Year View)
Ticker code: HMY
HMY Red Flags & Risk Indicators
⚠️
⚠️ RED FLAGS: 1 identified
Income Statement
| Revenue 2024 Per Share |
Revenue 2025e Per Share |
Revenue 2026e Per Share |
Revenue 24 to 25e [%] |
Revenue 25e to 26e [%] |
EBITDA 2024 Per Share |
EBITDA 2025e Per Share |
EBITDA 2026e Per Share |
EBITDA 24 to 25e [%] |
EBITDA 25e to 26e [%] |
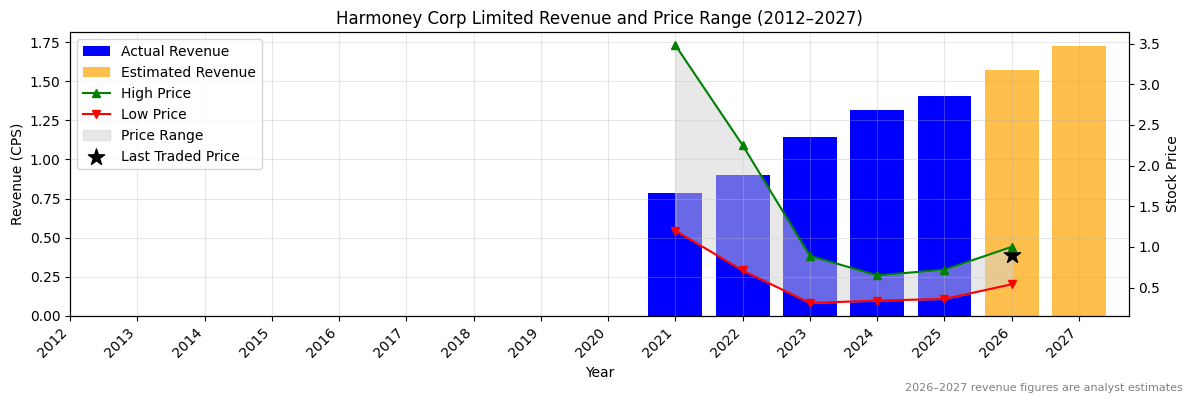
| 1.31333 |
1.40408 |
1.57491 |
6.9 |
12.2 |
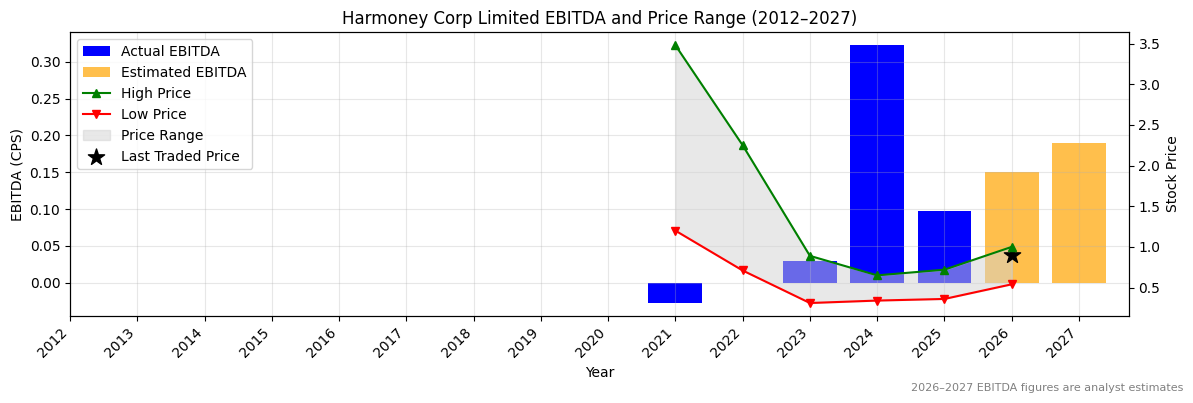
0.32245 |
0.09798 |
0.15088 |
-69.6 |
54.0 |
HMY Revenue Per Share (2012–2027)
✅
HMY Earnings before Interest, Tax, Depreciation and Amortisation (EBITDA) Per Share (2012–2027)
❌
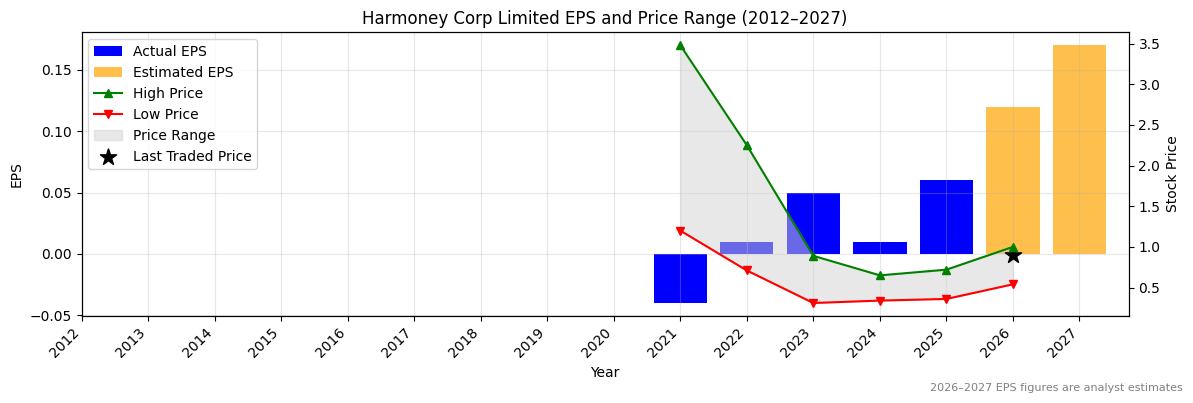
HMY Normalised Earnings Per Share (EPS) (2012–2027)
Valuation
| Price To Sales |
Price To Book |
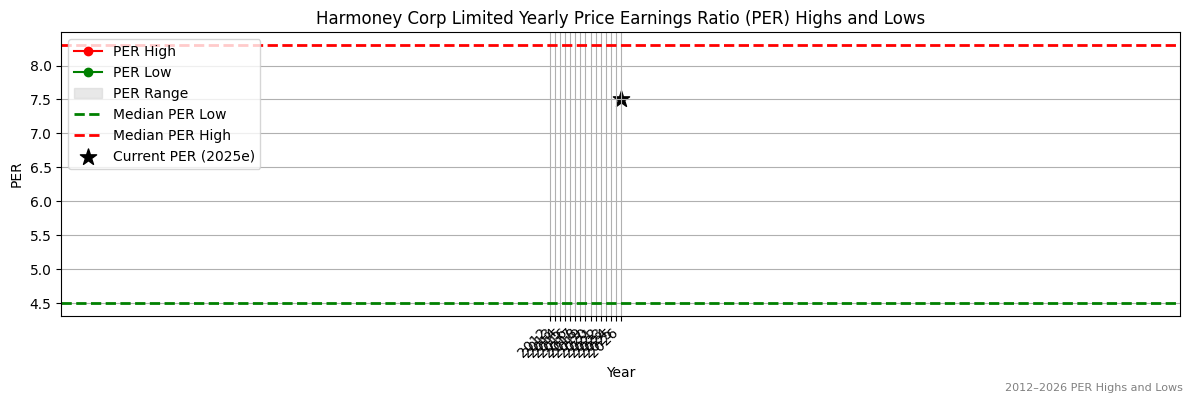
PER 2023 |
PER 2024 |
13Y Median PER Low |
PER 2025e |
13Y Median PER High |
PER 2026e |
Last Updated |
| 2.2 |
2.8 |
18.8 |
94.0 |
4.5 |
15.7 |
8.3 |
7.8 |
11/10/25 |
HMY Yearly Price Earnings Ratio (PER) Highs and Lows
❌
HMY Weekly Price Chart with Average True Range (ATR) Trailing Stop (10-Year View)