Ticker code: LYL
LYL Red Flags & Risk Indicators
⚠️
⚠️ RED FLAGS: 2 identified
- Falling Earnings
- High Relative Valuation
Income Statement
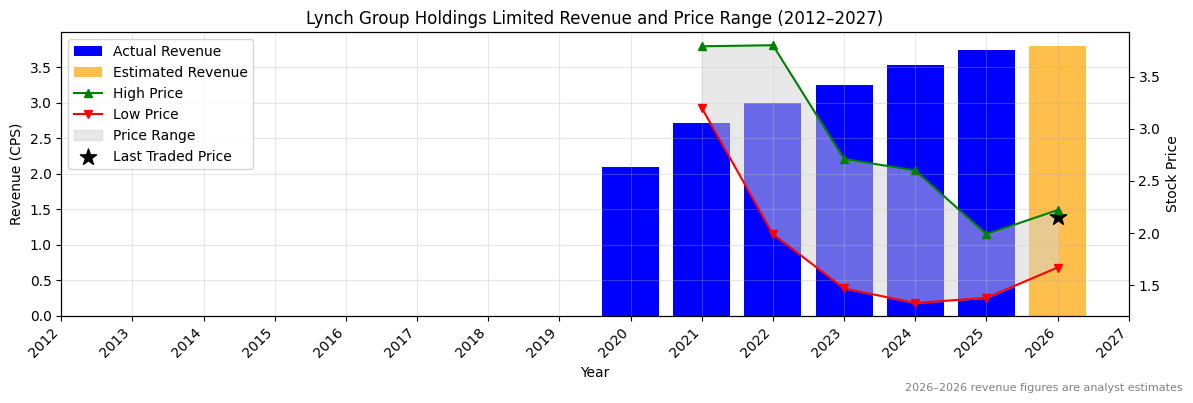
| Revenue 2024 Per Share |
Revenue 2025e Per Share |
Revenue 2026e Per Share |
Revenue 24 to 25e [%] |
Revenue 25e to 26e [%] |
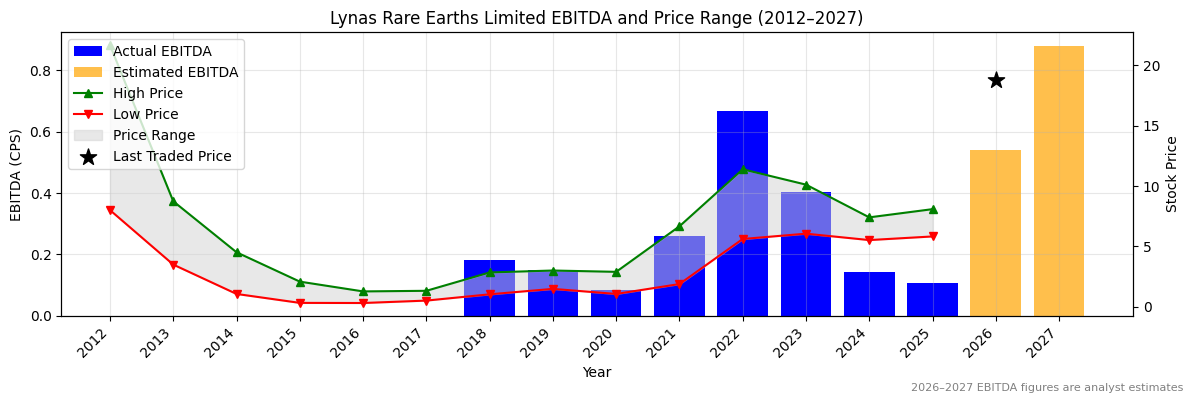
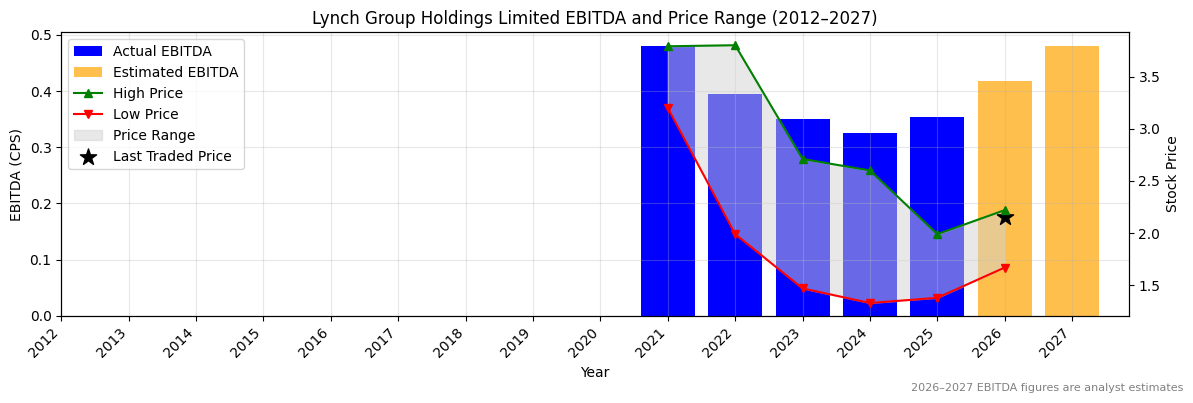
EBITDA 2024 Per Share |
EBITDA 2025e Per Share |
EBITDA 2026e Per Share |
EBITDA 24 to 25e [%] |
EBITDA 25e to 26e [%] |
| 6.79412 |
None |
None |
None |
None |
1.47654 |
None |
None |
None |
None |
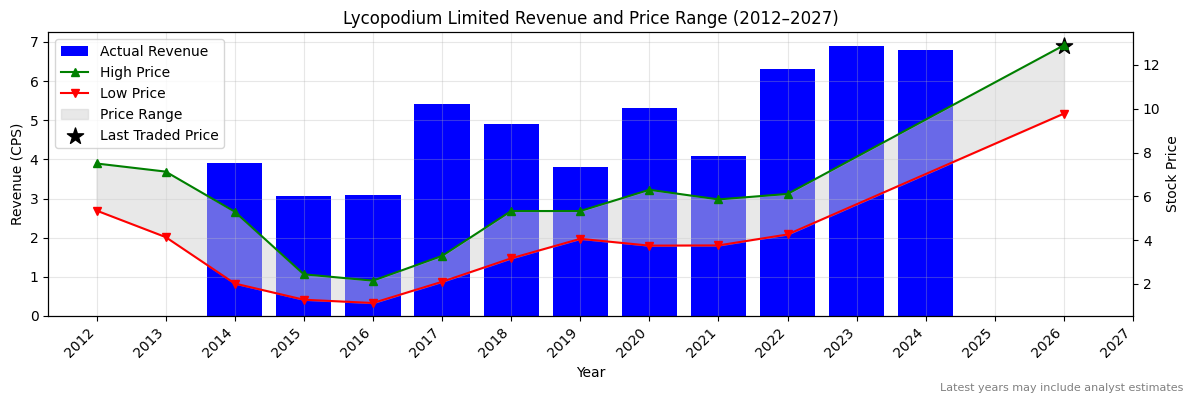
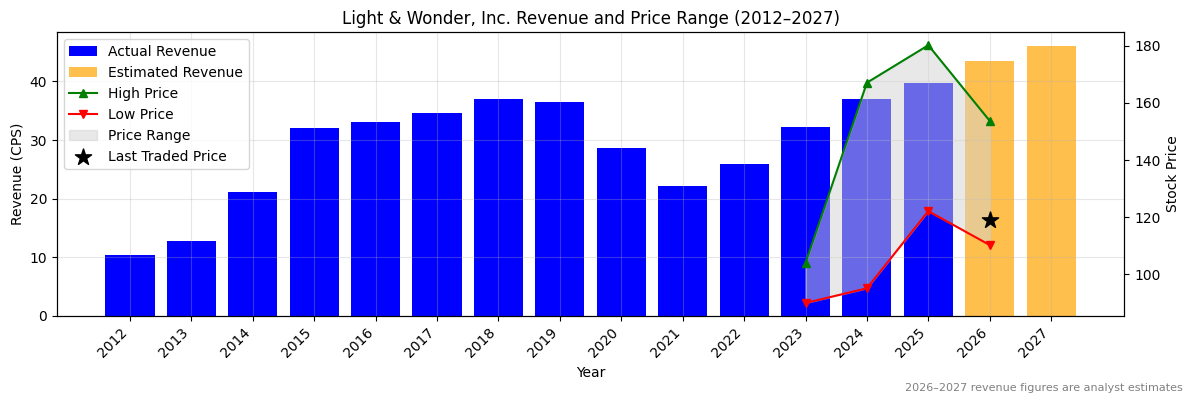
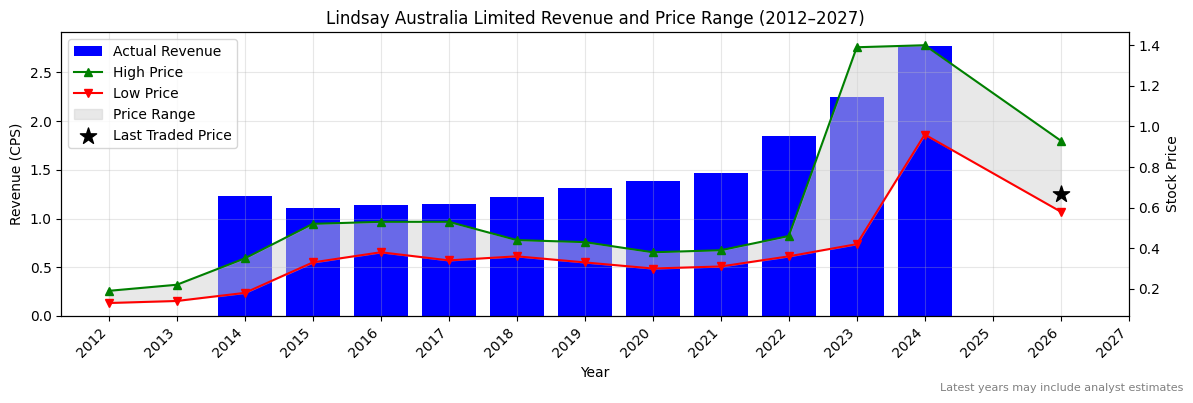
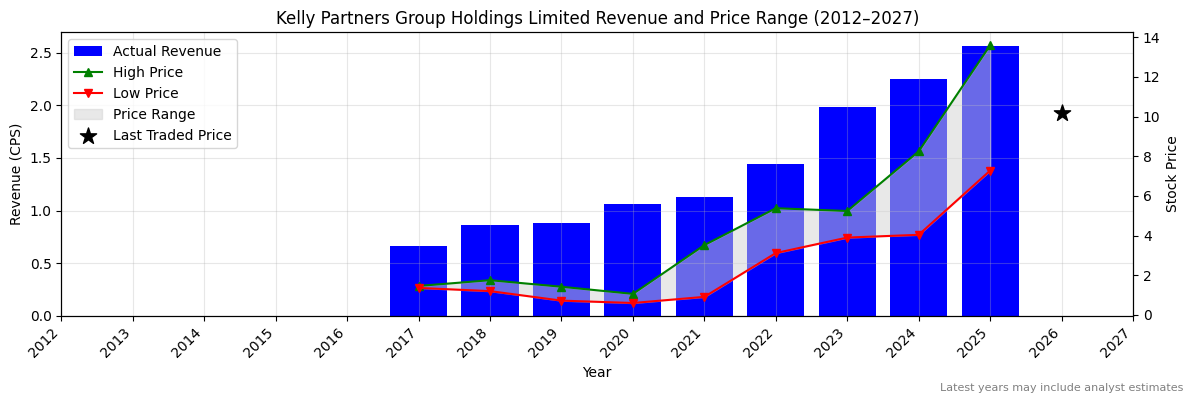
LYL Revenue Per Share (2012–2027)
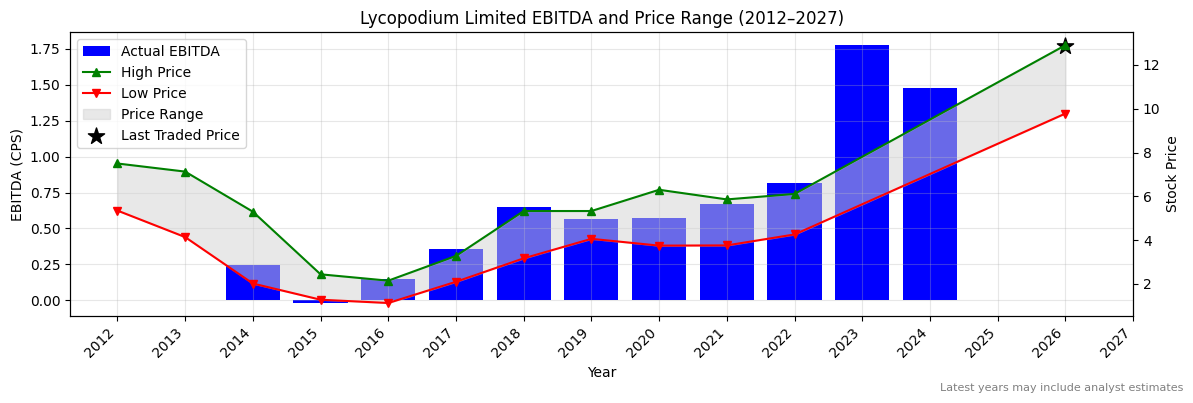
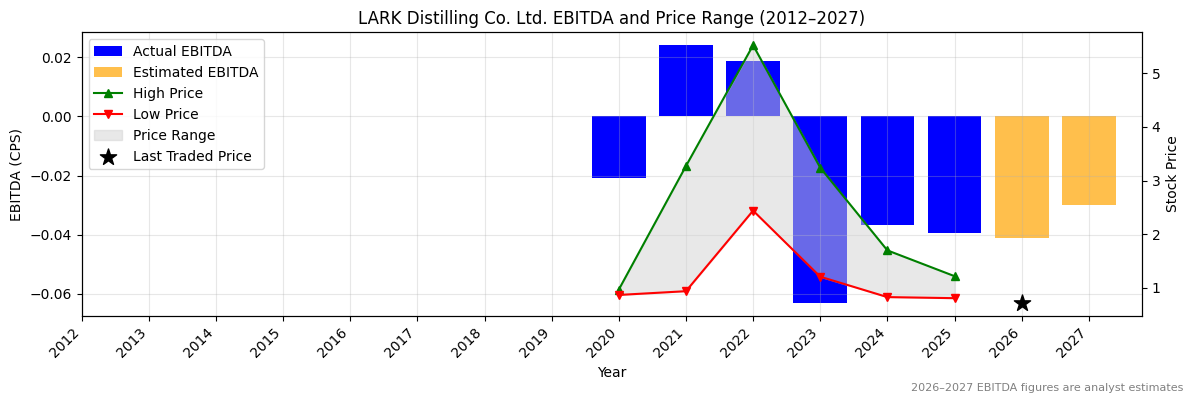
LYL Earnings before Interest, Tax, Depreciation and Amortisation (EBITDA) Per Share (2012–2027)
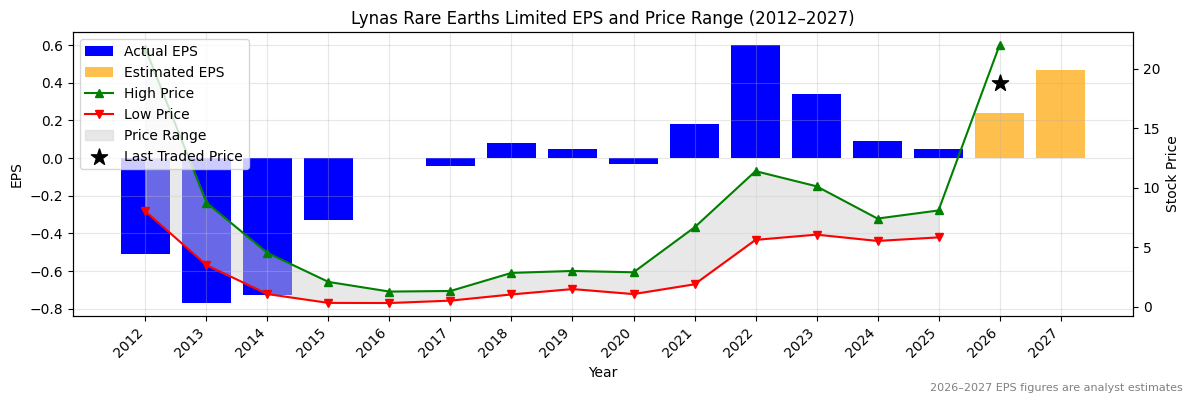
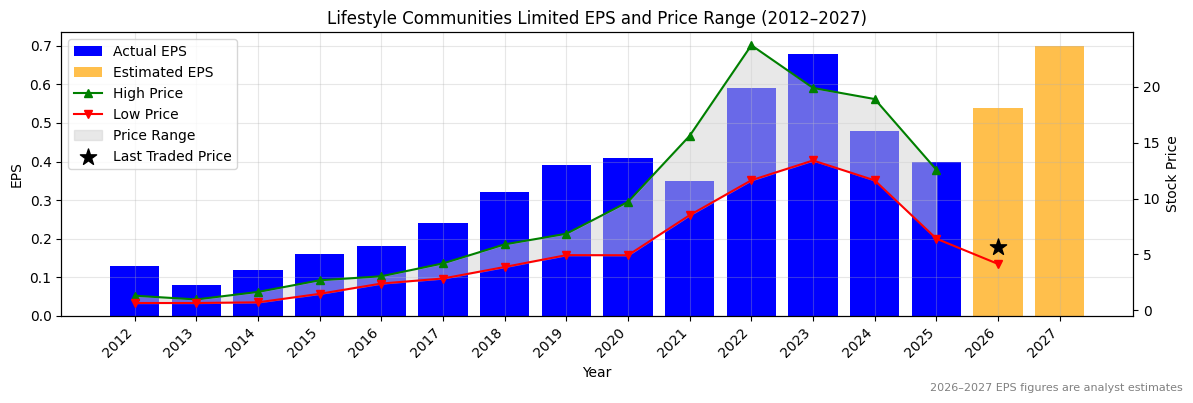
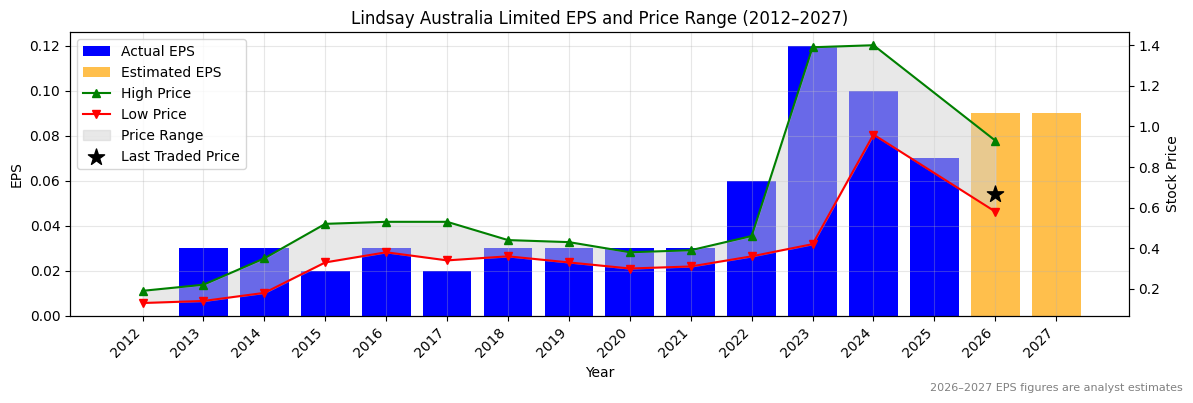
LYL Normalised Earnings Per Share (EPS) (2012–2027)
Valuation
| Price To Sales |
Price To Book |
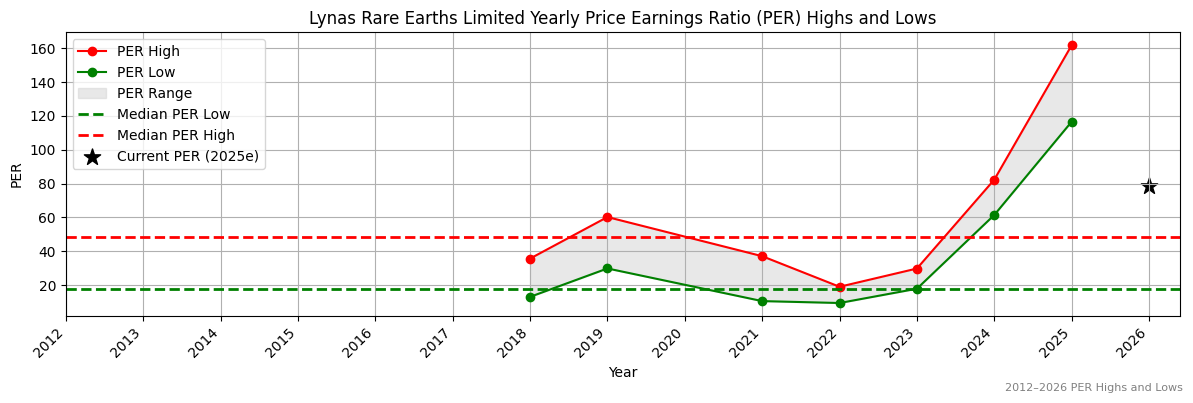
PER 2023 |
PER 2024 |
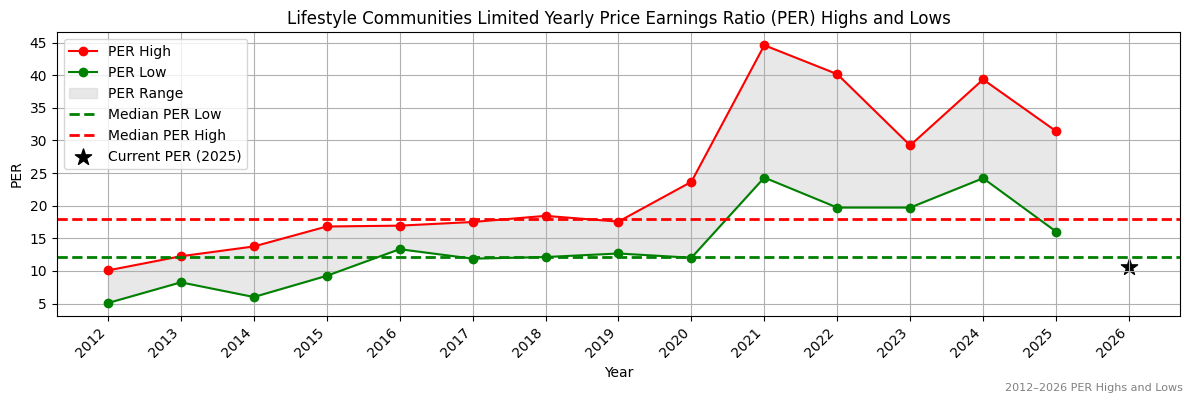
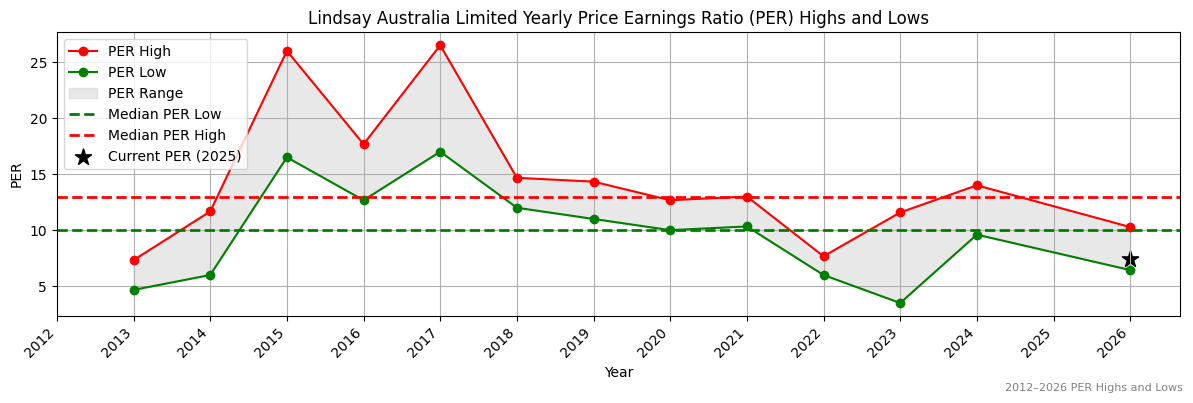
13Y Median PER Low |
PER 2025e |
13Y Median PER High |
PER 2026e |
Last Updated |
| 1.5 |
3.2 |
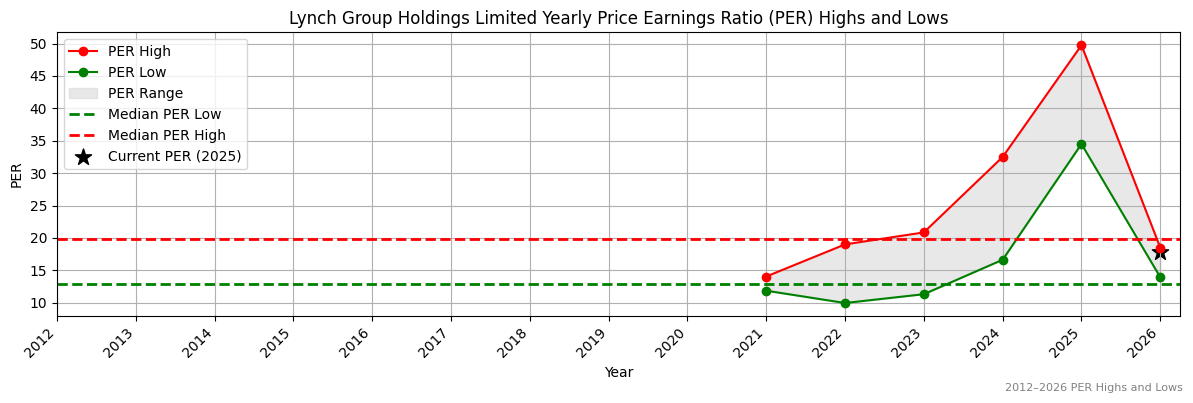
23.3 |
23.8 |
9.6 |
None |
13.0 |
None |
29/2/24 |
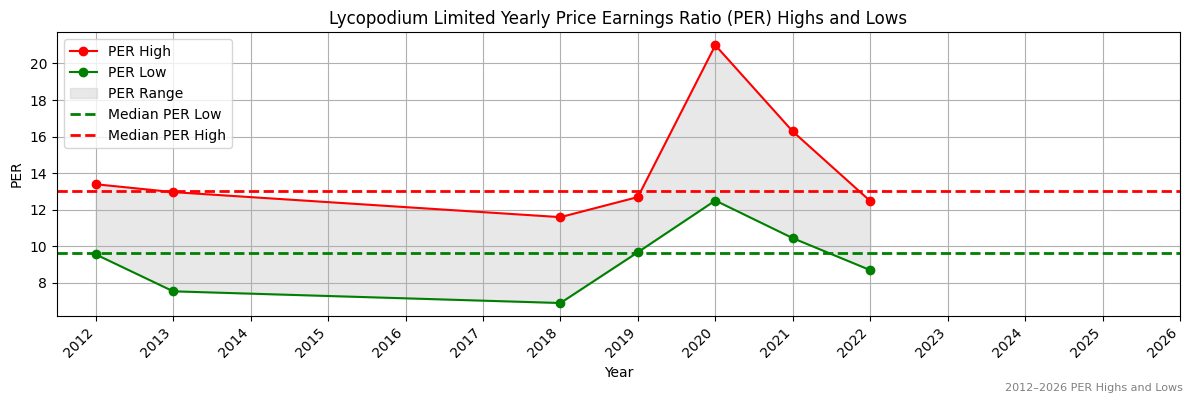
LYL Yearly Price Earnings Ratio (PER) Highs and Lows
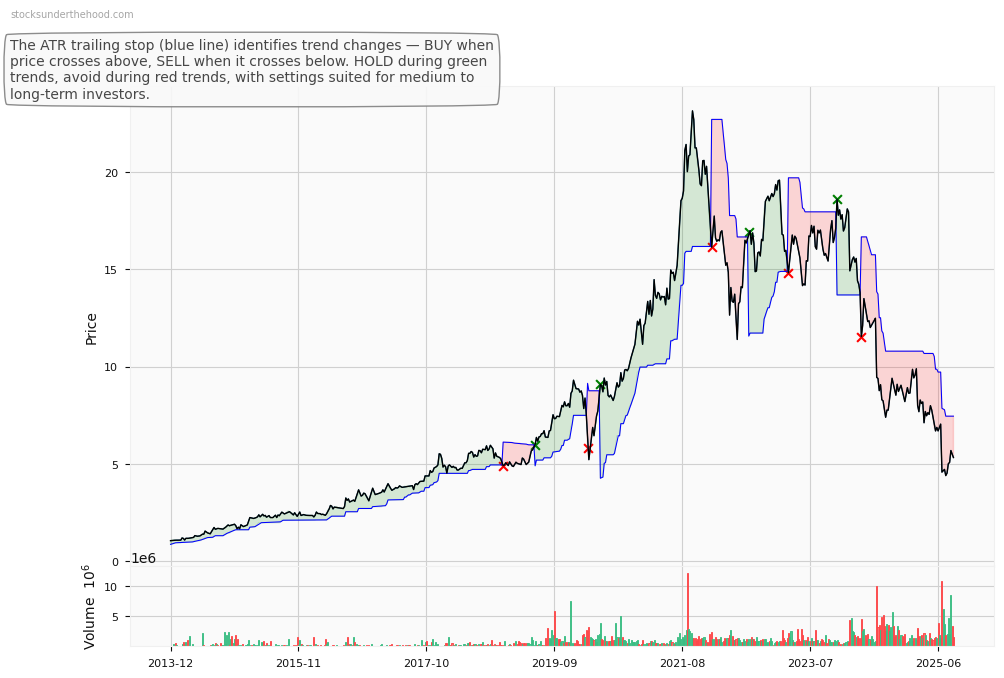
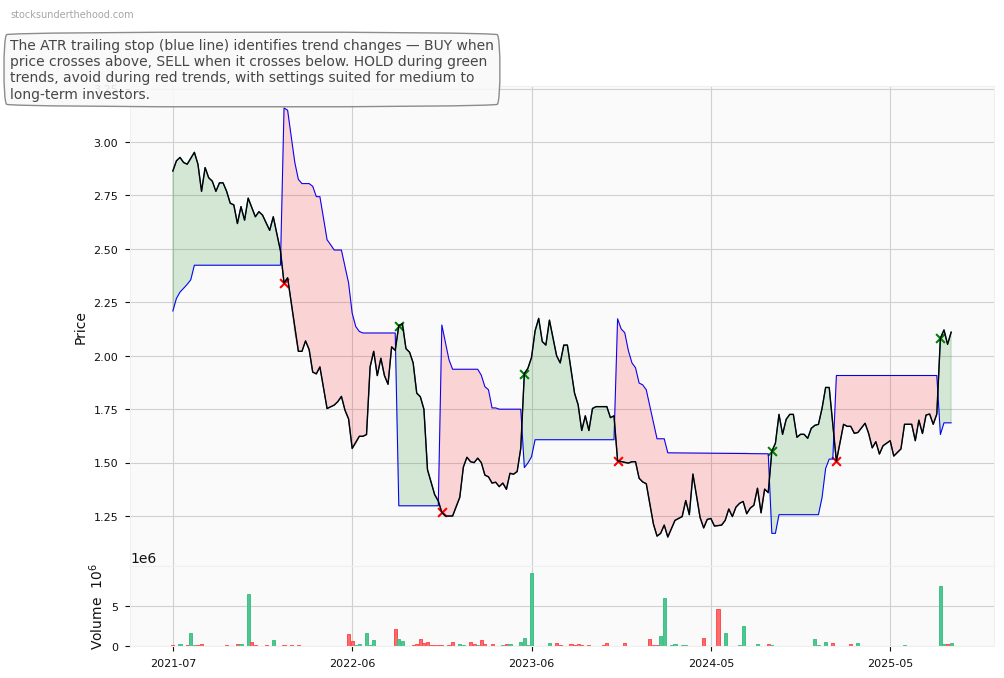
LYL Weekly Price Chart with Average True Range (ATR) Trailing Stop (10-Year View)
Ticker code: LYC
LYC Red Flags & Risk Indicators
❌
⚠️ RED FLAGS: 4 identified
- Falling Earnings
- High Price to Book vs ROE
- High Relative Valuation
- Falling EBITDA Margins
Income Statement
| Revenue 2024 Per Share |
Revenue 2025e Per Share |
Revenue 2026e Per Share |
Revenue 24 to 25e [%] |
Revenue 25e to 26e [%] |
EBITDA 2024 Per Share |
EBITDA 2025e Per Share |
EBITDA 2026e Per Share |
EBITDA 24 to 25e [%] |
EBITDA 25e to 26e [%] |
| 0.49613 |
0.57979 |
0.96124 |
16.9 |
65.8 |
0.1415 |
0.10836 |
0.54074 |
-23.4 |
399.0 |
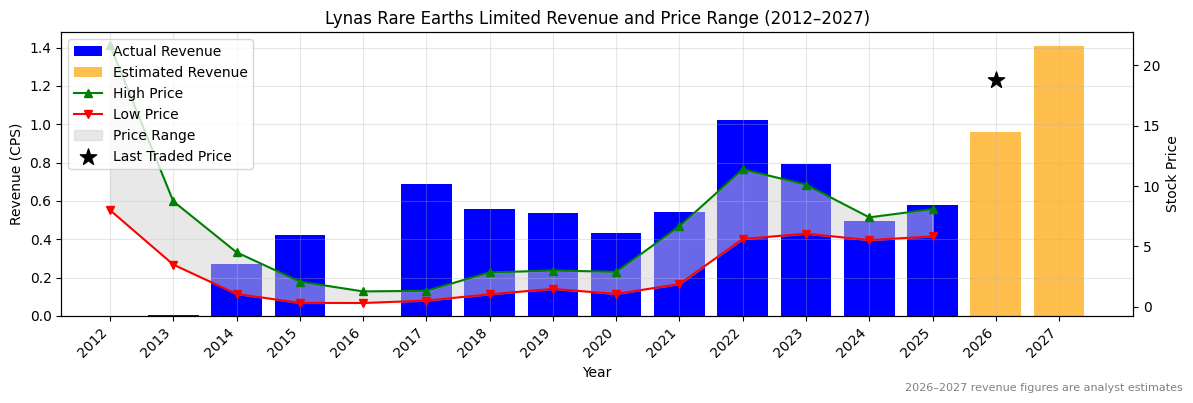
LYC Revenue Per Share (2012–2027)
✅
LYC Earnings before Interest, Tax, Depreciation and Amortisation (EBITDA) Per Share (2012–2027)
❌
LYC Normalised Earnings Per Share (EPS) (2012–2027)
❌
Valuation
| Price To Sales |
Price To Book |
PER 2023 |
PER 2024 |
13Y Median PER Low |
PER 2025e |
13Y Median PER High |
PER 2026e |
Last Updated |
| 27.6 |
6.1 |
44.9 |
169.4 |
17.8 |
305.0 |
48.6 |
63.5 |
4/10/25 |
LYC Yearly Price Earnings Ratio (PER) Highs and Lows
❌
LYC Weekly Price Chart with Average True Range (ATR) Trailing Stop (10-Year View)
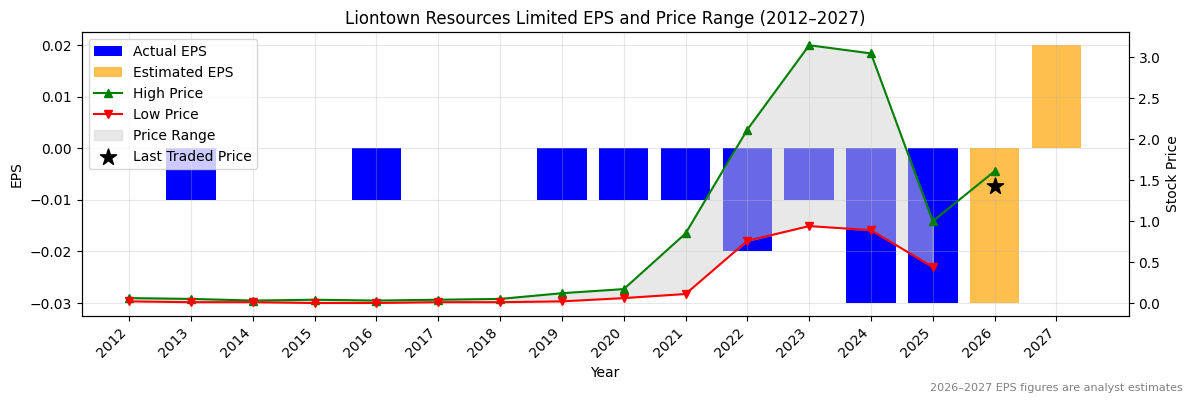
Ticker code: LTR
LTR Red Flags & Risk Indicators
❌
⚠️ RED FLAGS: 8 identified
- Negative Operating Cash Flow
- Low Operating Margin
- Highly Shorted
- Increasing Shorts
- Zero Revenue
- Falling Earnings
- More Net Debt Than Equity
- High Price to Book vs ROE
Income Statement
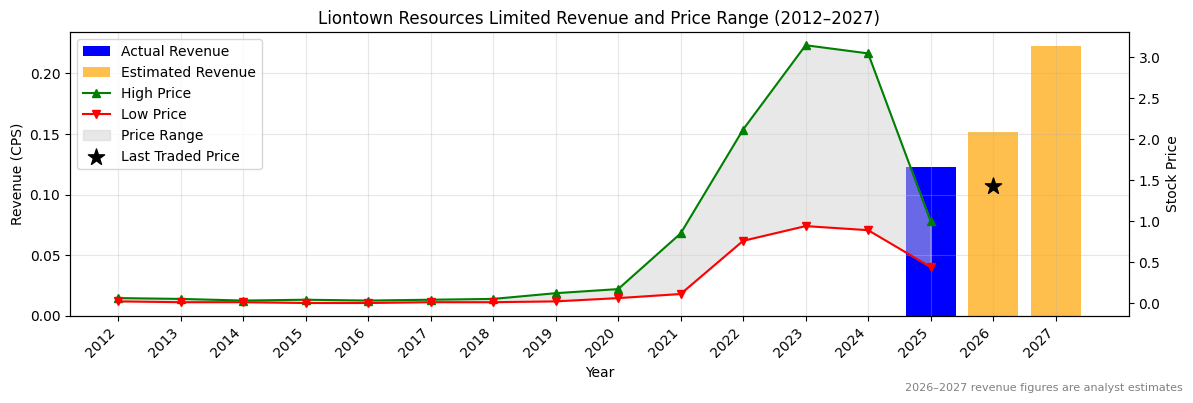
| Revenue 2024 Per Share |
Revenue 2025e Per Share |
Revenue 2026e Per Share |
Revenue 24 to 25e [%] |
Revenue 25e to 26e [%] |
EBITDA 2024 Per Share |
EBITDA 2025e Per Share |
EBITDA 2026e Per Share |
EBITDA 24 to 25e [%] |
EBITDA 25e to 26e [%] |
| None |
0.12271 |
0.15139 |
None |
23.4 |
-0.02437 |
0.0227 |
-0.00629 |
193.1 |
-127.7 |
LTR Revenue Per Share (2012–2027)
LTR Earnings before Interest, Tax, Depreciation and Amortisation (EBITDA) Per Share (2012–2027)
✅✅
LTR Normalised Earnings Per Share (EPS) (2012–2027)
❌
Valuation
| Price To Sales |
Price To Book |
PER 2023 |
PER 2024 |
13Y Median PER Low |
PER 2025e |
13Y Median PER High |
PER 2026e |
Last Updated |
| 11.6 |
4.9 |
-117.5 |
-39.2 |
None |
-39.2 |
None |
-39.2 |
11/10/25 |
LTR Yearly Price Earnings Ratio (PER) Highs and Lows
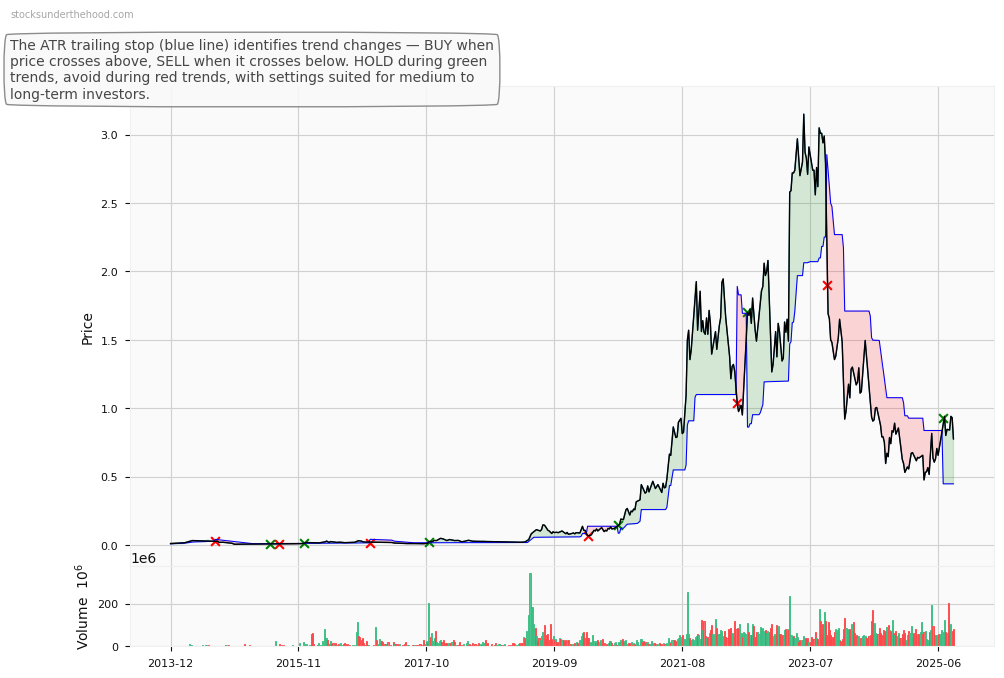
LTR Weekly Price Chart with Average True Range (ATR) Trailing Stop (10-Year View)
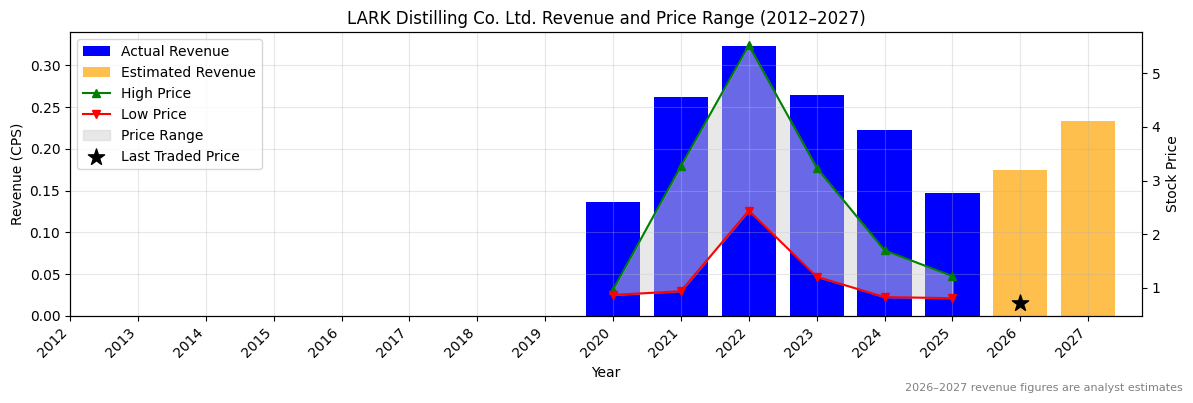
Ticker code: LRK
LRK Red Flags & Risk Indicators
⚠️
⚠️ RED FLAGS: 1 identified
Income Statement
| Revenue 2024 Per Share |
Revenue 2025e Per Share |
Revenue 2026e Per Share |
Revenue 24 to 25e [%] |
Revenue 25e to 26e [%] |
EBITDA 2024 Per Share |
EBITDA 2025e Per Share |
EBITDA 2026e Per Share |
EBITDA 24 to 25e [%] |
EBITDA 25e to 26e [%] |
| 0.22212 |
0.14659 |
0.17417 |
-34.0 |
18.8 |
-0.03664 |
-0.03954 |
-0.04099 |
-7.9 |
-3.7 |
LRK Revenue Per Share (2012–2027)
❌
LRK Earnings before Interest, Tax, Depreciation and Amortisation (EBITDA) Per Share (2012–2027)
❌
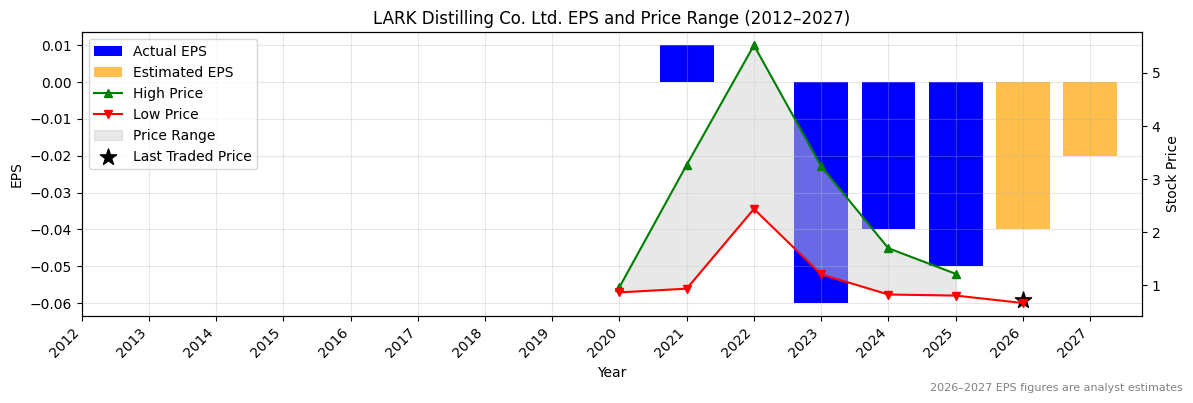
LRK Normalised Earnings Per Share (EPS) (2012–2027)
❌
Valuation
| Price To Sales |
Price To Book |
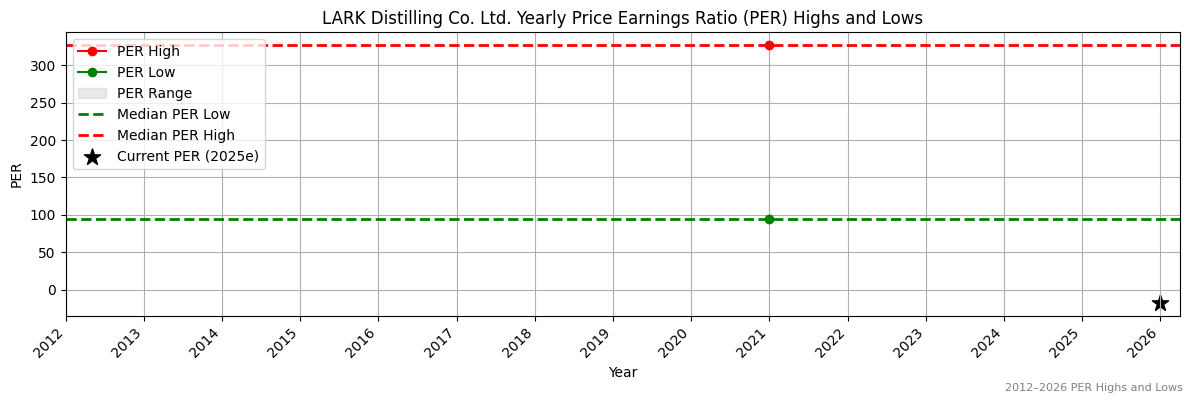
PER 2023 |
PER 2024 |
13Y Median PER Low |
PER 2025e |
13Y Median PER High |
PER 2026e |
Last Updated |
| 4.5 |
0.7 |
-12.1 |
-18.1 |
94.0 |
-14.5 |
327.0 |
-18.1 |
26/10/25 |
LRK Yearly Price Earnings Ratio (PER) Highs and Lows
✅✅
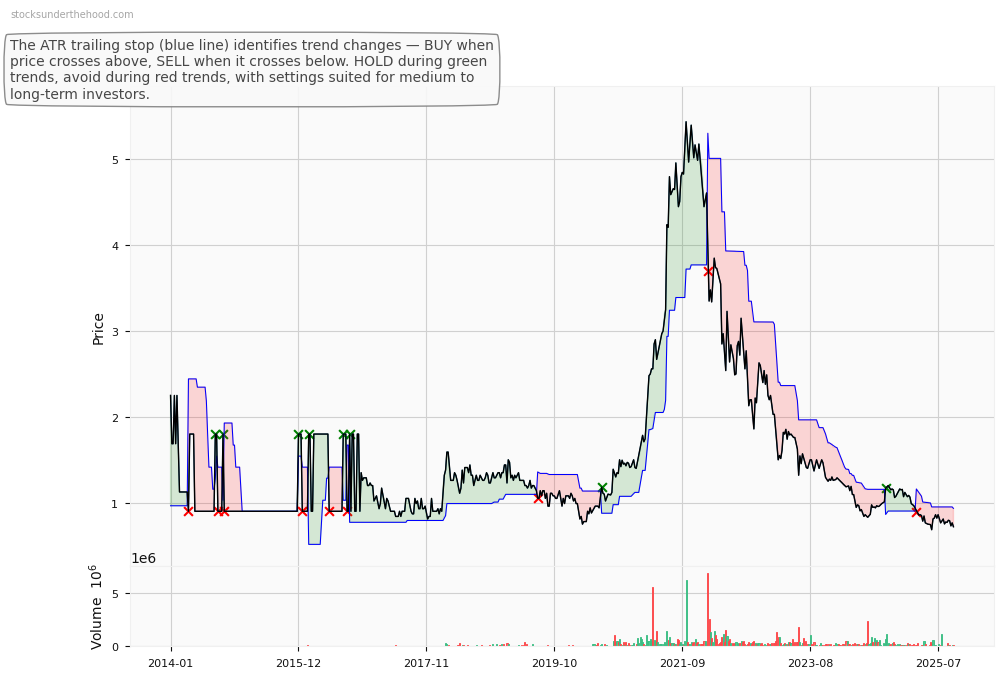
LRK Weekly Price Chart with Average True Range (ATR) Trailing Stop (10-Year View)
Ticker code: LOV
LOV Red Flags & Risk Indicators
❌
⚠️ RED FLAGS: 4 identified
- Increasing Shorts
- Falling Earnings
- More Net Debt Than Equity
- Falling EBITDA Margins
Income Statement
| Revenue 2024 Per Share |
Revenue 2025e Per Share |
Revenue 2026e Per Share |
Revenue 24 to 25e [%] |
Revenue 25e to 26e [%] |
EBITDA 2024 Per Share |
EBITDA 2025e Per Share |
EBITDA 2026e Per Share |
EBITDA 24 to 25e [%] |
EBITDA 25e to 26e [%] |
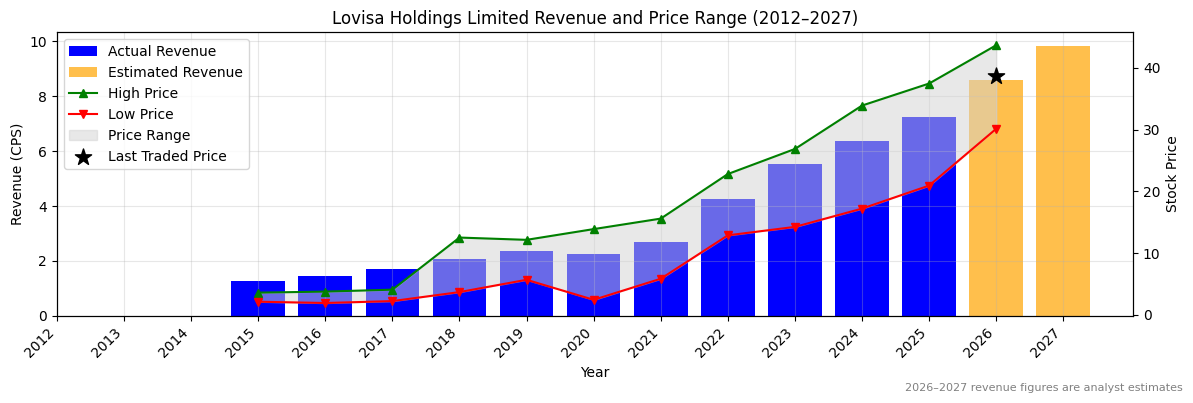
| 6.36925 |
7.2428 |
8.57814 |
13.7 |
18.4 |
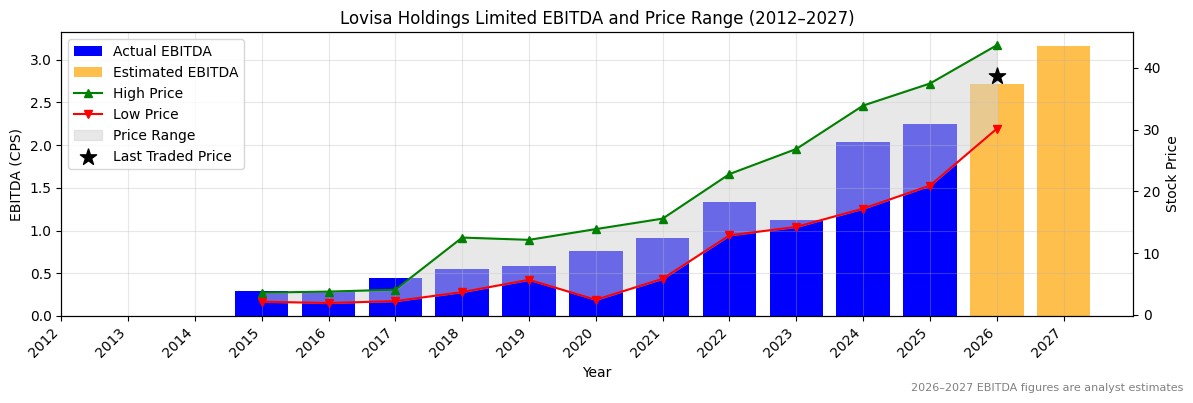
2.03769 |
2.24959 |
2.70972 |
10.4 |
20.5 |
LOV Revenue Per Share (2012–2027)
✅
LOV Earnings before Interest, Tax, Depreciation and Amortisation (EBITDA) Per Share (2012–2027)
✅
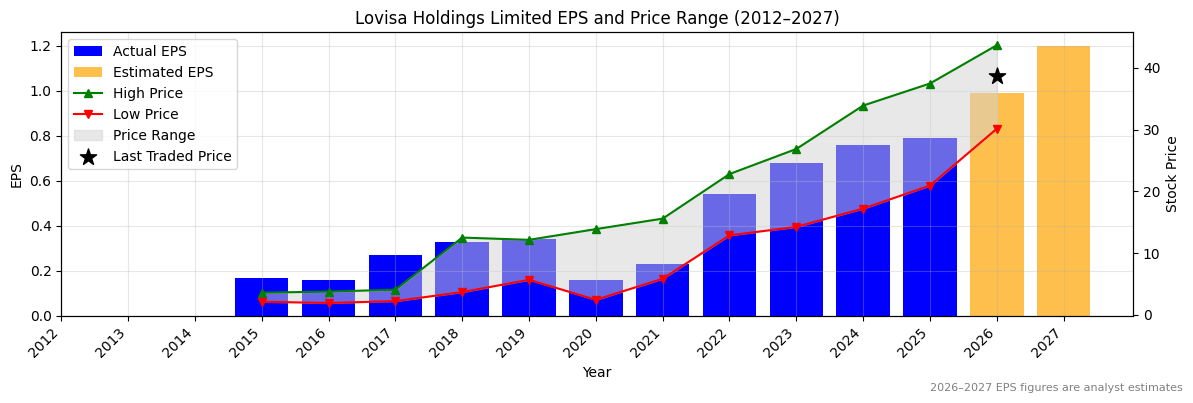
LOV Normalised Earnings Per Share (EPS) (2012–2027)
✅
Valuation
| Price To Sales |
Price To Book |
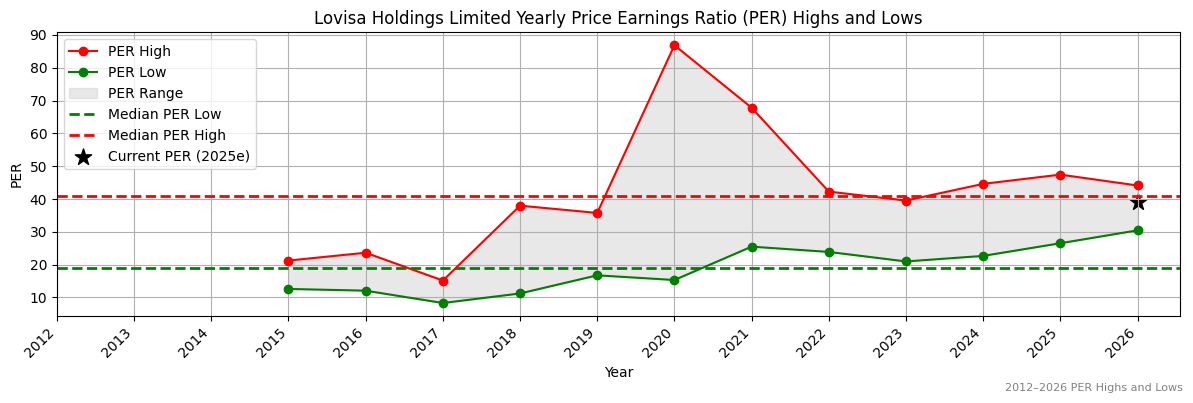
PER 2023 |
PER 2024 |
13Y Median PER Low |
PER 2025e |
13Y Median PER High |
PER 2026e |
Last Updated |
| 5.0 |
51.1 |
53.3 |
47.7 |
18.9 |
45.9 |
40.9 |
36.6 |
14/9/25 |
LOV Yearly Price Earnings Ratio (PER) Highs and Lows
❌
LOV Weekly Price Chart with Average True Range (ATR) Trailing Stop (10-Year View)
Ticker code: LNW
LNW Red Flags & Risk Indicators
⚠️
⚠️ RED FLAGS: 2 identified
- Falling Revenues
- More Net Debt Than Equity
Income Statement
| Revenue 2024 Per Share |
Revenue 2025e Per Share |
Revenue 2026e Per Share |
Revenue 24 to 25e [%] |
Revenue 25e to 26e [%] |
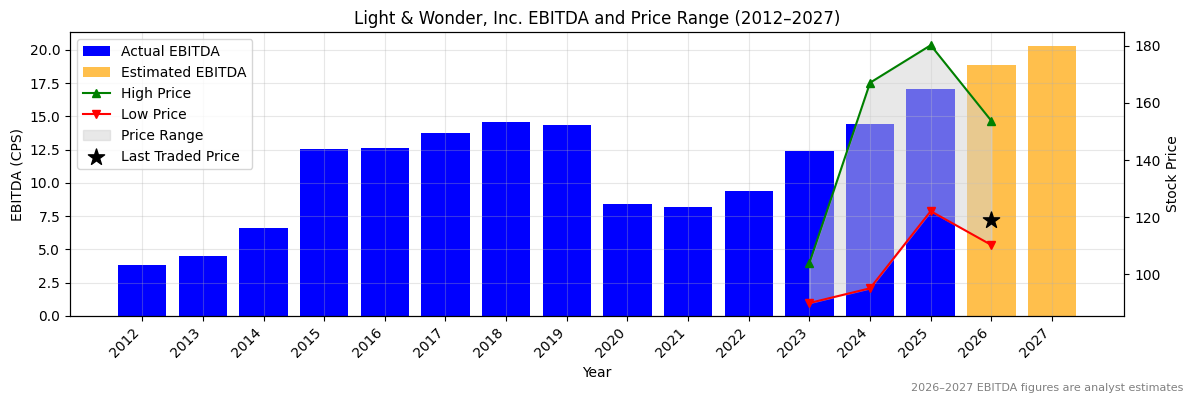
EBITDA 2024 Per Share |
EBITDA 2025e Per Share |
EBITDA 2026e Per Share |
EBITDA 24 to 25e [%] |
EBITDA 25e to 26e [%] |
| 37.06977 |
39.72353 |
43.50802 |
7.2 |
9.5 |
14.46512 |
17.07464 |
18.87379 |
18.0 |
10.5 |
LNW Revenue Per Share (2012–2027)
✅
LNW Earnings before Interest, Tax, Depreciation and Amortisation (EBITDA) Per Share (2012–2027)
✅
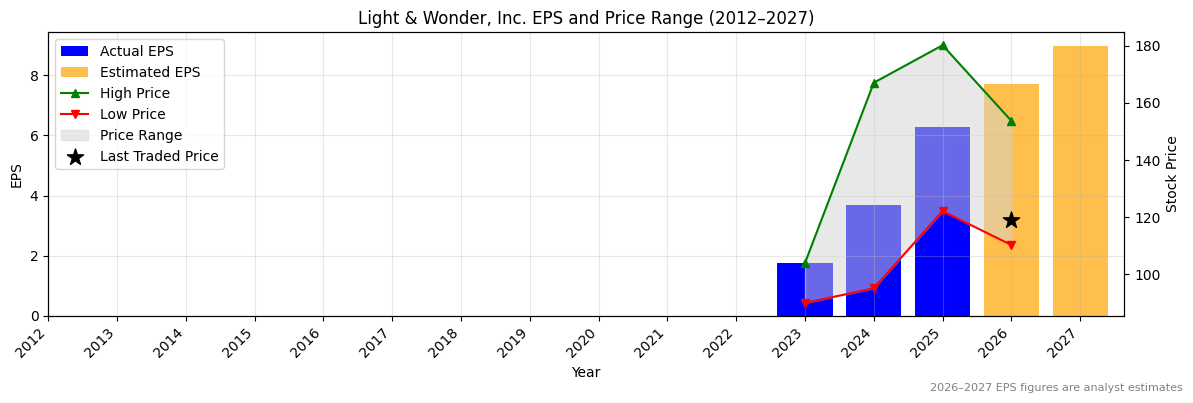
LNW Normalised Earnings Per Share (EPS) (2012–2027)
✅✅
Valuation
| Price To Sales |
Price To Book |
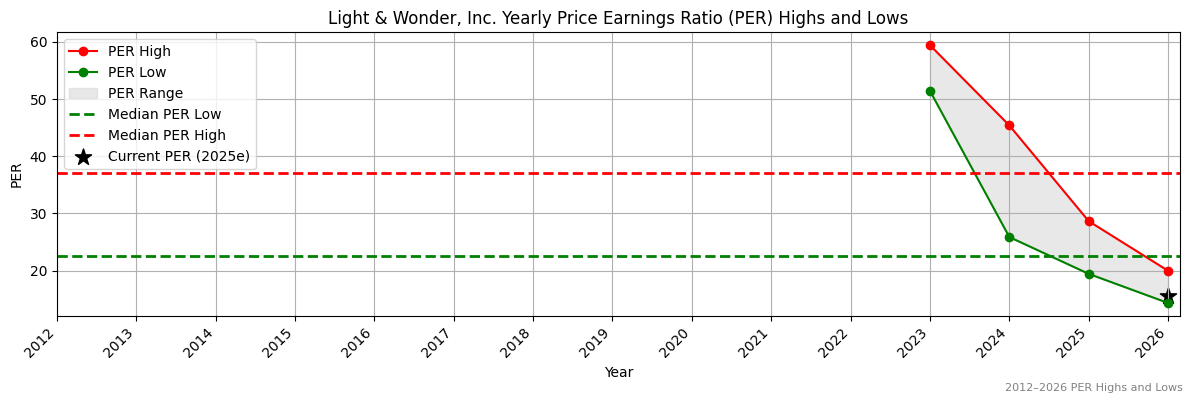
PER 2023 |
PER 2024 |
13Y Median PER Low |
PER 2025e |
13Y Median PER High |
PER 2026e |
Last Updated |
| 2.9 |
13.1 |
62.6 |
29.7 |
22.6 |
17.4 |
37.0 |
14.2 |
8/9/25 |
LNW Yearly Price Earnings Ratio (PER) Highs and Lows
✅✅
LNW Weekly Price Chart with Average True Range (ATR) Trailing Stop (10-Year View)
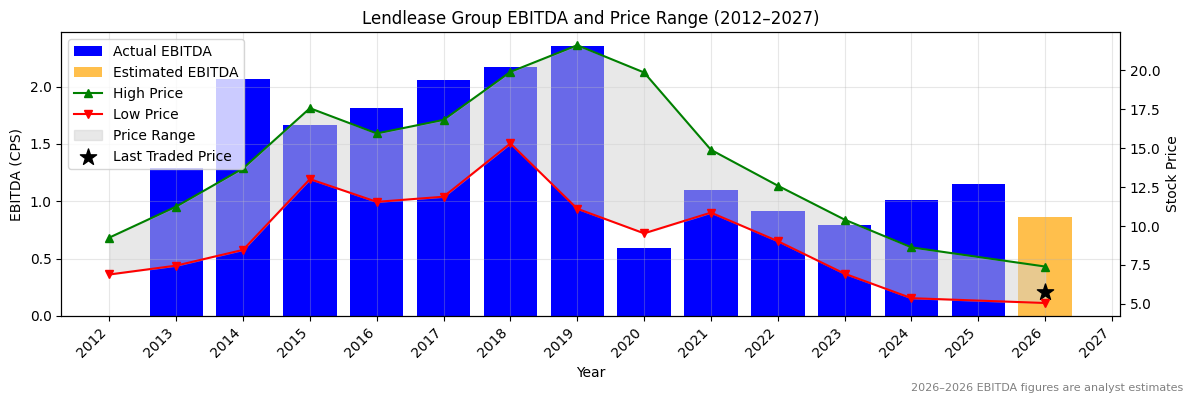
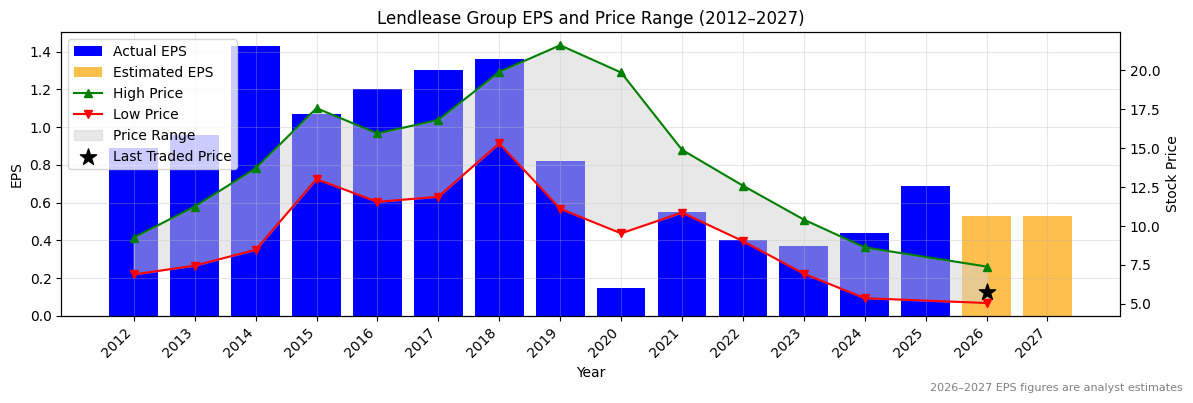
Ticker code: LLC
LLC Red Flags & Risk Indicators
❌
⚠️ RED FLAGS: 4 identified
- Negative Operating Cash Flow
- Increasing Shorts
- Falling Earnings
- Risk Of Capital Raise
Income Statement
| Revenue 2024 Per Share |
Revenue 2025e Per Share |
Revenue 2026e Per Share |
Revenue 24 to 25e [%] |
Revenue 25e to 26e [%] |
EBITDA 2024 Per Share |
EBITDA 2025e Per Share |
EBITDA 2026e Per Share |
EBITDA 24 to 25e [%] |
EBITDA 25e to 26e [%] |
| 15.98569 |
None |
None |
None |
None |
1.01404 |
1.15367 |
0.86037 |
13.8 |
-25.4 |
LLC Revenue Per Share (2012–2027)
LLC Earnings before Interest, Tax, Depreciation and Amortisation (EBITDA) Per Share (2012–2027)
✅
LLC Normalised Earnings Per Share (EPS) (2012–2027)
✅✅
Valuation
| Price To Sales |
Price To Book |
PER 2023 |
PER 2024 |
13Y Median PER Low |
PER 2025e |
13Y Median PER High |
PER 2026e |
Last Updated |
| 0.5 |
0.7 |
15.0 |
12.6 |
11.7 |
8.0 |
15.5 |
10.5 |
2/11/24 |
LLC Yearly Price Earnings Ratio (PER) Highs and Lows
✅✅
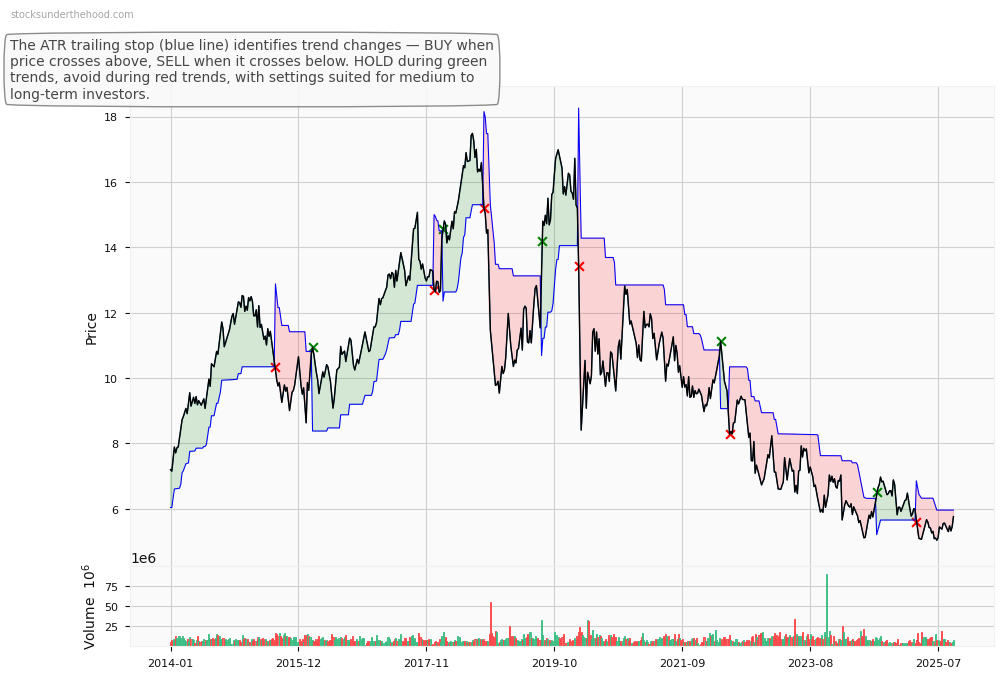
LLC Weekly Price Chart with Average True Range (ATR) Trailing Stop (10-Year View)
Ticker code: LIC
LIC Red Flags & Risk Indicators
❌
⚠️ RED FLAGS: 5 identified
- Negative Operating Cash Flow
- Highly Shorted
- Increasing Shorts
- Falling Earnings
- Risk Of Capital Raise
Income Statement
| Revenue 2024 Per Share |
Revenue 2025e Per Share |
Revenue 2026e Per Share |
Revenue 24 to 25e [%] |
Revenue 25e to 26e [%] |
EBITDA 2024 Per Share |
EBITDA 2025e Per Share |
EBITDA 2026e Per Share |
EBITDA 24 to 25e [%] |
EBITDA 25e to 26e [%] |
| 2.31992 |
None |
None |
None |
None |
0.76019 |
0.54239 |
0.50789 |
-28.7 |
-6.4 |
LIC Revenue Per Share (2012–2027)
LIC Earnings before Interest, Tax, Depreciation and Amortisation (EBITDA) Per Share (2012–2027)
❌
LIC Normalised Earnings Per Share (EPS) (2012–2027)
❌
Valuation
| Price To Sales |
Price To Book |
PER 2023 |
PER 2024 |
13Y Median PER Low |
PER 2025e |
13Y Median PER High |
PER 2026e |
Last Updated |
| 4.3 |
1.0 |
7.6 |
10.8 |
12.1 |
12.9 |
18.0 |
9.6 |
29/8/25 |
LIC Yearly Price Earnings Ratio (PER) Highs and Lows
✅
LIC Weekly Price Chart with Average True Range (ATR) Trailing Stop (10-Year View)
Ticker code: LGL
LGL Red Flags & Risk Indicators
⚠️
⚠️ RED FLAGS: 2 identified
- Falling Earnings
- High Price to Book vs ROE
Income Statement
| Revenue 2024 Per Share |
Revenue 2025e Per Share |
Revenue 2026e Per Share |
Revenue 24 to 25e [%] |
Revenue 25e to 26e [%] |
EBITDA 2024 Per Share |
EBITDA 2025e Per Share |
EBITDA 2026e Per Share |
EBITDA 24 to 25e [%] |
EBITDA 25e to 26e [%] |
| 3.52555 |
3.74283 |
3.88478 |
6.2 |
3.8 |
0.32449 |
0.35397 |
0.41715 |
9.1 |
17.8 |
LGL Revenue Per Share (2012–2027)
✅
LGL Earnings before Interest, Tax, Depreciation and Amortisation (EBITDA) Per Share (2012–2027)
✅
LGL Normalised Earnings Per Share (EPS) (2012–2027)
❌
Valuation
| Price To Sales |
Price To Book |
PER 2023 |
PER 2024 |
13Y Median PER Low |
PER 2025e |
13Y Median PER High |
PER 2026e |
Last Updated |
| 0.6 |
1.4 |
None |
None |
12.9 |
None |
19.9 |
None |
4/10/25 |
LGL Yearly Price Earnings Ratio (PER) Highs and Lows
LGL Weekly Price Chart with Average True Range (ATR) Trailing Stop (10-Year View)
Ticker code: LBL
LBL Red Flags & Risk Indicators
⚠️
⚠️ RED FLAGS: 2 identified
- Low Operating Margin
- Falling Earnings
Income Statement
| Revenue 2024 Per Share |
Revenue 2025e Per Share |
Revenue 2026e Per Share |
Revenue 24 to 25e [%] |
Revenue 25e to 26e [%] |
EBITDA 2024 Per Share |
EBITDA 2025e Per Share |
EBITDA 2026e Per Share |
EBITDA 24 to 25e [%] |
EBITDA 25e to 26e [%] |
| 0.38167 |
None |
None |
None |
None |
0.10455 |
0.15554 |
None |
48.8 |
None |
LBL Revenue Per Share (2012–2027)
LBL Earnings before Interest, Tax, Depreciation and Amortisation (EBITDA) Per Share (2012–2027)
✅✅
LBL Normalised Earnings Per Share (EPS) (2012–2027)
✅✅
Valuation
| Price To Sales |
Price To Book |
PER 2023 |
PER 2024 |
13Y Median PER Low |
PER 2025e |
13Y Median PER High |
PER 2026e |
Last Updated |
| 1.4 |
1.5 |
13.2 |
None |
12.5 |
17.7 |
24.9 |
10.6 |
25/7/25 |
LBL Yearly Price Earnings Ratio (PER) Highs and Lows
✅
LBL Weekly Price Chart with Average True Range (ATR) Trailing Stop (10-Year View)
Ticker code: LAU
LAU Red Flags & Risk Indicators
⚠️
⚠️ RED FLAGS: 2 identified
- Falling Earnings
- More Net Debt Than Equity
Income Statement
| Revenue 2024 Per Share |
Revenue 2025e Per Share |
Revenue 2026e Per Share |
Revenue 24 to 25e [%] |
Revenue 25e to 26e [%] |
EBITDA 2024 Per Share |
EBITDA 2025e Per Share |
EBITDA 2026e Per Share |
EBITDA 24 to 25e [%] |
EBITDA 25e to 26e [%] |
| 2.77376 |
None |
None |
None |
None |
0.3385 |
0.30836 |
None |
-8.9 |
None |
LAU Revenue Per Share (2012–2027)
LAU Earnings before Interest, Tax, Depreciation and Amortisation (EBITDA) Per Share (2012–2027)
❌
LAU Normalised Earnings Per Share (EPS) (2012–2027)
❌
Valuation
| Price To Sales |
Price To Book |
PER 2023 |
PER 2024 |
13Y Median PER Low |
PER 2025e |
13Y Median PER High |
PER 2026e |
Last Updated |
| 0.3 |
1.2 |
5.0 |
6.1 |
10.0 |
8.6 |
13.0 |
6.7 |
22/8/24 |
LAU Yearly Price Earnings Ratio (PER) Highs and Lows
✅✅
LAU Weekly Price Chart with Average True Range (ATR) Trailing Stop (10-Year View)
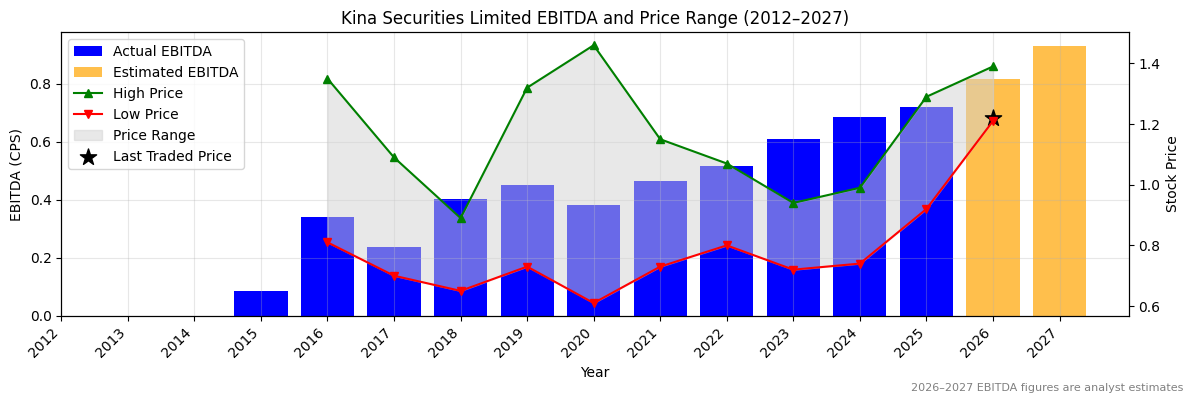
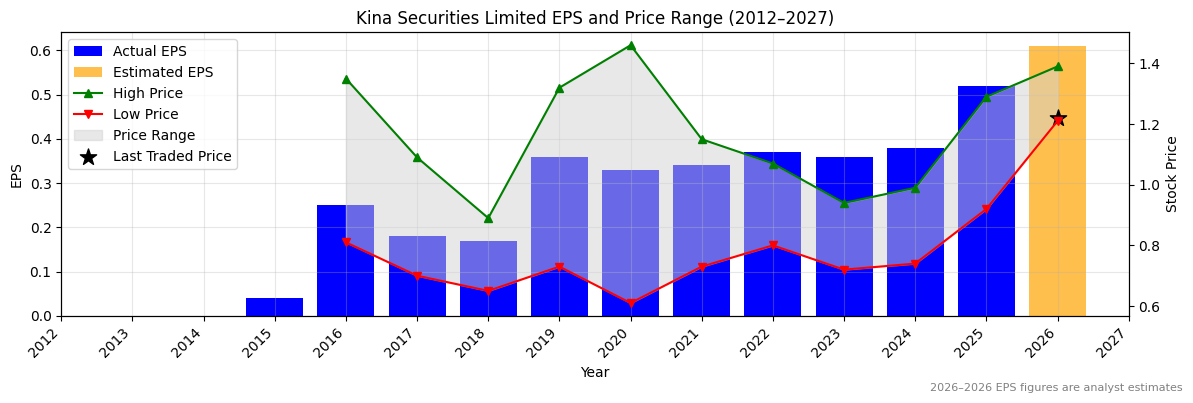
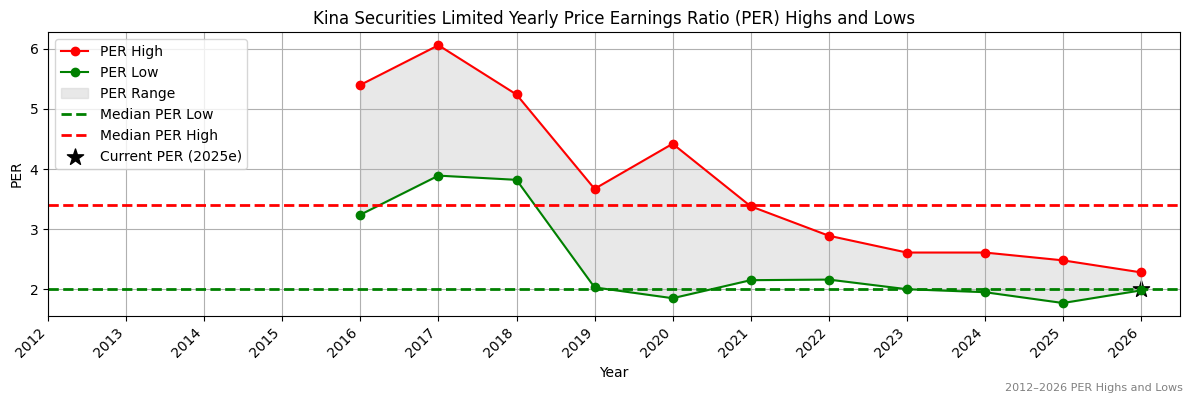
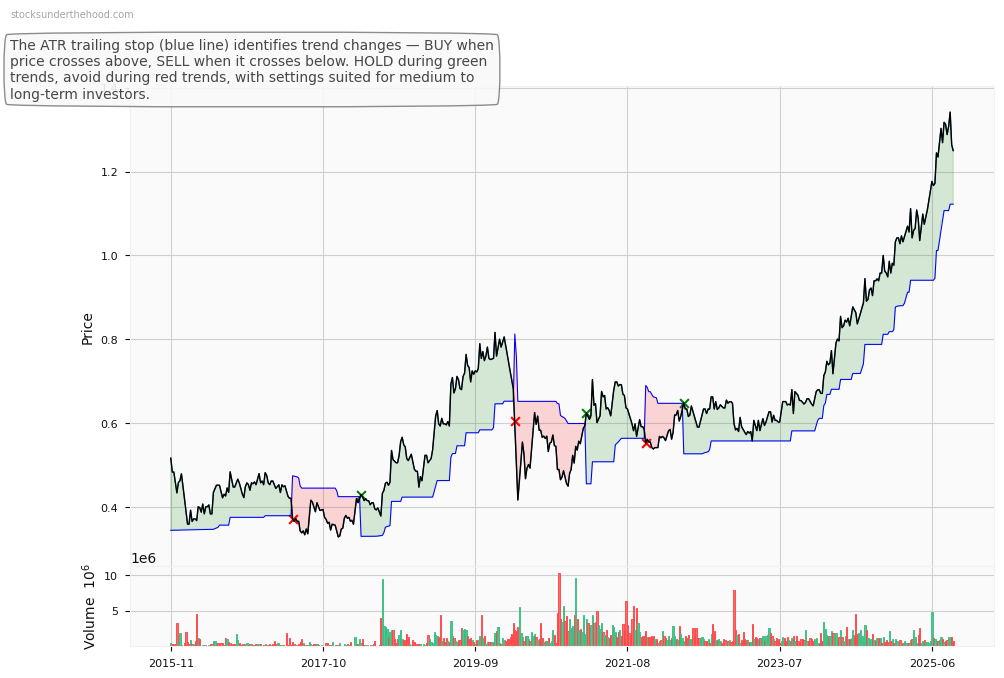
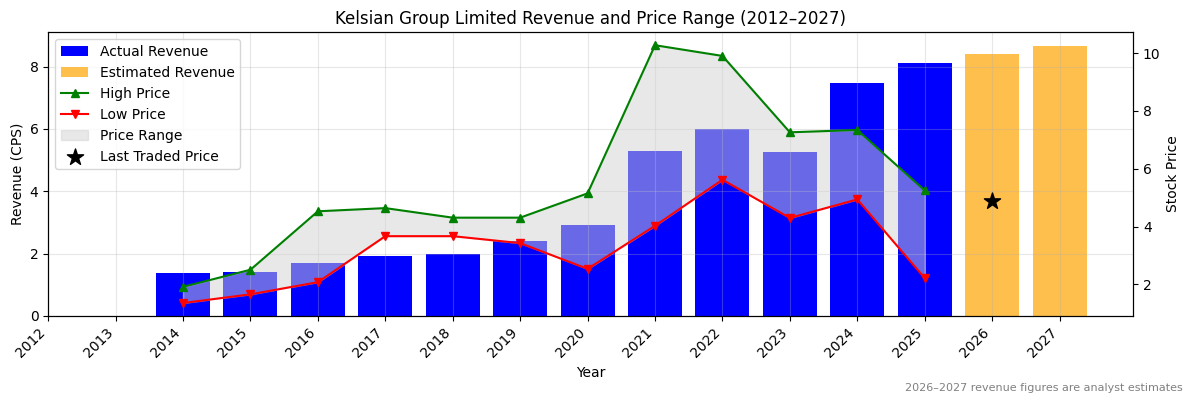
Ticker code: KSL
KSL Red Flags & Risk Indicators
⚠️
⚠️ RED FLAGS: 2 identified
- Low Operating Margin
- Falling EBITDA Margins
Income Statement
| Revenue 2024 Per Share |
Revenue 2025e Per Share |
Revenue 2026e Per Share |
Revenue 24 to 25e [%] |
Revenue 25e to 26e [%] |
EBITDA 2024 Per Share |
EBITDA 2025e Per Share |
EBITDA 2026e Per Share |
EBITDA 24 to 25e [%] |
EBITDA 25e to 26e [%] |
| 1.69752 |
1.82264 |
2.03958 |
7.4 |
11.9 |
0.68435 |
0.72013 |
0.81645 |
5.2 |
13.4 |
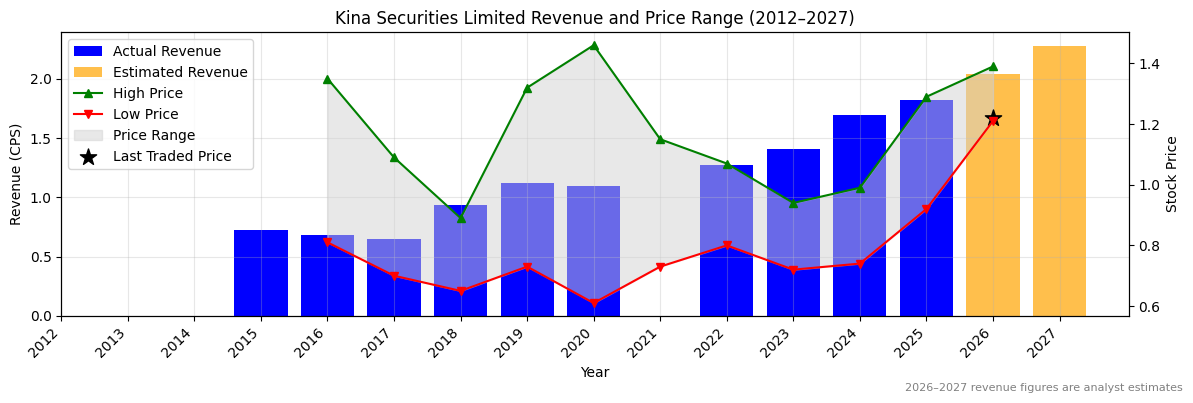
KSL Revenue Per Share (2012–2027)
✅
KSL Earnings before Interest, Tax, Depreciation and Amortisation (EBITDA) Per Share (2012–2027)
✅
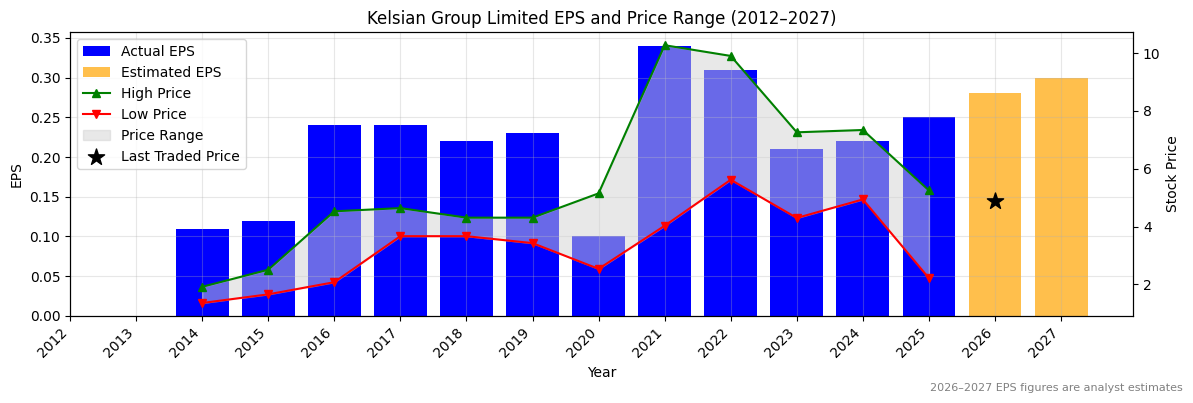
KSL Normalised Earnings Per Share (EPS) (2012–2027)
✅✅
Valuation
| Price To Sales |
Price To Book |
PER 2023 |
PER 2024 |
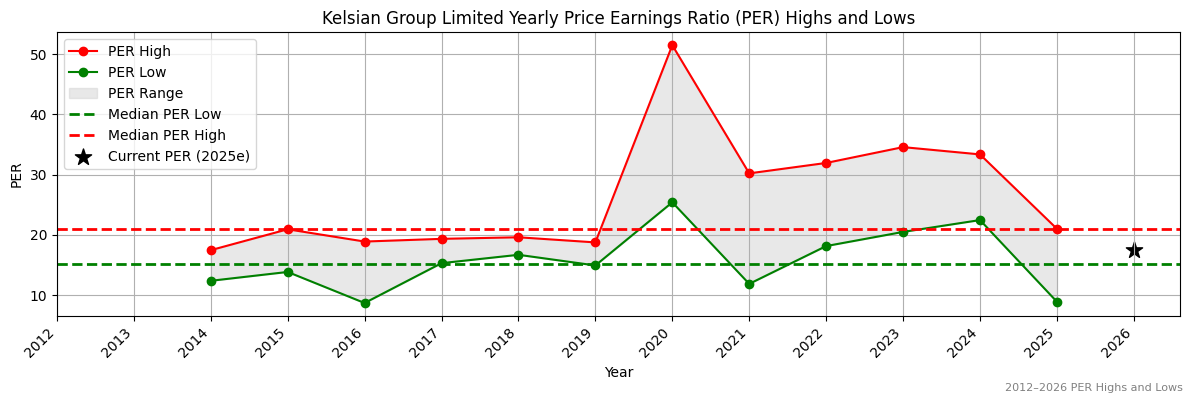
13Y Median PER Low |
PER 2025e |
13Y Median PER High |
PER 2026e |
Last Updated |
| 0.7 |
0.5 |
3.4 |
3.3 |
2.0 |
2.4 |
3.4 |
2.0 |
20/10/25 |
KSL Yearly Price Earnings Ratio (PER) Highs and Lows
✅
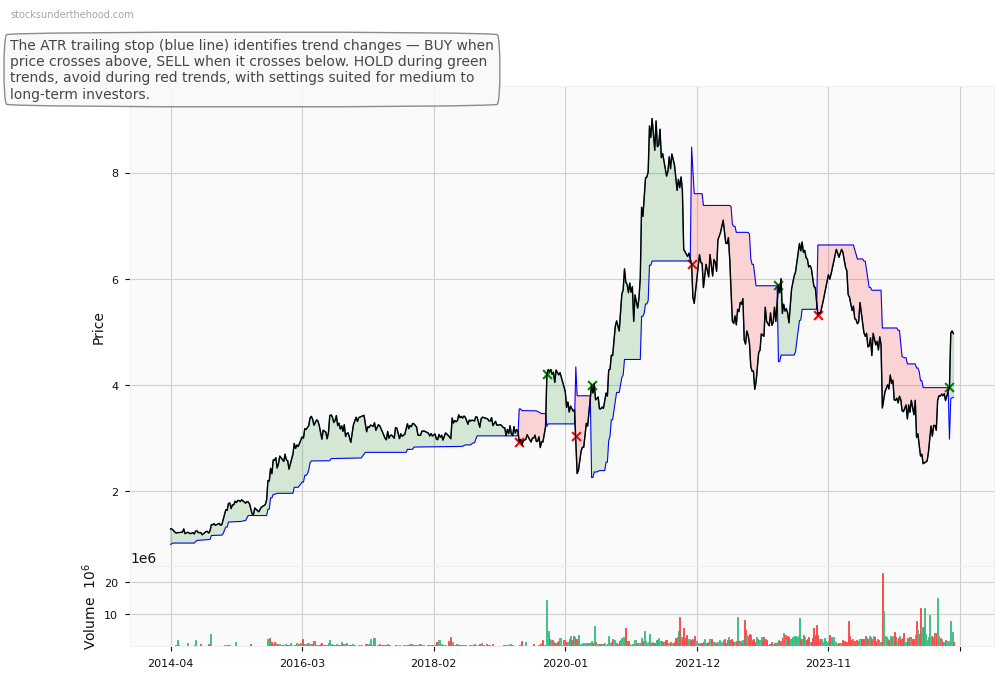
KSL Weekly Price Chart with Average True Range (ATR) Trailing Stop (10-Year View)
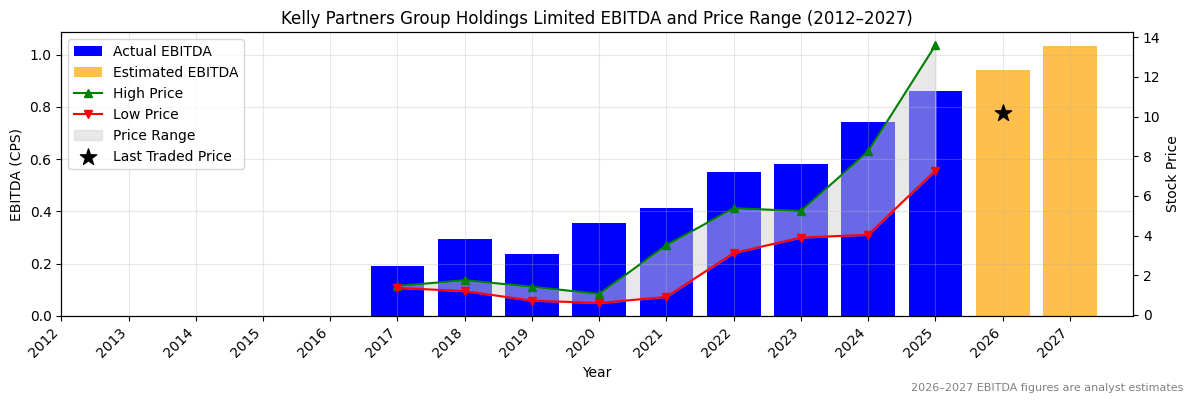
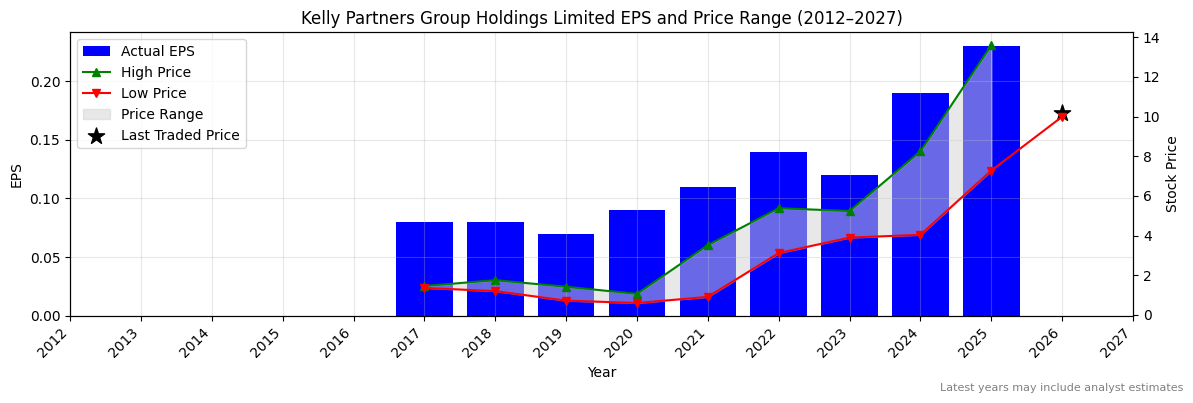
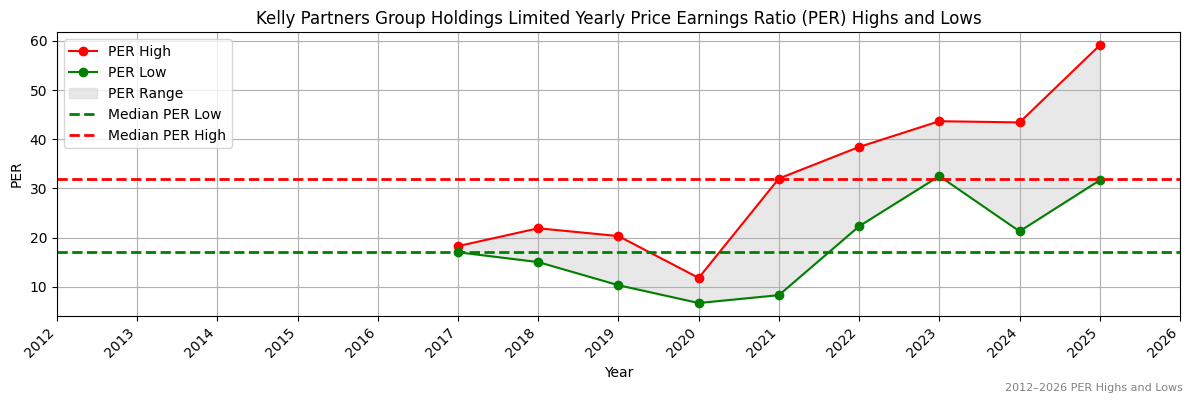
Ticker code: KPG
KPG Red Flags & Risk Indicators
⚠️
⚠️ RED FLAGS: 2 identified
- More Net Debt Than Equity
- High Relative Valuation
Income Statement
| Revenue 2024 Per Share |
Revenue 2025e Per Share |
Revenue 2026e Per Share |
Revenue 24 to 25e [%] |
Revenue 25e to 26e [%] |
EBITDA 2024 Per Share |
EBITDA 2025e Per Share |
EBITDA 2026e Per Share |
EBITDA 24 to 25e [%] |
EBITDA 25e to 26e [%] |
| 2.24889 |
2.56444 |
None |
14.0 |
None |
0.74222 |
0.86 |
0.93981 |
15.9 |
9.3 |
KPG Revenue Per Share (2012–2027)
✅
KPG Earnings before Interest, Tax, Depreciation and Amortisation (EBITDA) Per Share (2012–2027)
✅
KPG Normalised Earnings Per Share (EPS) (2012–2027)
✅✅
Valuation
| Price To Sales |
Price To Book |
PER 2023 |
PER 2024 |
13Y Median PER Low |
PER 2025e |
13Y Median PER High |
PER 2026e |
Last Updated |
| 3.2 |
15.2 |
79.6 |
50.3 |
17.0 |
41.5 |
32.0 |
None |
20/8/25 |
KPG Yearly Price Earnings Ratio (PER) Highs and Lows
❌
KPG Weekly Price Chart with Average True Range (ATR) Trailing Stop (10-Year View)
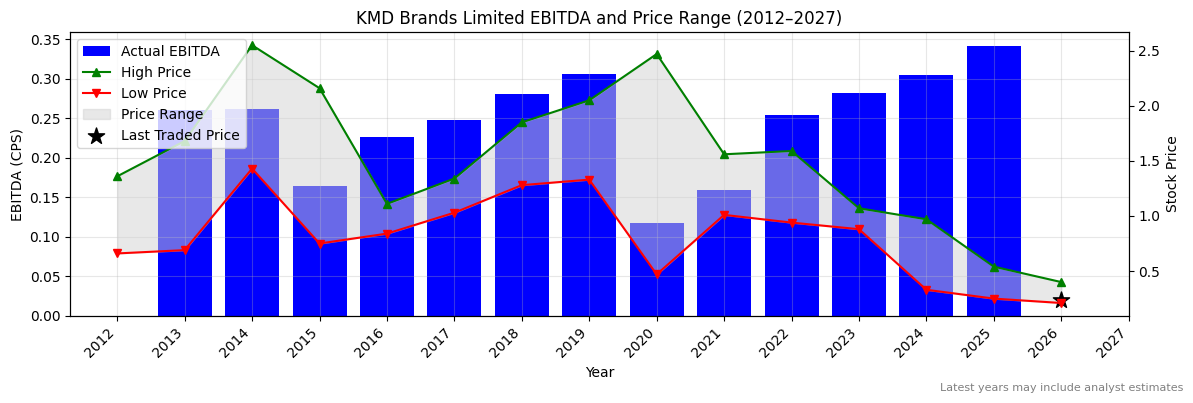
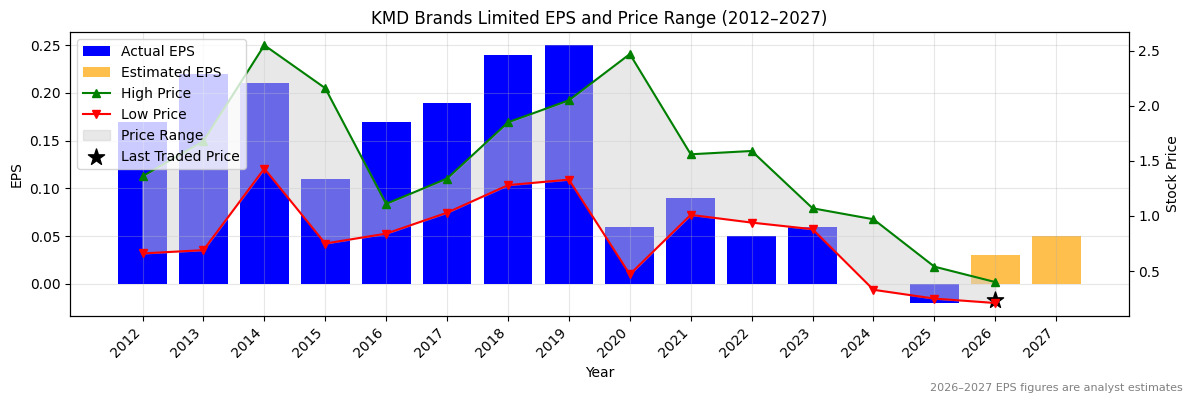
Ticker code: KMD
KMD Red Flags & Risk Indicators
⚠️
⚠️ RED FLAGS: 1 identified
Income Statement
| Revenue 2024 Per Share |
Revenue 2025e Per Share |
Revenue 2026e Per Share |
Revenue 24 to 25e [%] |
Revenue 25e to 26e [%] |
EBITDA 2024 Per Share |
EBITDA 2025e Per Share |
EBITDA 2026e Per Share |
EBITDA 24 to 25e [%] |
EBITDA 25e to 26e [%] |
| 1.57256 |
None |
None |
None |
None |
0.30459 |
0.34155 |
None |
12.1 |
None |
KMD Revenue Per Share (2012–2027)
KMD Earnings before Interest, Tax, Depreciation and Amortisation (EBITDA) Per Share (2012–2027)
✅
KMD Normalised Earnings Per Share (EPS) (2012–2027)
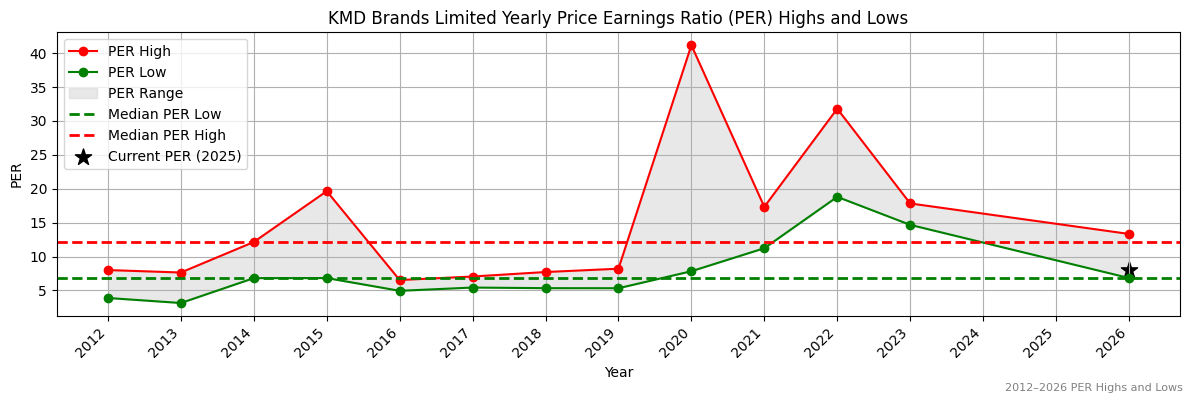
Valuation
| Price To Sales |
Price To Book |
PER 2023 |
PER 2024 |
13Y Median PER Low |
PER 2025e |
13Y Median PER High |
PER 2026e |
Last Updated |
| 0.2 |
0.3 |
4.2 |
None |
6.8 |
-12.5 |
12.1 |
8.3 |
20/10/24 |
KMD Yearly Price Earnings Ratio (PER) Highs and Lows
✅✅
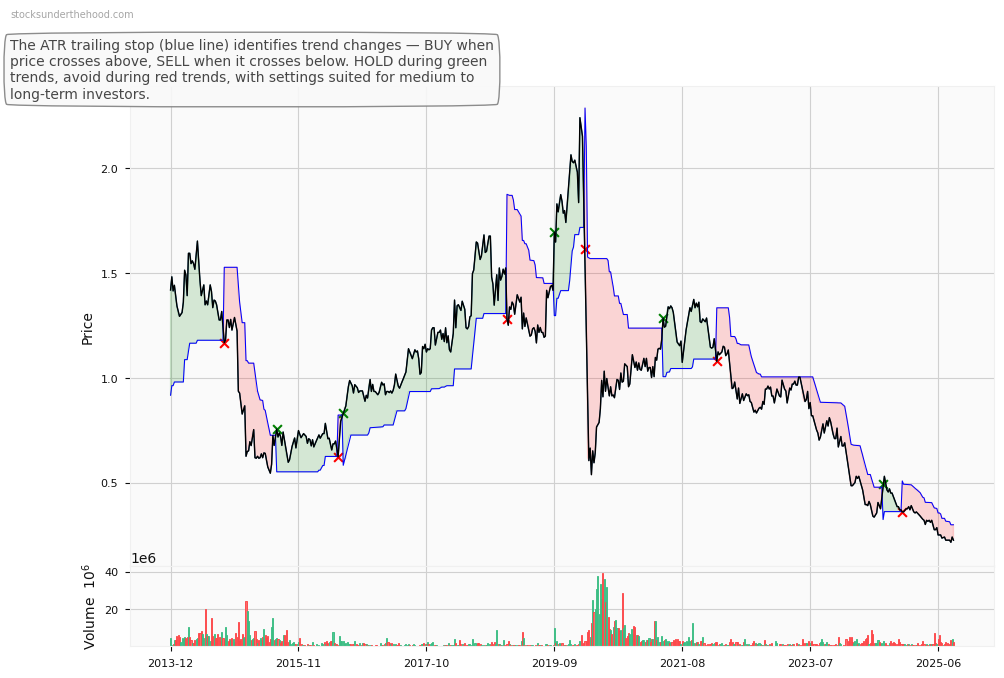
KMD Weekly Price Chart with Average True Range (ATR) Trailing Stop (10-Year View)
Ticker code: KLS
KLS Red Flags & Risk Indicators
❌
⚠️ RED FLAGS: 3 identified
- Increasing Shorts
- Falling Earnings
- Falling Revenues
Income Statement
| Revenue 2024 Per Share |
Revenue 2025e Per Share |
Revenue 2026e Per Share |
Revenue 24 to 25e [%] |
Revenue 25e to 26e [%] |
EBITDA 2024 Per Share |
EBITDA 2025e Per Share |
EBITDA 2026e Per Share |
EBITDA 24 to 25e [%] |
EBITDA 25e to 26e [%] |
| 7.47517 |
8.12984 |
8.40966 |
8.8 |
3.4 |
0.98369 |
1.03801 |
1.11143 |
5.5 |
7.1 |
KLS Revenue Per Share (2012–2027)
✅
KLS Earnings before Interest, Tax, Depreciation and Amortisation (EBITDA) Per Share (2012–2027)
✅
KLS Normalised Earnings Per Share (EPS) (2012–2027)
✅
Valuation
| Price To Sales |
Price To Book |
PER 2023 |
PER 2024 |
13Y Median PER Low |
PER 2025e |
13Y Median PER High |
PER 2026e |
Last Updated |
| 0.6 |
1.4 |
23.2 |
22.1 |
15.1 |
19.5 |
21.0 |
17.4 |
2/8/25 |
KLS Yearly Price Earnings Ratio (PER) Highs and Lows
✅
KLS Weekly Price Chart with Average True Range (ATR) Trailing Stop (10-Year View)
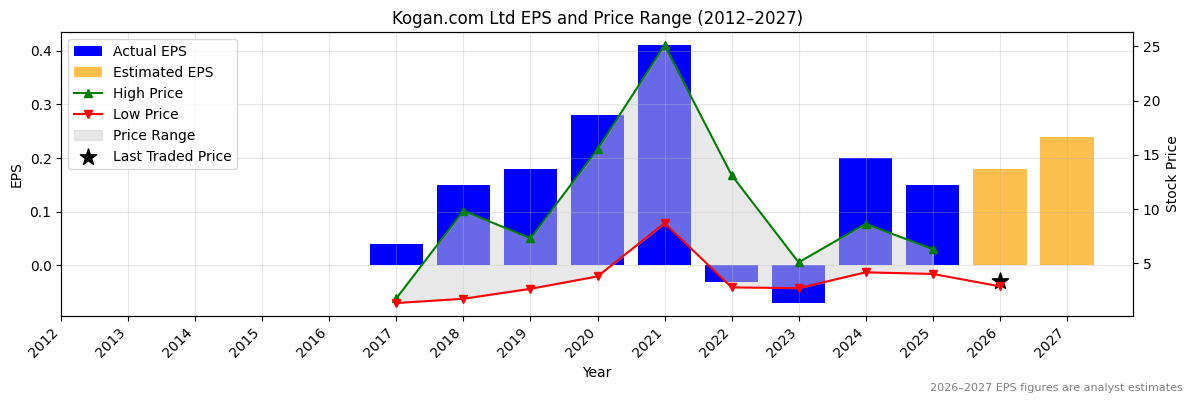
Ticker code: KGN
KGN Red Flags & Risk Indicators
❌
⚠️ RED FLAGS: 4 identified
- Low Operating Margin
- Increasing Shorts
- Falling Earnings
- Falling EBITDA Margins
Income Statement
| Revenue 2024 Per Share |
Revenue 2025e Per Share |
Revenue 2026e Per Share |
Revenue 24 to 25e [%] |
Revenue 25e to 26e [%] |
EBITDA 2024 Per Share |
EBITDA 2025e Per Share |
EBITDA 2026e Per Share |
EBITDA 24 to 25e [%] |
EBITDA 25e to 26e [%] |
| 4.55952 |
4.89951 |
5.2678 |
7.5 |
7.5 |
0.39703 |
0.37054 |
0.41577 |
-6.7 |
12.2 |
KGN Revenue Per Share (2012–2027)
✅
KGN Earnings before Interest, Tax, Depreciation and Amortisation (EBITDA) Per Share (2012–2027)
❌
KGN Normalised Earnings Per Share (EPS) (2012–2027)
❌
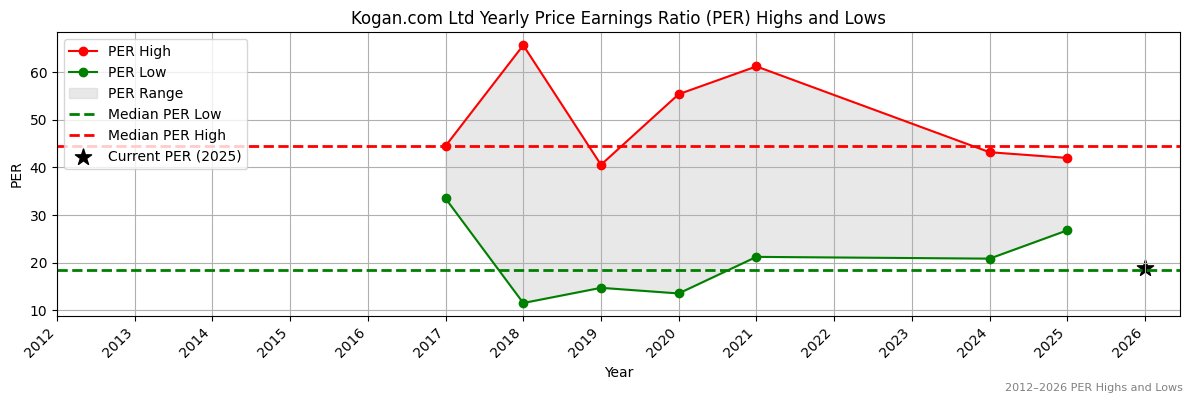
Valuation
| Price To Sales |
Price To Book |
PER 2023 |
PER 2024 |
13Y Median PER Low |
PER 2025e |
13Y Median PER High |
PER 2026e |
Last Updated |
| 0.7 |
5.3 |
-45.7 |
16.0 |
19.2 |
21.3 |
44.5 |
17.8 |
26/10/25 |
KGN Yearly Price Earnings Ratio (PER) Highs and Lows
✅
KGN Weekly Price Chart with Average True Range (ATR) Trailing Stop (10-Year View)
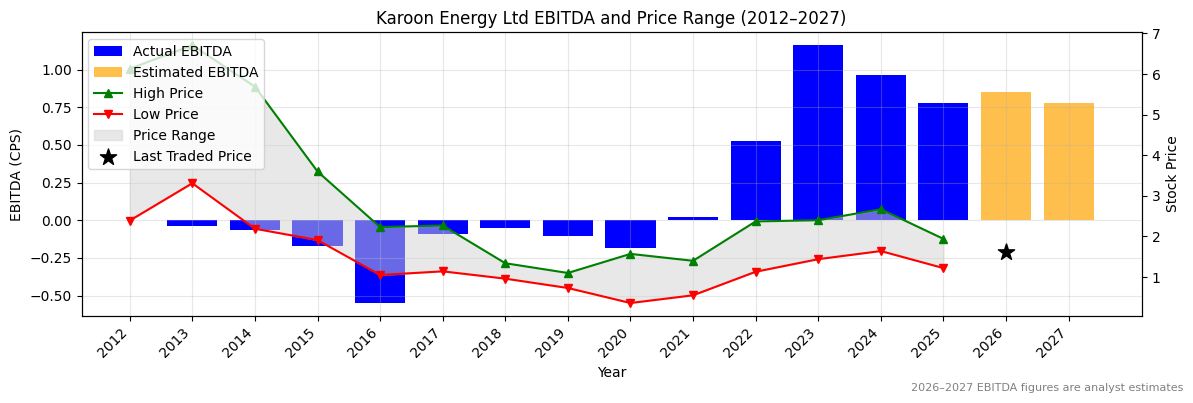
Ticker code: KAR
KAR Red Flags & Risk Indicators
❌
⚠️ RED FLAGS: 3 identified
- Highly Shorted
- Falling Earnings
- Falling EBITDA Margins
Income Statement
| Revenue 2024 Per Share |
Revenue 2025e Per Share |
Revenue 2026e Per Share |
Revenue 24 to 25e [%] |
Revenue 25e to 26e [%] |
EBITDA 2024 Per Share |
EBITDA 2025e Per Share |
EBITDA 2026e Per Share |
EBITDA 24 to 25e [%] |
EBITDA 25e to 26e [%] |
| 1.53315 |
1.33782 |
1.29323 |
-12.7 |
-3.3 |
0.96273 |
0.77669 |
0.84921 |
-19.3 |
9.3 |
KAR Revenue Per Share (2012–2027)
❌
KAR Earnings before Interest, Tax, Depreciation and Amortisation (EBITDA) Per Share (2012–2027)
❌
KAR Normalised Earnings Per Share (EPS) (2012–2027)
❌
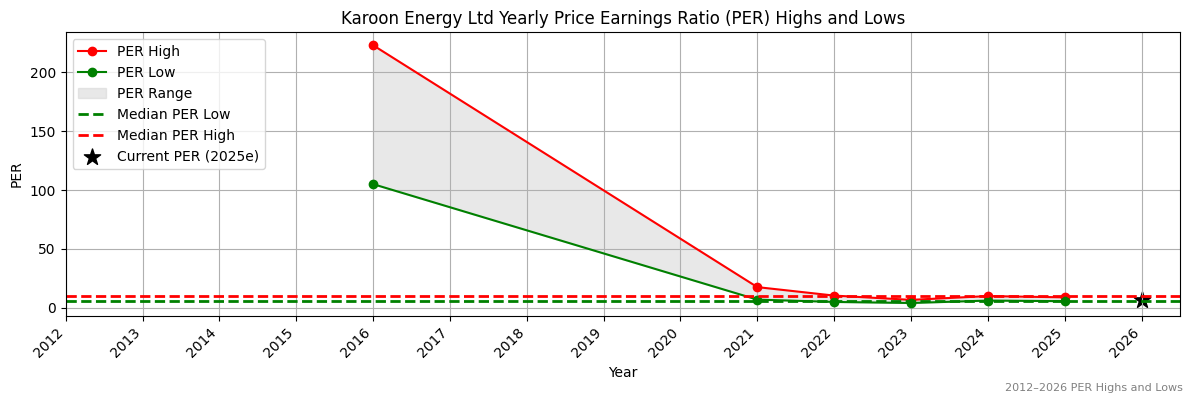
Valuation
| Price To Sales |
Price To Book |
PER 2023 |
PER 2024 |
13Y Median PER Low |
PER 2025e |
13Y Median PER High |
PER 2026e |
Last Updated |
| 1.7 |
1.2 |
4.5 |
5.9 |
5.8 |
7.3 |
10.1 |
6.4 |
13/6/25 |
KAR Yearly Price Earnings Ratio (PER) Highs and Lows
✅
KAR Weekly Price Chart with Average True Range (ATR) Trailing Stop (10-Year View)
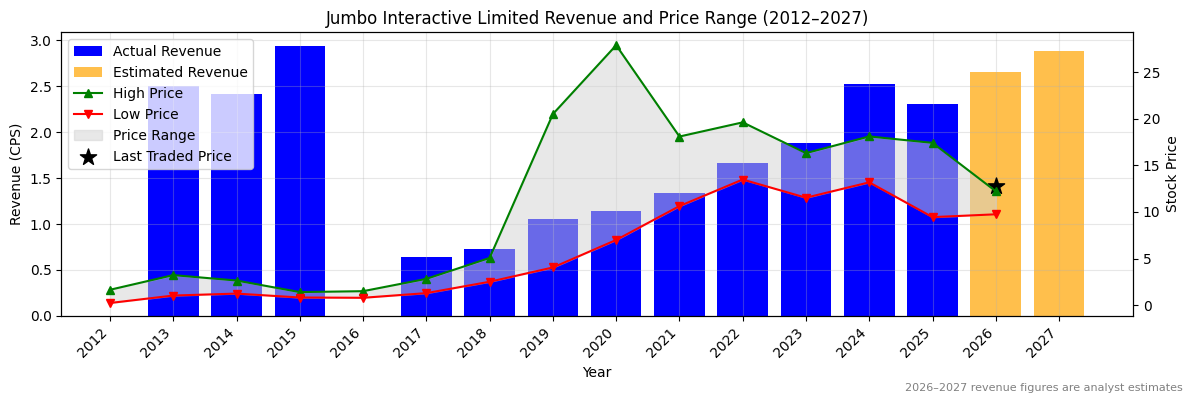
Ticker code: JIN
JIN Red Flags & Risk Indicators
❌
⚠️ RED FLAGS: 4 identified
- Increasing Shorts
- Falling Earnings
- Falling Revenues
- Falling EBITDA Margins
Income Statement
| Revenue 2024 Per Share |
Revenue 2025e Per Share |
Revenue 2026e Per Share |
Revenue 24 to 25e [%] |
Revenue 25e to 26e [%] |
EBITDA 2024 Per Share |
EBITDA 2025e Per Share |
EBITDA 2026e Per Share |
EBITDA 24 to 25e [%] |
EBITDA 25e to 26e [%] |
| 2.53032 |
2.30735 |
2.66146 |
-8.8 |
15.3 |
1.21585 |
1.09423 |
1.19343 |
-10.0 |
9.1 |
JIN Revenue Per Share (2012–2027)
❌
JIN Earnings before Interest, Tax, Depreciation and Amortisation (EBITDA) Per Share (2012–2027)
❌
JIN Normalised Earnings Per Share (EPS) (2012–2027)
❌
Valuation
| Price To Sales |
Price To Book |
PER 2023 |
PER 2024 |
13Y Median PER Low |
PER 2025e |
13Y Median PER High |
PER 2026e |
Last Updated |
| 5.1 |
6.0 |
22.2 |
16.8 |
14.9 |
18.3 |
30.8 |
16.3 |
5/9/25 |
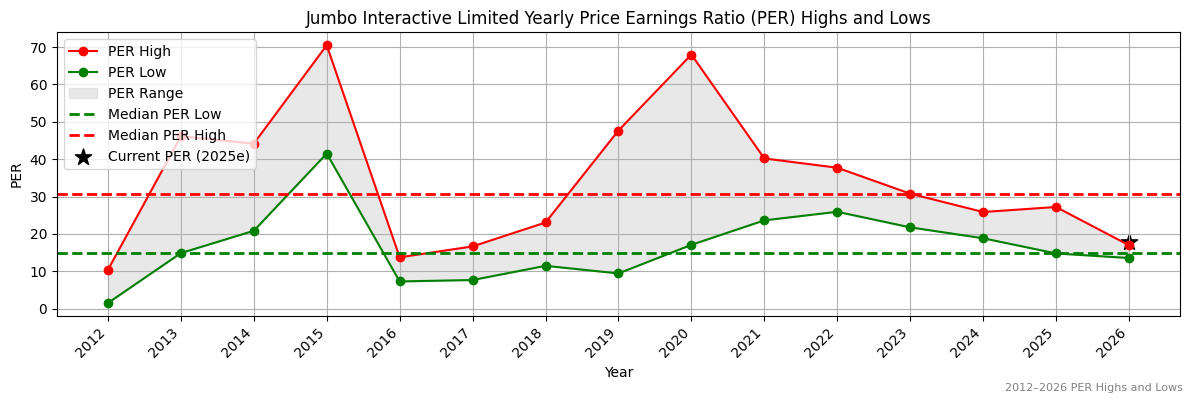
JIN Yearly Price Earnings Ratio (PER) Highs and Lows
✅
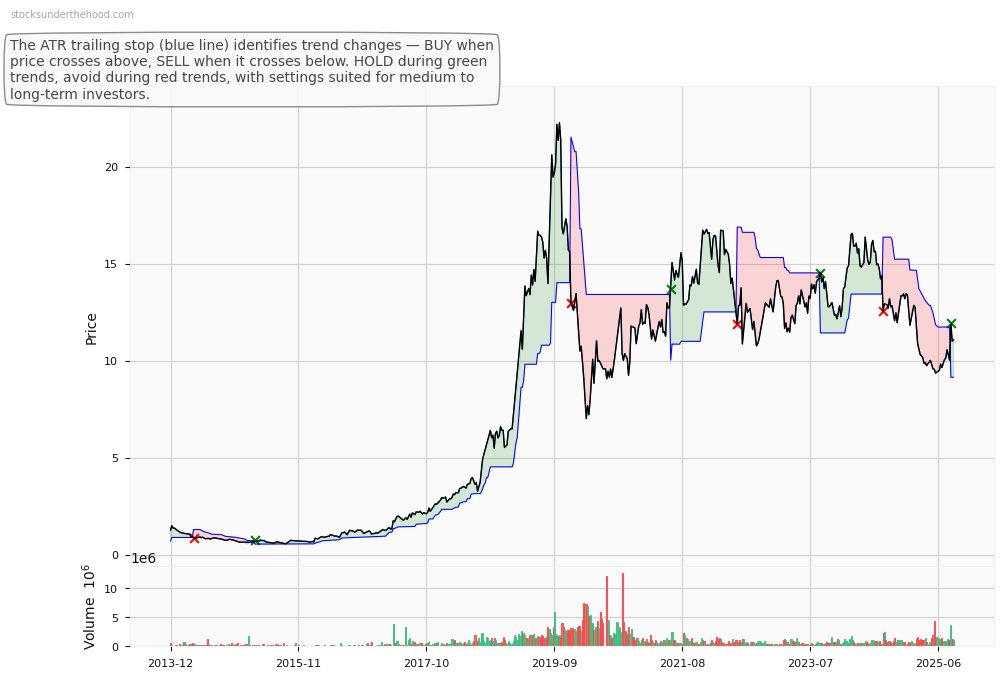
JIN Weekly Price Chart with Average True Range (ATR) Trailing Stop (10-Year View)
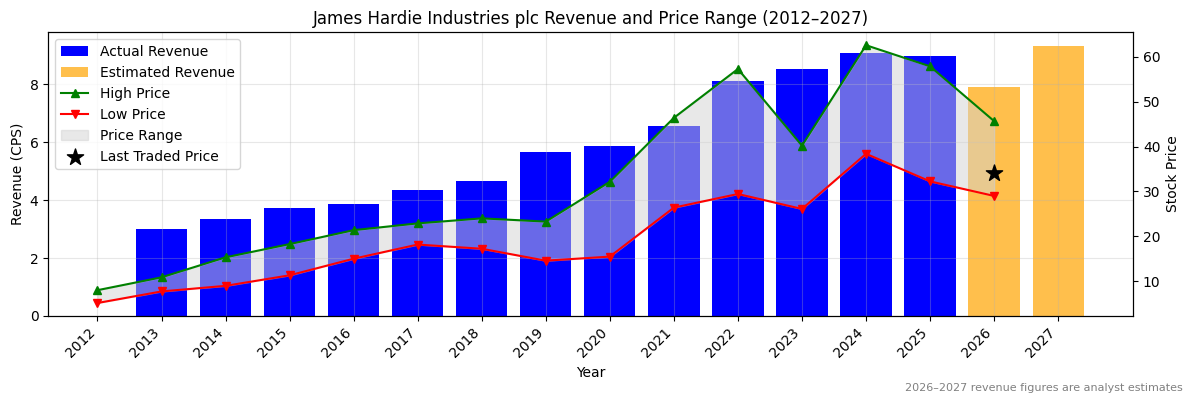
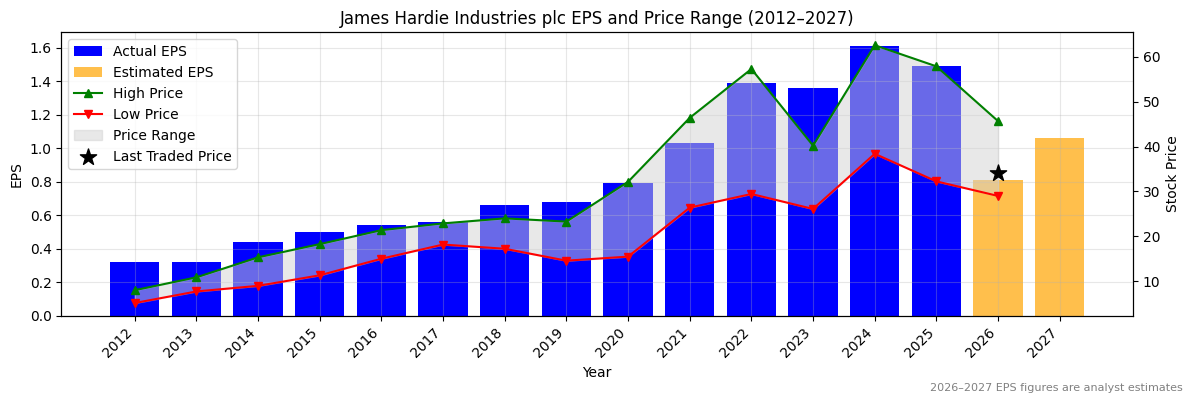
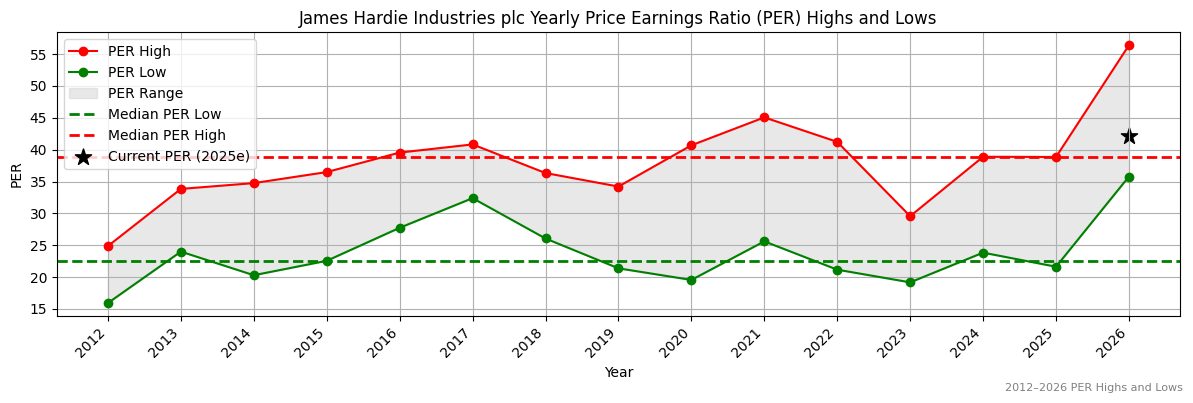
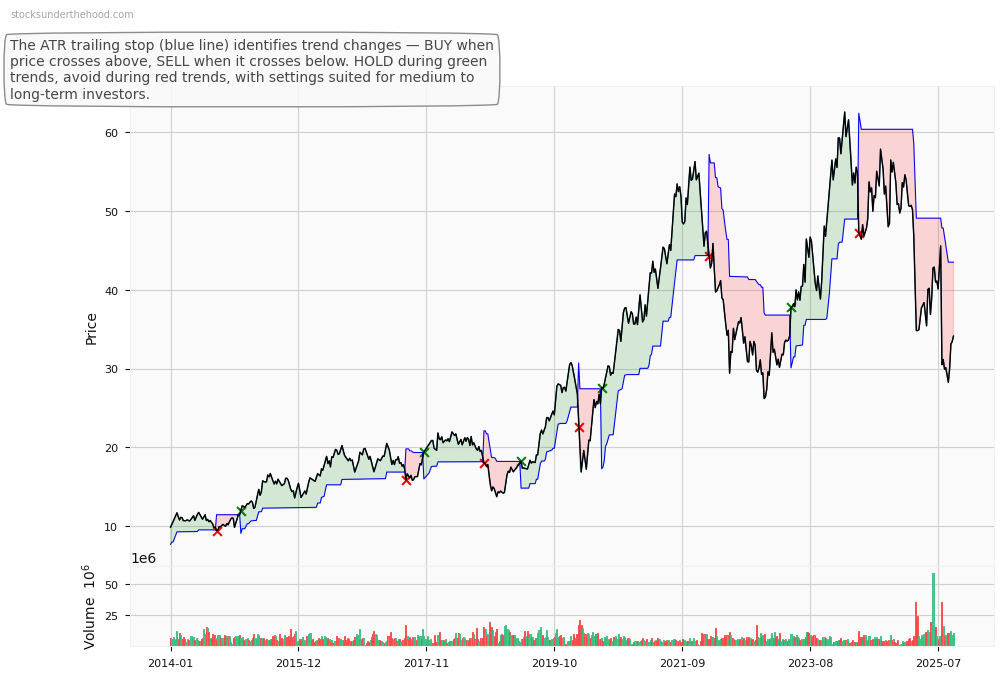
Ticker code: JHX
JHX Red Flags & Risk Indicators
❌
⚠️ RED FLAGS: 5 identified
- Increasing Shorts
- Falling Earnings
- Falling Revenues
- High Relative Valuation
- Falling EBITDA Margins
Income Statement
| Revenue 2024 Per Share |
Revenue 2025e Per Share |
Revenue 2026e Per Share |
Revenue 24 to 25e [%] |
Revenue 25e to 26e [%] |
EBITDA 2024 Per Share |
EBITDA 2025e Per Share |
EBITDA 2026e Per Share |
EBITDA 24 to 25e [%] |
EBITDA 25e to 26e [%] |
| 9.074 |
8.97985 |
7.92557 |
-1.0 |
-11.7 |
2.59521 |
2.5114 |
1.92382 |
-3.2 |
-23.4 |
JHX Revenue Per Share (2012–2027)
❌
JHX Earnings before Interest, Tax, Depreciation and Amortisation (EBITDA) Per Share (2012–2027)
❌
JHX Normalised Earnings Per Share (EPS) (2012–2027)
❌
Valuation
| Price To Sales |
Price To Book |
PER 2023 |
PER 2024 |
13Y Median PER Low |
PER 2025e |
13Y Median PER High |
PER 2026e |
Last Updated |
| 4.9 |
6.1 |
23.7 |
20.0 |
22.6 |
21.6 |
38.9 |
39.8 |
14/9/25 |
JHX Yearly Price Earnings Ratio (PER) Highs and Lows
✅✅
JHX Weekly Price Chart with Average True Range (ATR) Trailing Stop (10-Year View)
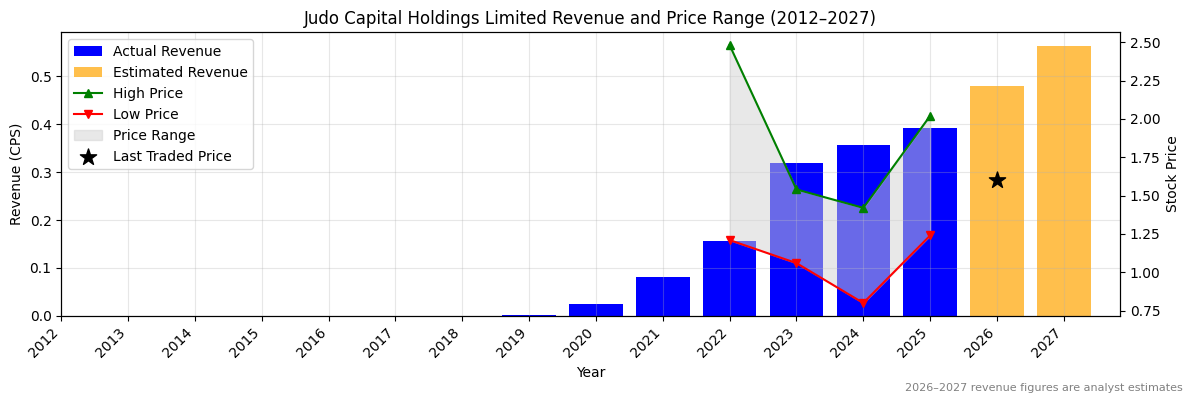
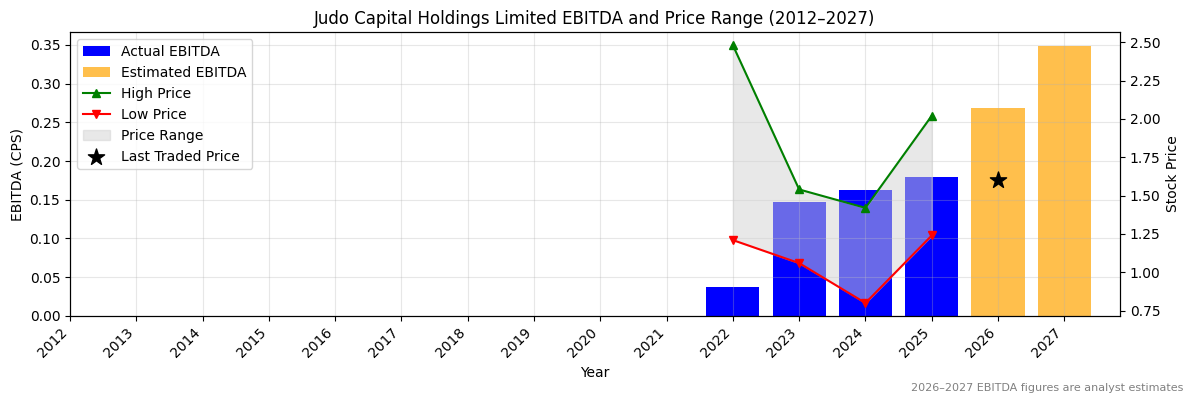
Ticker code: JDO
JDO Red Flags & Risk Indicators
❌
⚠️ RED FLAGS: 3 identified
- Low Operating Margin
- Falling Earnings
- Falling Revenues
Income Statement
| Revenue 2024 Per Share |
Revenue 2025e Per Share |
Revenue 2026e Per Share |
Revenue 24 to 25e [%] |
Revenue 25e to 26e [%] |
EBITDA 2024 Per Share |
EBITDA 2025e Per Share |
EBITDA 2026e Per Share |
EBITDA 24 to 25e [%] |
EBITDA 25e to 26e [%] |
| 0.35761 |
0.39119 |
0.48081 |
9.4 |
22.9 |
0.16244 |
0.17925 |
0.26896 |
10.3 |
50.0 |
JDO Revenue Per Share (2012–2027)
✅
JDO Earnings before Interest, Tax, Depreciation and Amortisation (EBITDA) Per Share (2012–2027)
✅
JDO Normalised Earnings Per Share (EPS) (2012–2027)
✅✅
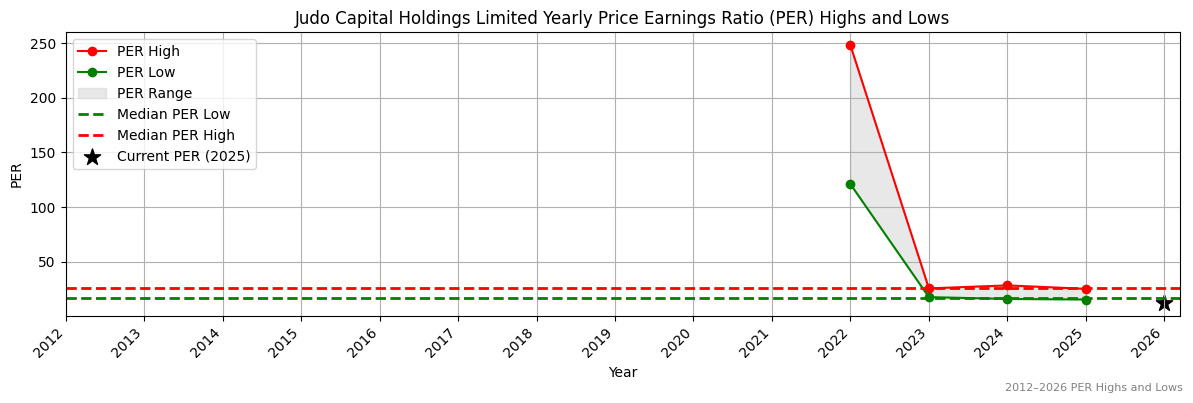
Valuation
| Price To Sales |
Price To Book |
PER 2023 |
PER 2024 |
13Y Median PER Low |
PER 2025e |
13Y Median PER High |
PER 2026e |
Last Updated |
| 5.5 |
1.1 |
28.2 |
33.8 |
16.8 |
21.1 |
25.7 |
13.0 |
21/4/25 |
JDO Yearly Price Earnings Ratio (PER) Highs and Lows
✅
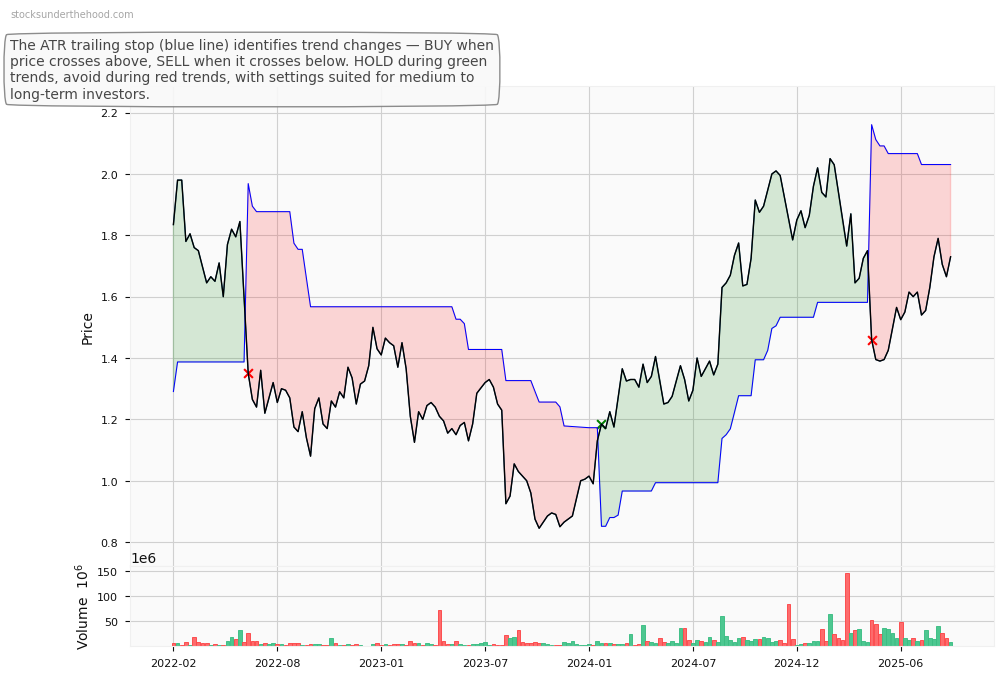
JDO Weekly Price Chart with Average True Range (ATR) Trailing Stop (10-Year View)