Ticker code: JBH
JBH Red Flags & Risk Indicators
⚠️
⚠️ RED FLAGS: 1 identified
Income Statement
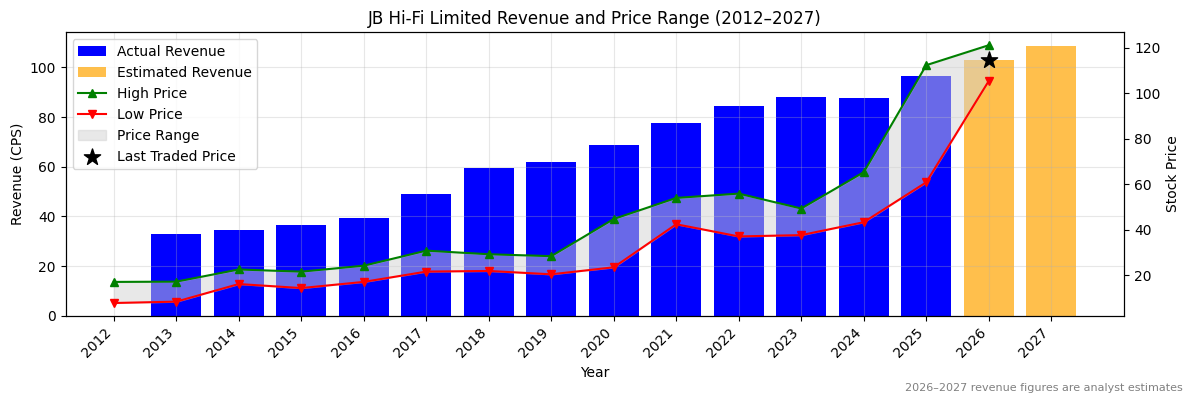
| Revenue 2024 Per Share |
Revenue 2025e Per Share |
Revenue 2026e Per Share |
Revenue 24 to 25e [%] |
Revenue 25e to 26e [%] |
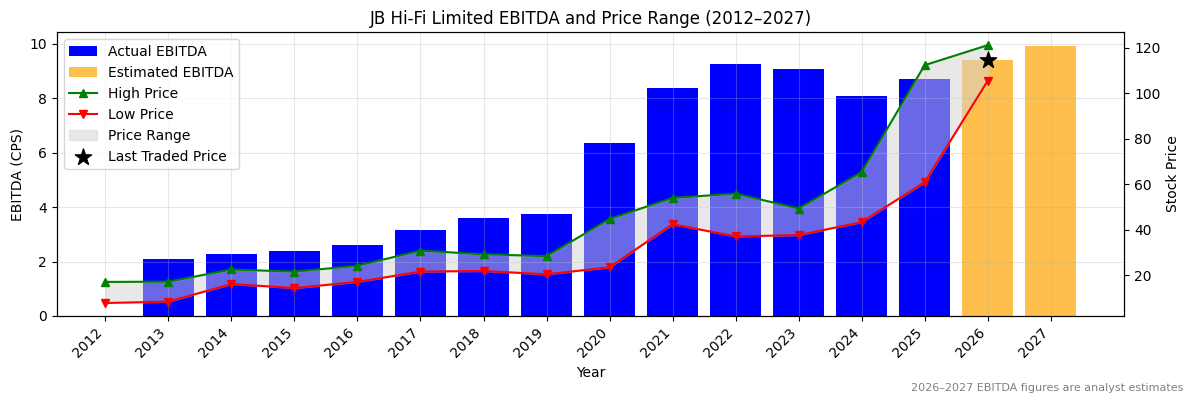
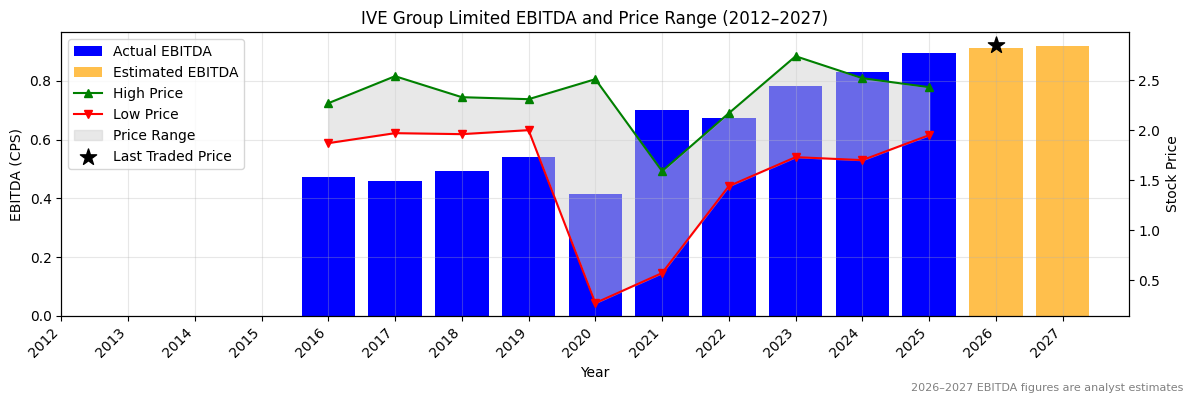
EBITDA 2024 Per Share |
EBITDA 2025e Per Share |
EBITDA 2026e Per Share |
EBITDA 24 to 25e [%] |
EBITDA 25e to 26e [%] |
| 87.73484 |
96.53723 |
103.03393 |
10.0 |
6.7 |
8.08806 |
8.7155 |
9.40019 |
7.8 |
7.9 |
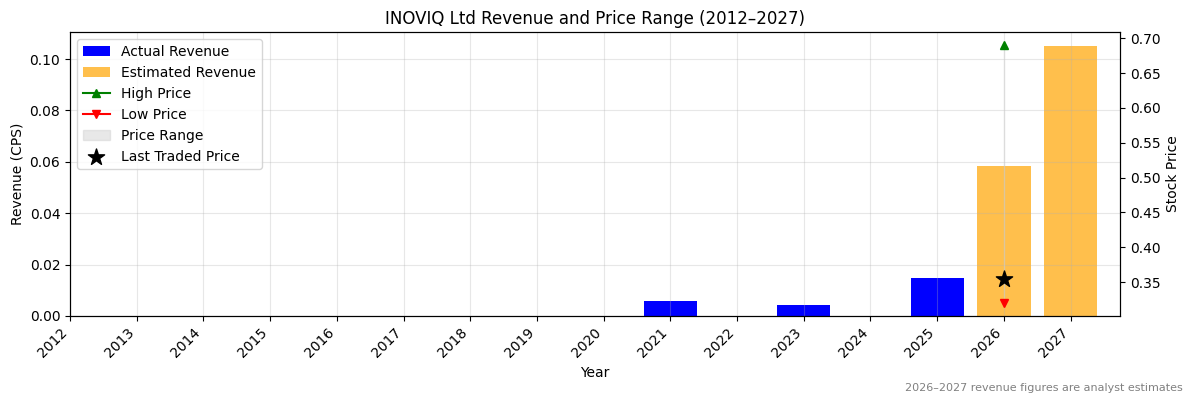
JBH Revenue Per Share (2012–2027)
✅
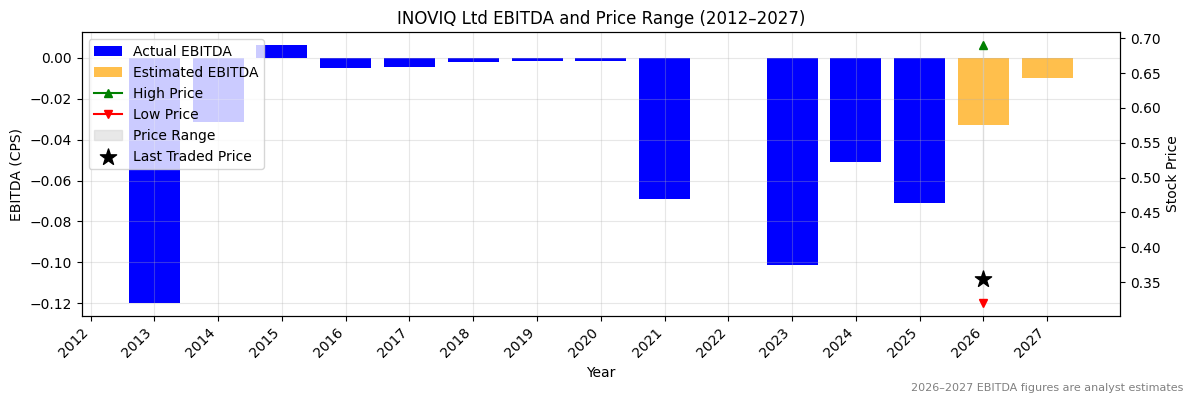
JBH Earnings before Interest, Tax, Depreciation and Amortisation (EBITDA) Per Share (2012–2027)
✅
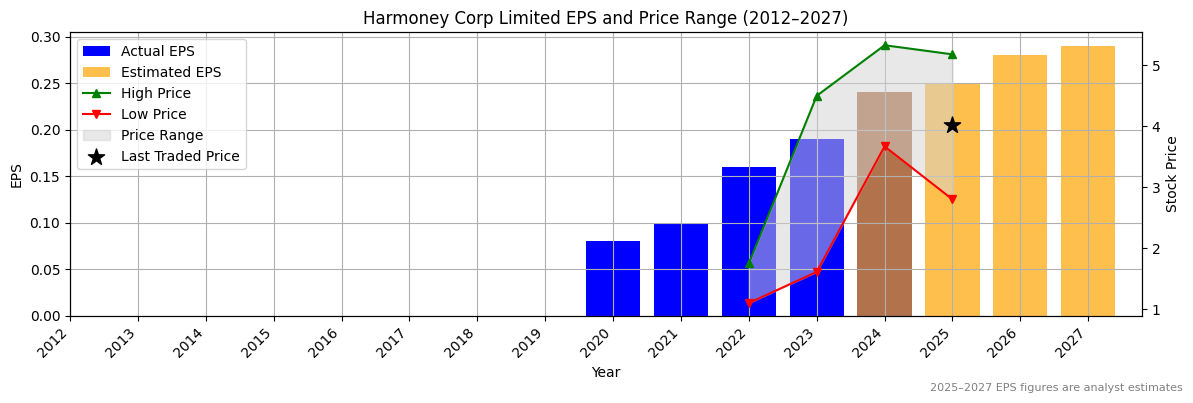
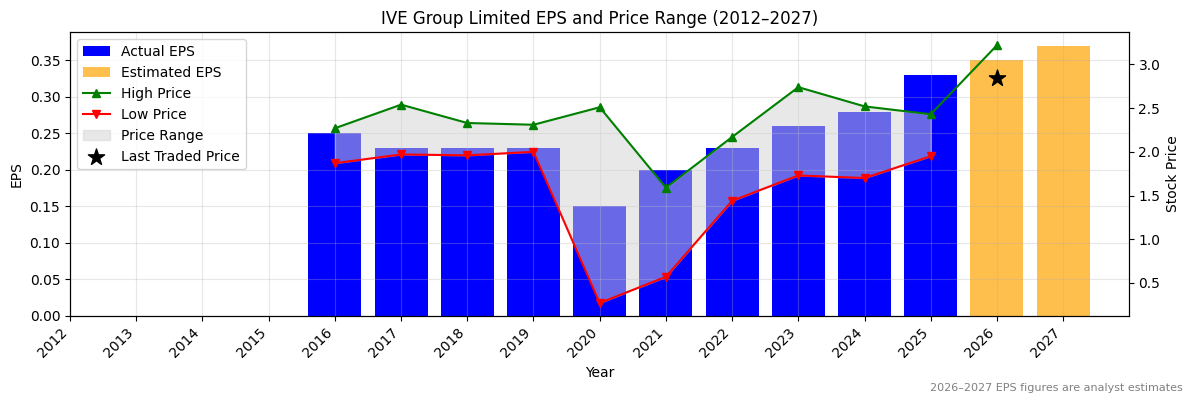
JBH Normalised Earnings Per Share (EPS) (2012–2027)
✅
Valuation
| Price To Sales |
Price To Book |
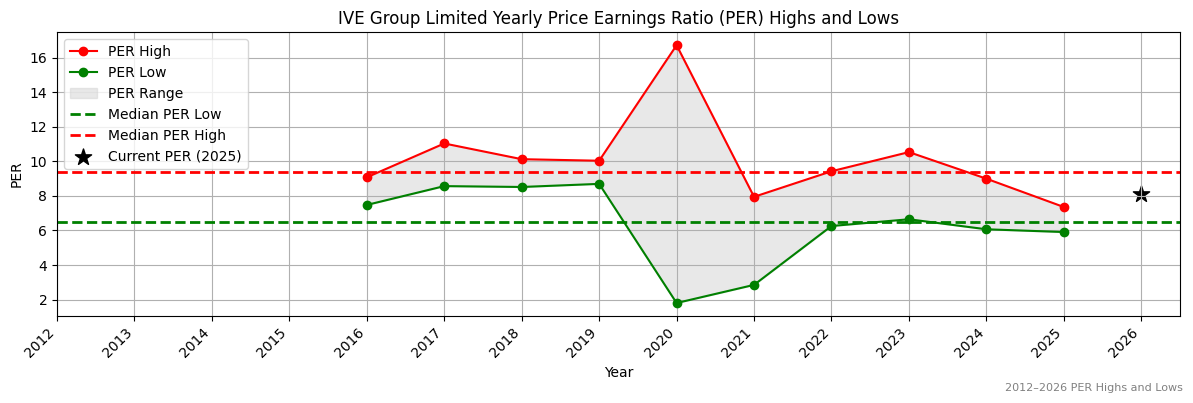
PER 2023 |
PER 2024 |
13Y Median PER Low |
PER 2025e |
13Y Median PER High |
PER 2026e |
Last Updated |
| 1.1 |
7.1 |
21.8 |
26.2 |
10.6 |
24.9 |
15.9 |
22.5 |
17/8/25 |
JBH Yearly Price Earnings Ratio (PER) Highs and Lows
❌
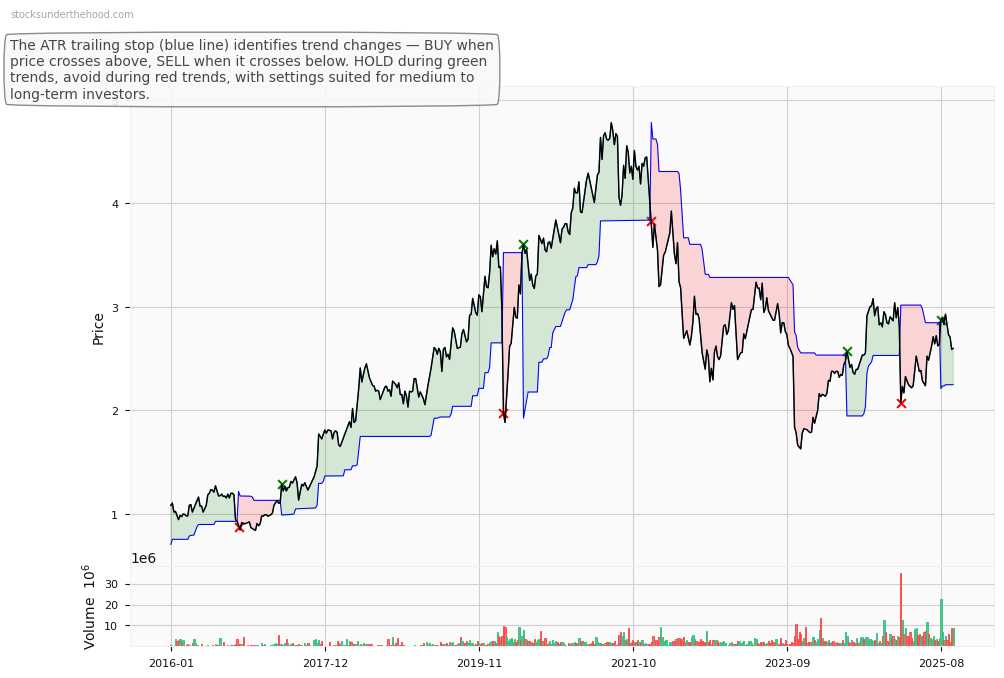
JBH Weekly Price Chart with Average True Range (ATR) Trailing Stop (10-Year View)
Ticker code: JAN
JAN Red Flags & Risk Indicators
⚠️
⚠️ RED FLAGS: 2 identified
- Large Share Issuance
- Falling EBITDA Margins
Income Statement
| Revenue 2024 Per Share |
Revenue 2025e Per Share |
Revenue 2026e Per Share |
Revenue 24 to 25e [%] |
Revenue 25e to 26e [%] |
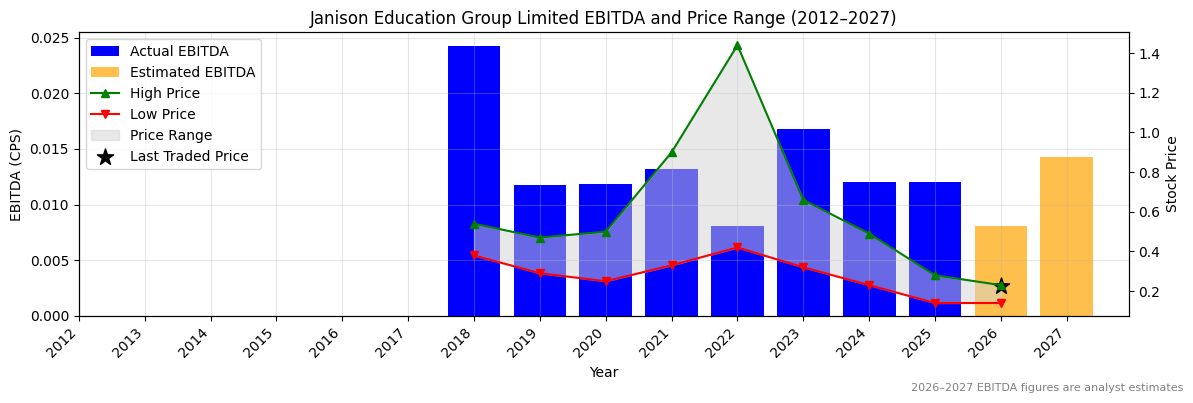
EBITDA 2024 Per Share |
EBITDA 2025e Per Share |
EBITDA 2026e Per Share |
EBITDA 24 to 25e [%] |
EBITDA 25e to 26e [%] |
| 0.16686 |
0.1807 |
0.18393 |
8.3 |
1.8 |
0.012 |
0.01204 |
0.00808 |
0.3 |
-32.9 |
JAN Revenue Per Share (2012–2027)
✅
JAN Earnings before Interest, Tax, Depreciation and Amortisation (EBITDA) Per Share (2012–2027)
✅
JAN Normalised Earnings Per Share (EPS) (2012–2027)
❌
Valuation
| Price To Sales |
Price To Book |
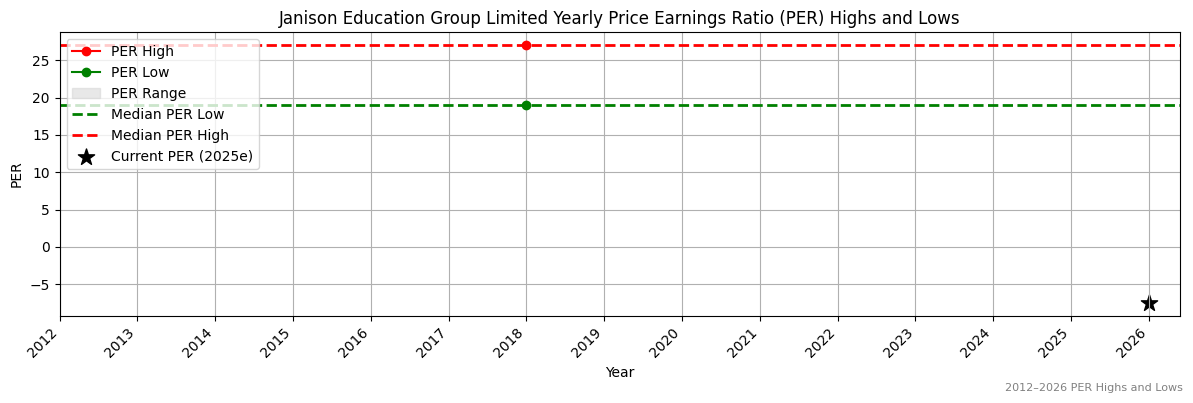
PER 2023 |
PER 2024 |
13Y Median PER Low |
PER 2025e |
13Y Median PER High |
PER 2026e |
Last Updated |
| 1.2 |
2.7 |
-7.3 |
-22.0 |
19.0 |
-7.3 |
27.0 |
-7.3 |
3/9/25 |
JAN Yearly Price Earnings Ratio (PER) Highs and Lows
✅✅
JAN Weekly Price Chart with Average True Range (ATR) Trailing Stop (10-Year View)
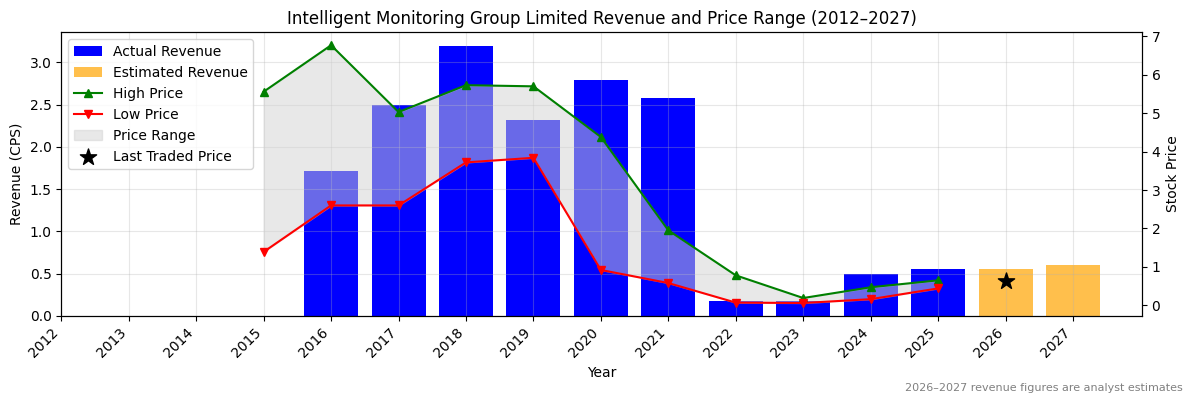
Ticker code: IMB
IMB Red Flags & Risk Indicators
❌
⚠️ RED FLAGS: 3 identified
- Large Share Issuance
- Falling Earnings
- More Net Debt Than Equity
Income Statement
| Revenue 2024 Per Share |
Revenue 2025e Per Share |
Revenue 2026e Per Share |
Revenue 24 to 25e [%] |
Revenue 25e to 26e [%] |
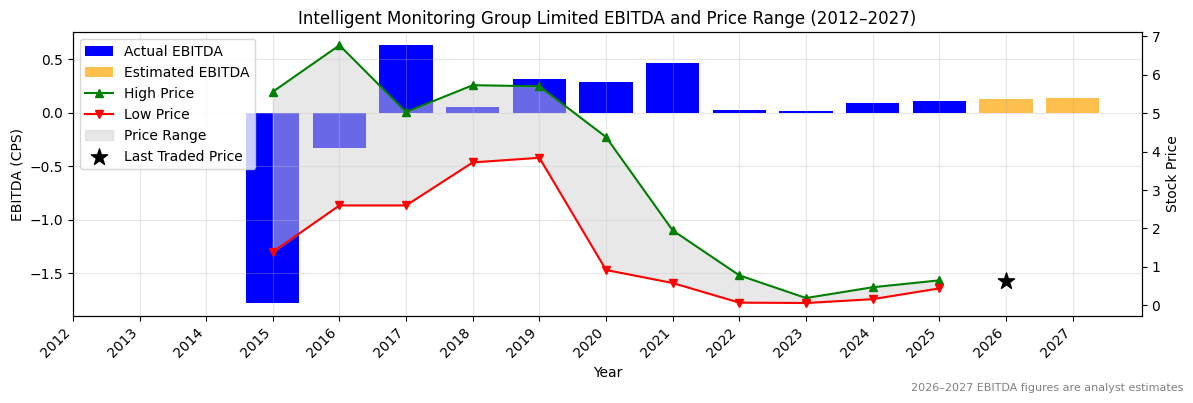
EBITDA 2024 Per Share |
EBITDA 2025e Per Share |
EBITDA 2026e Per Share |
EBITDA 24 to 25e [%] |
EBITDA 25e to 26e [%] |
| 0.49039 |
0.54925 |
0.55629 |
12.0 |
1.3 |
0.08936 |
0.11293 |
0.1259 |
26.4 |
11.5 |
IMB Revenue Per Share (2012–2027)
✅
IMB Earnings before Interest, Tax, Depreciation and Amortisation (EBITDA) Per Share (2012–2027)
✅✅
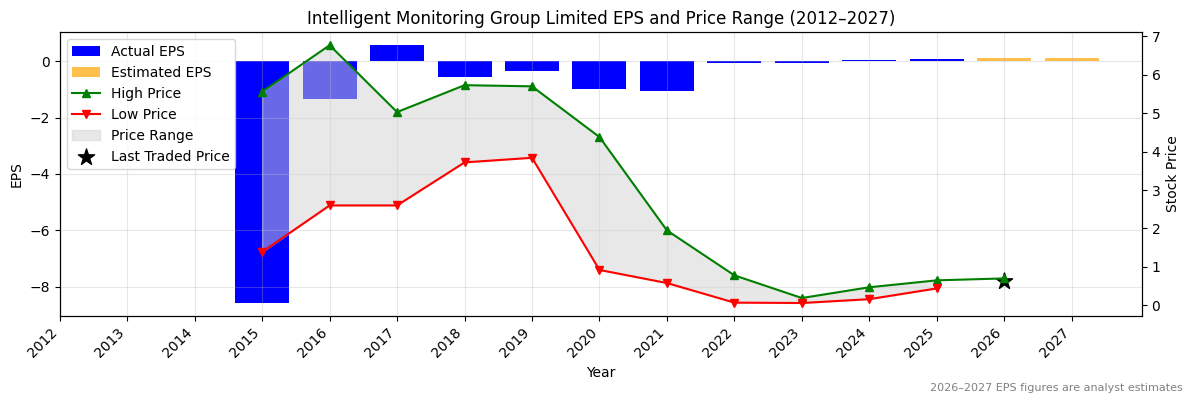
IMB Normalised Earnings Per Share (EPS) (2012–2027)
✅✅
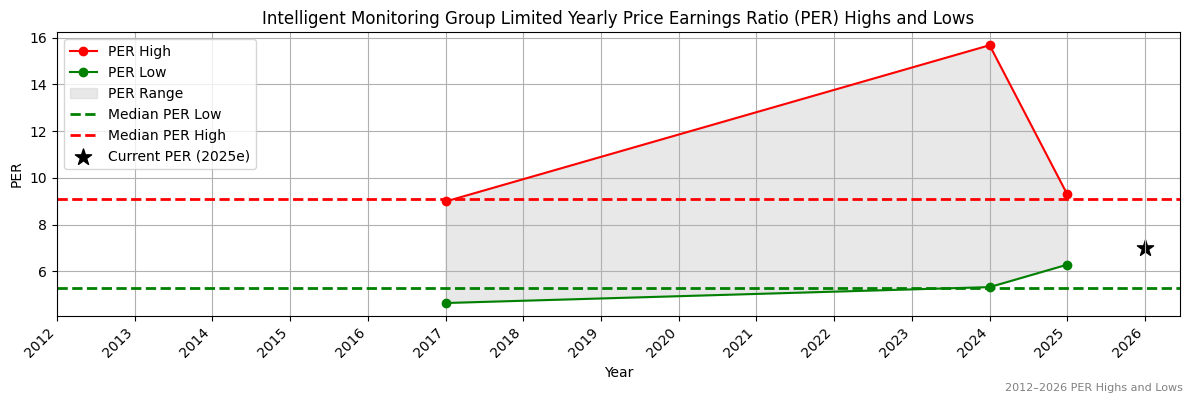
Valuation
| Price To Sales |
Price To Book |
PER 2023 |
PER 2024 |
13Y Median PER Low |
PER 2025e |
13Y Median PER High |
PER 2026e |
Last Updated |
| 1.3 |
6.9 |
-8.9 |
20.7 |
5.3 |
8.9 |
9.1 |
6.9 |
25/7/25 |
IMB Yearly Price Earnings Ratio (PER) Highs and Lows
✅
IMB Weekly Price Chart with Average True Range (ATR) Trailing Stop (10-Year View)
Ticker code: IRI
IRI Red Flags & Risk Indicators
❌
⚠️ RED FLAGS: 4 identified
- Falling Earnings
- Falling Revenues
- High Relative Valuation
- Falling EBITDA Margins
Income Statement
| Revenue 2024 Per Share |
Revenue 2025e Per Share |
Revenue 2026e Per Share |
Revenue 24 to 25e [%] |
Revenue 25e to 26e [%] |
EBITDA 2024 Per Share |
EBITDA 2025e Per Share |
EBITDA 2026e Per Share |
EBITDA 24 to 25e [%] |
EBITDA 25e to 26e [%] |
| 0.47704 |
0.41193 |
0.42804 |
-13.6 |
3.9 |
0.14089 |
0.08174 |
0.09137 |
-42.0 |
11.8 |
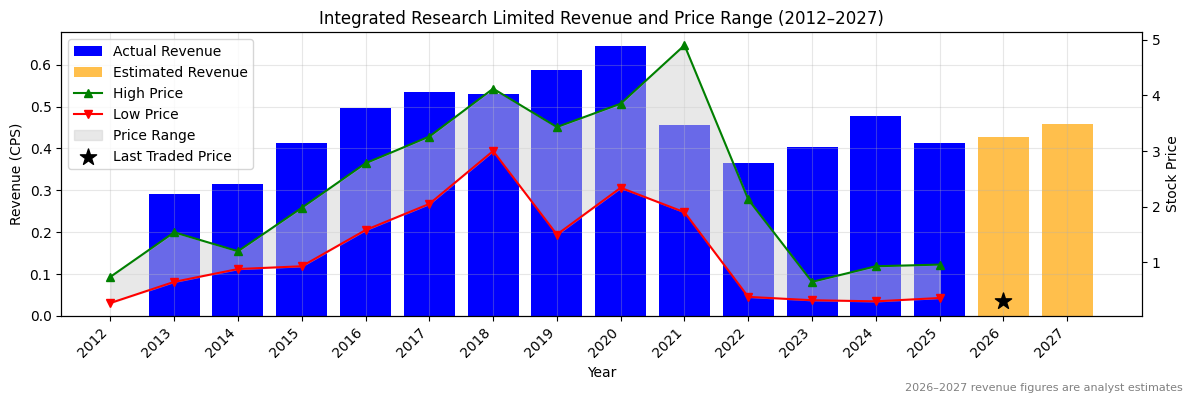
IRI Revenue Per Share (2012–2027)
❌
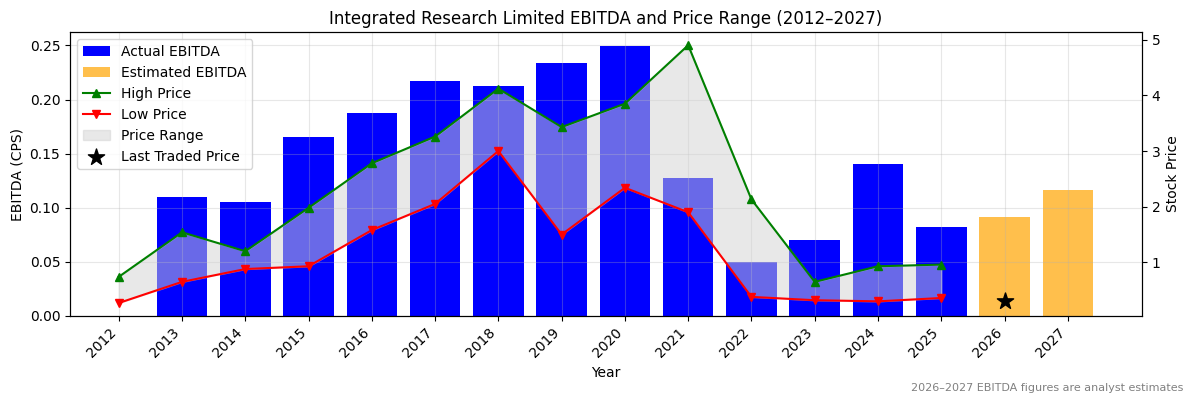
IRI Earnings before Interest, Tax, Depreciation and Amortisation (EBITDA) Per Share (2012–2027)
❌
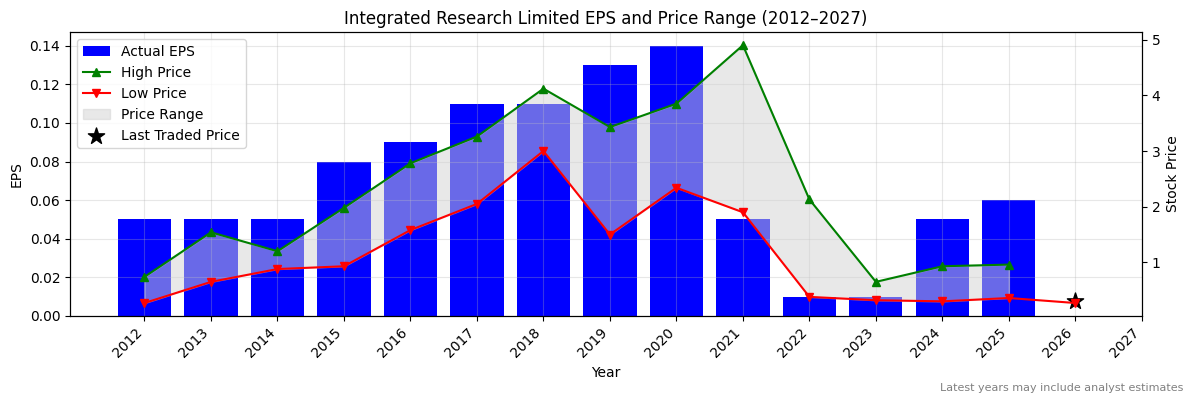
IRI Normalised Earnings Per Share (EPS) (2012–2027)
✅
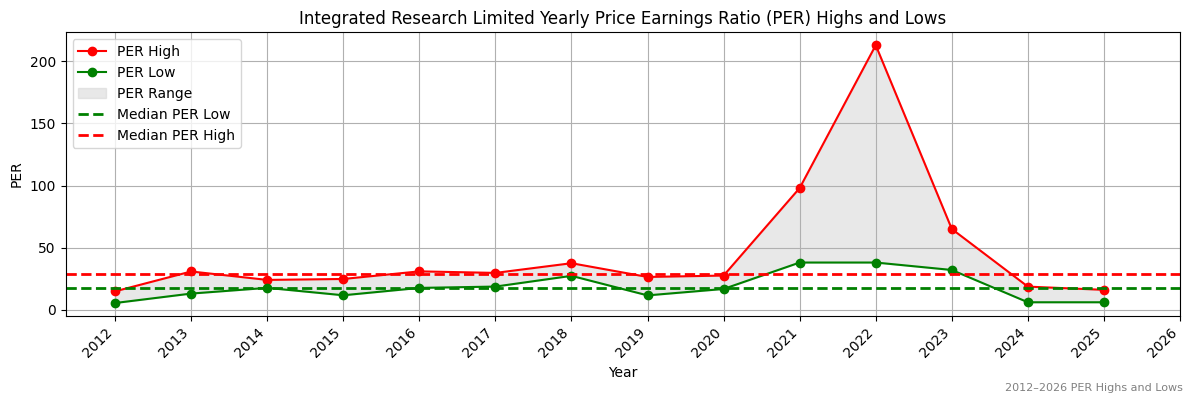
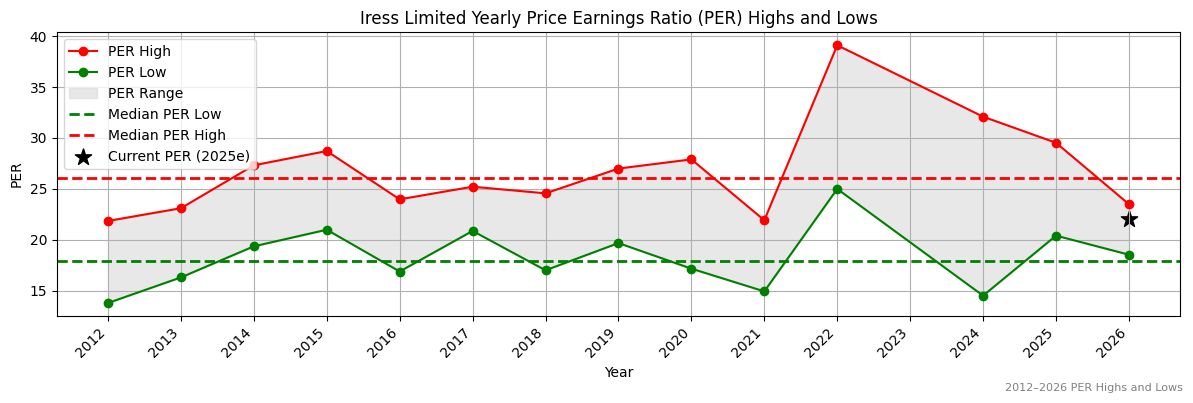
Valuation
| Price To Sales |
Price To Book |
PER 2023 |
PER 2024 |
13Y Median PER Low |
PER 2025e |
13Y Median PER High |
PER 2026e |
Last Updated |
| 1.0 |
0.7 |
37.5 |
7.5 |
17.1 |
6.3 |
28.6 |
None |
14/5/25 |
IRI Yearly Price Earnings Ratio (PER) Highs and Lows
✅✅
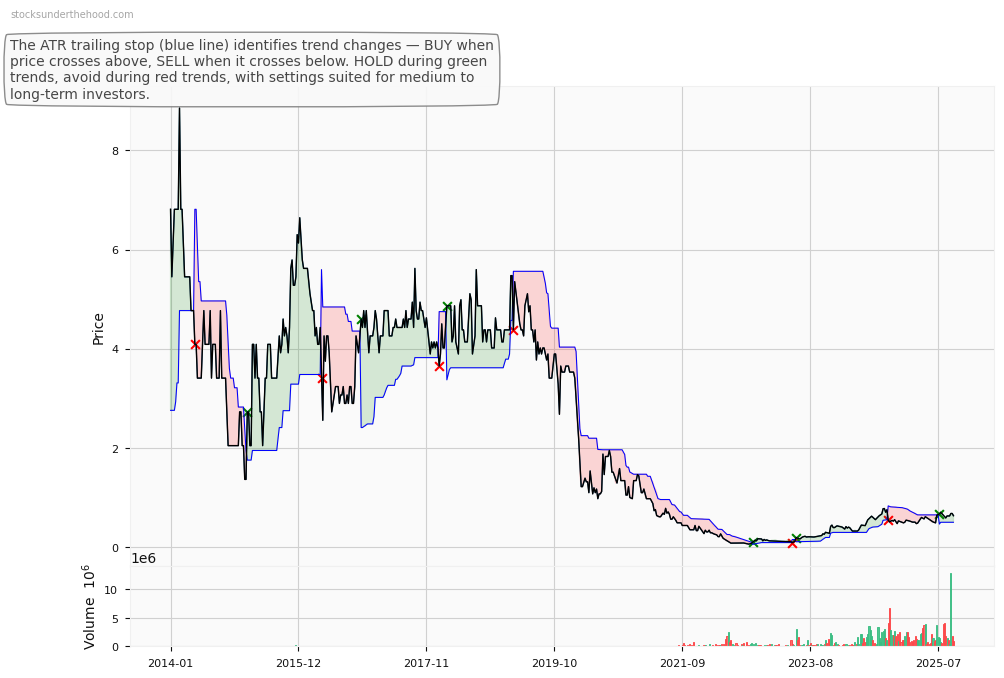
IRI Weekly Price Chart with Average True Range (ATR) Trailing Stop (10-Year View)
Ticker code: IRE
IRE Red Flags & Risk Indicators
⚠️
⚠️ RED FLAGS: 2 identified
- Increasing Shorts
- Falling Revenues
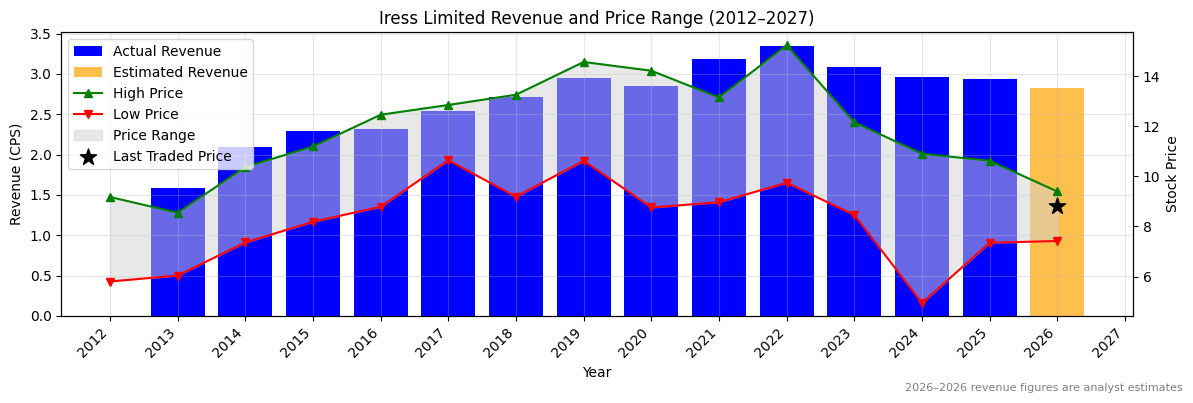
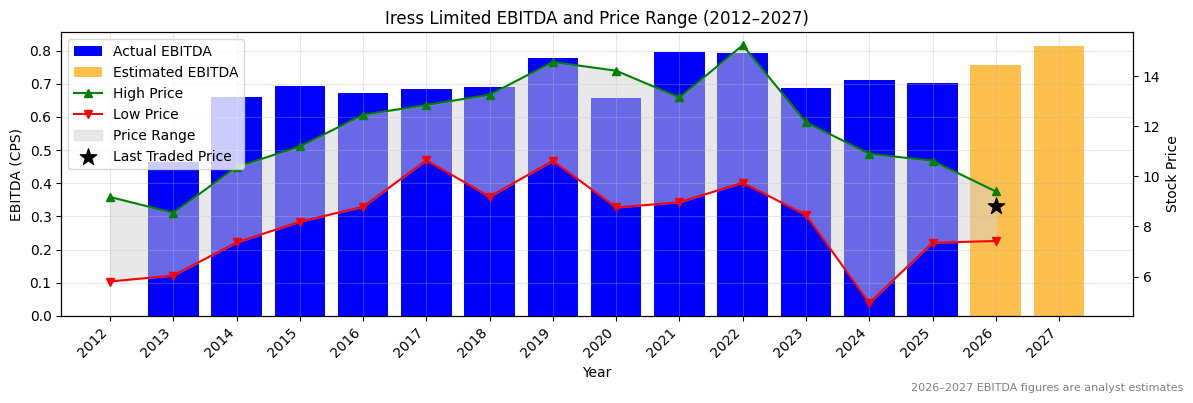
Income Statement
| Revenue 2024 Per Share |
Revenue 2025e Per Share |
Revenue 2026e Per Share |
Revenue 24 to 25e [%] |
Revenue 25e to 26e [%] |
EBITDA 2024 Per Share |
EBITDA 2025e Per Share |
EBITDA 2026e Per Share |
EBITDA 24 to 25e [%] |
EBITDA 25e to 26e [%] |
| 2.96387 |
2.9311 |
2.82789 |
-1.1 |
-3.5 |
0.71076 |
0.70166 |
0.75545 |
-1.3 |
7.7 |
IRE Revenue Per Share (2012–2027)
❌
IRE Earnings before Interest, Tax, Depreciation and Amortisation (EBITDA) Per Share (2012–2027)
❌
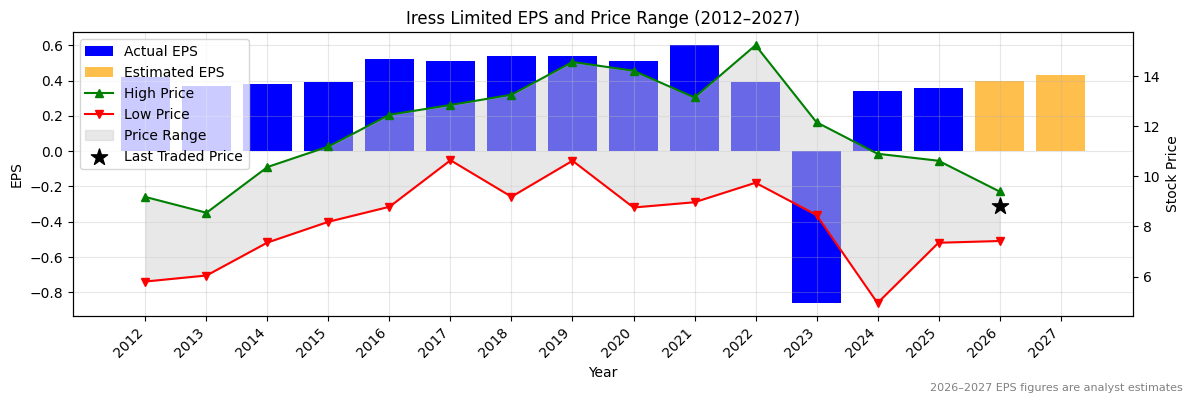
IRE Normalised Earnings Per Share (EPS) (2012–2027)
✅
Valuation
| Price To Sales |
Price To Book |
PER 2023 |
PER 2024 |
13Y Median PER Low |
PER 2025e |
13Y Median PER High |
PER 2026e |
Last Updated |
| 2.8 |
4.3 |
-10.3 |
26.1 |
17.9 |
24.6 |
26.1 |
22.1 |
23/8/25 |
IRE Yearly Price Earnings Ratio (PER) Highs and Lows
✅
IRE Weekly Price Chart with Average True Range (ATR) Trailing Stop (10-Year View)
Ticker code: IPH
IPH Red Flags & Risk Indicators
❌
⚠️ RED FLAGS: 4 identified
- Highly Shorted
- Increasing Shorts
- Falling Earnings
- Falling EBITDA Margins
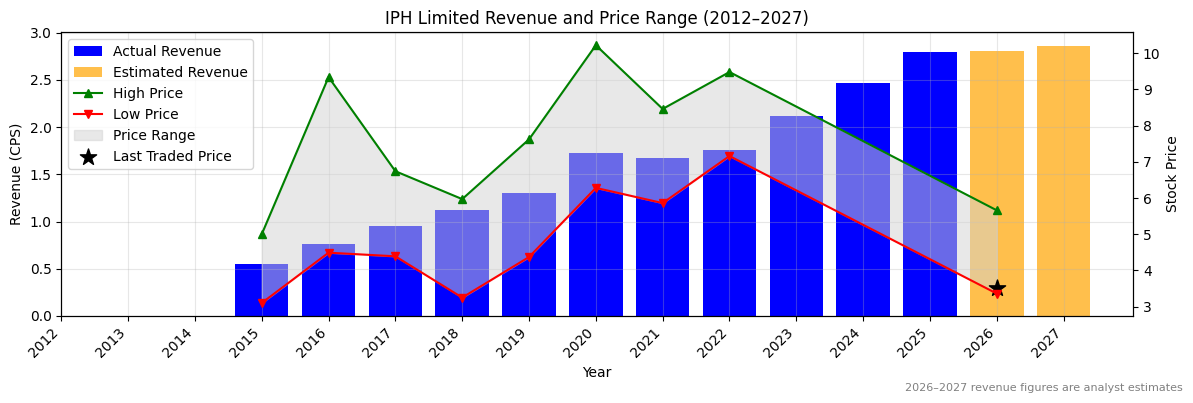
Income Statement
| Revenue 2024 Per Share |
Revenue 2025e Per Share |
Revenue 2026e Per Share |
Revenue 24 to 25e [%] |
Revenue 25e to 26e [%] |
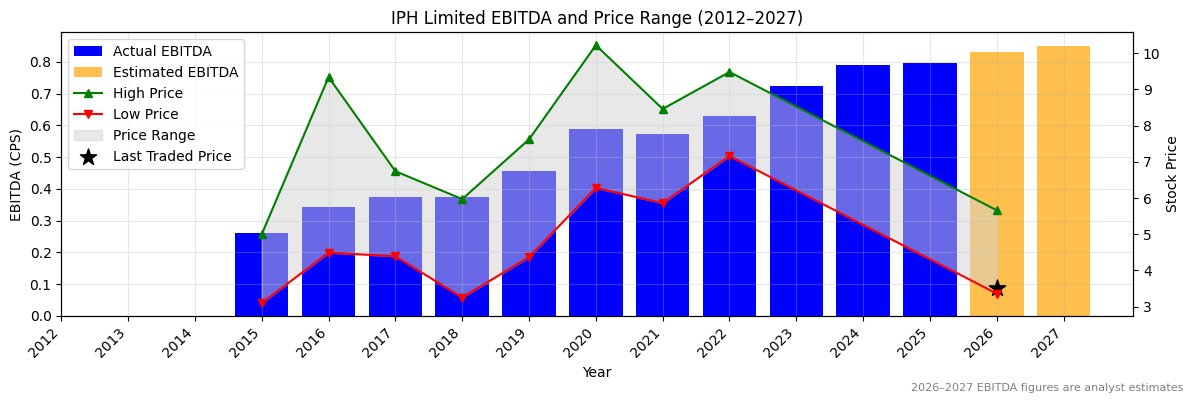
EBITDA 2024 Per Share |
EBITDA 2025e Per Share |
EBITDA 2026e Per Share |
EBITDA 24 to 25e [%] |
EBITDA 25e to 26e [%] |
| 2.46225 |
2.79536 |
2.80728 |
13.5 |
0.4 |
0.78926 |
0.79539 |
0.83062 |
0.8 |
4.4 |
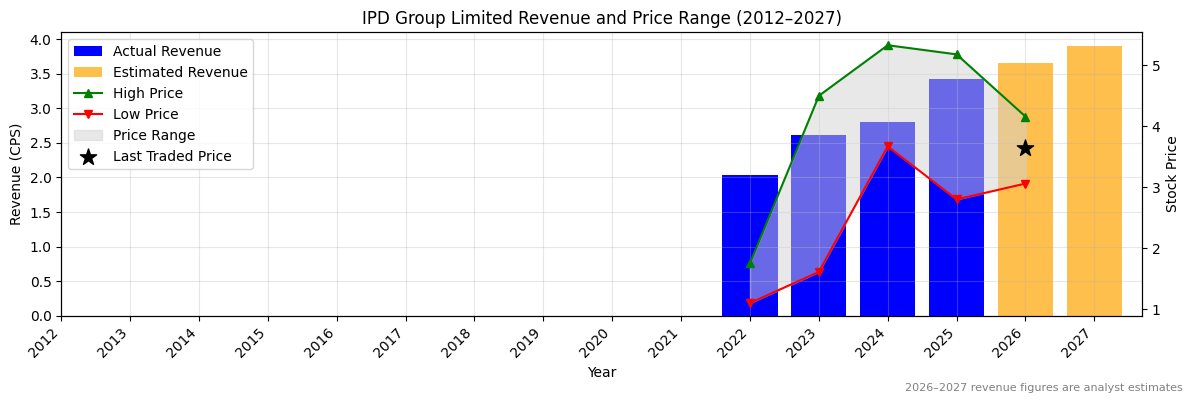
IPH Revenue Per Share (2012–2027)
✅
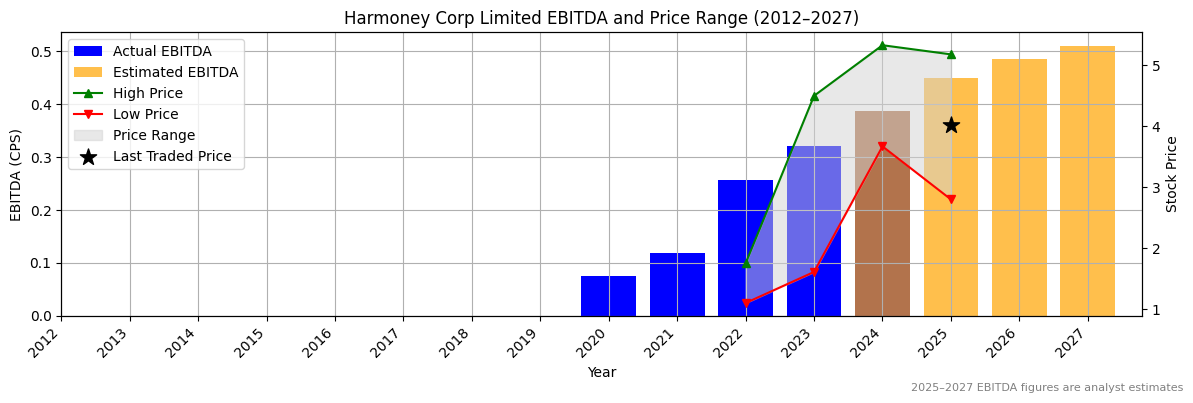
IPH Earnings before Interest, Tax, Depreciation and Amortisation (EBITDA) Per Share (2012–2027)
✅
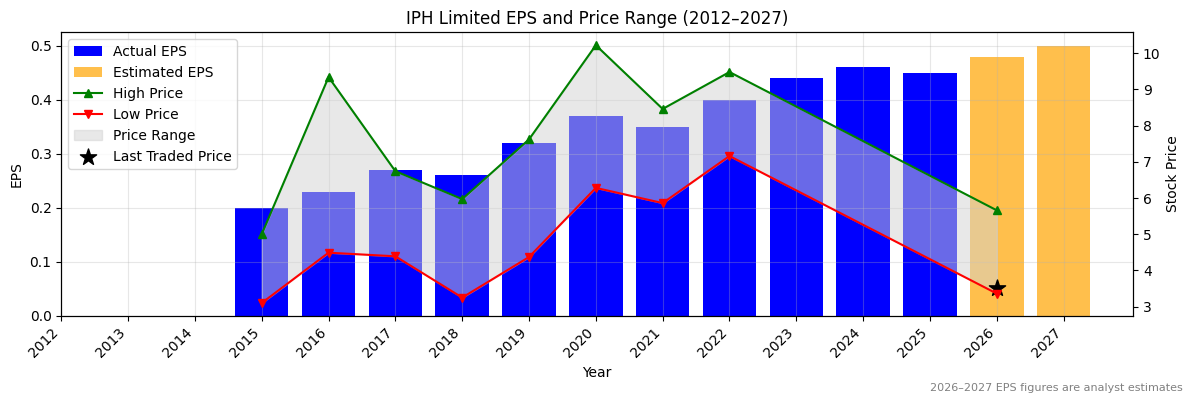
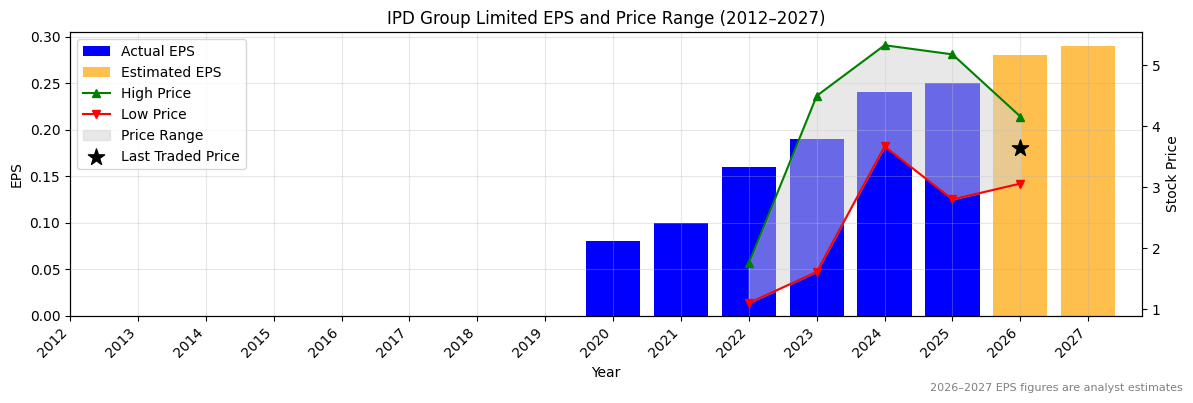
IPH Normalised Earnings Per Share (EPS) (2012–2027)
❌
Valuation
| Price To Sales |
Price To Book |
PER 2023 |
PER 2024 |
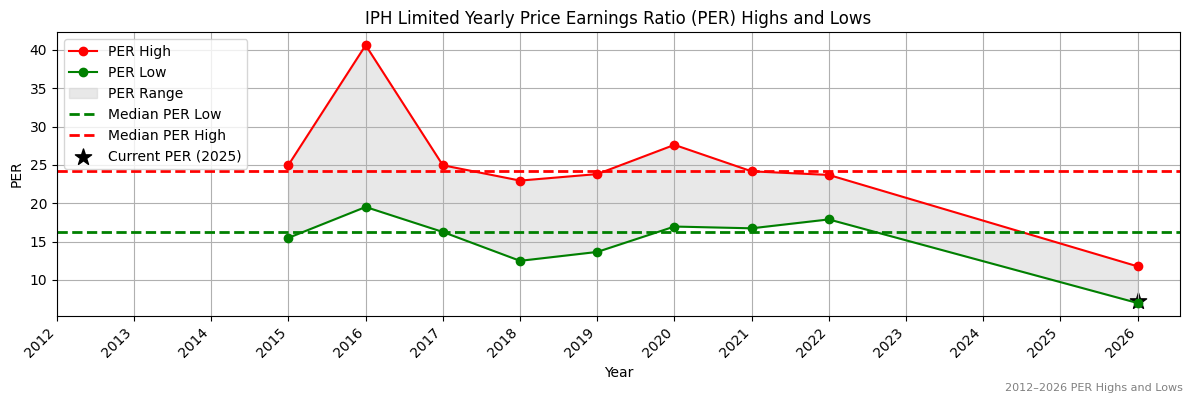
13Y Median PER Low |
PER 2025e |
13Y Median PER High |
PER 2026e |
Last Updated |
| 1.4 |
1.4 |
8.4 |
8.0 |
16.3 |
8.2 |
24.2 |
7.7 |
11/10/25 |
IPH Yearly Price Earnings Ratio (PER) Highs and Lows
✅✅
IPH Weekly Price Chart with Average True Range (ATR) Trailing Stop (10-Year View)
Ticker code: IPG
IPG Red Flags & Risk Indicators
⚠️
⚠️ RED FLAGS: 2 identified
- Falling Earnings
- Falling EBITDA Margins
Income Statement
| Revenue 2024 Per Share |
Revenue 2025e Per Share |
Revenue 2026e Per Share |
Revenue 24 to 25e [%] |
Revenue 25e to 26e [%] |
EBITDA 2024 Per Share |
EBITDA 2025e Per Share |
EBITDA 2026e Per Share |
EBITDA 24 to 25e [%] |
EBITDA 25e to 26e [%] |
| 2.80851 |
3.4254 |
3.65188 |
22.0 |
6.6 |
0.38781 |
0.44744 |
0.47414 |
15.4 |
6.0 |
IPG Revenue Per Share (2012–2027)
✅✅
IPG Earnings before Interest, Tax, Depreciation and Amortisation (EBITDA) Per Share (2012–2027)
✅
IPG Normalised Earnings Per Share (EPS) (2012–2027)
✅
Valuation
| Price To Sales |
Price To Book |
PER 2023 |
PER 2024 |
13Y Median PER Low |
PER 2025e |
13Y Median PER High |
PER 2026e |
Last Updated |
| 1.1 |
2.3 |
19.4 |
15.3 |
10.9 |
14.7 |
20.7 |
13.1 |
6/10/25 |
IPG Yearly Price Earnings Ratio (PER) Highs and Lows
✅
IPG Weekly Price Chart with Average True Range (ATR) Trailing Stop (10-Year View)
Ticker code: ASX:IPG
ASX:IPG Red Flags & Risk Indicators
⚠️
⚠️ RED FLAGS: 1 identified
Income Statement
| Revenue 2024 Per Share |
Revenue 2025e Per Share |
Revenue 2026e Per Share |
Revenue 24 to 25e [%] |
Revenue 25e to 26e [%] |
EBITDA 2024 Per Share |
EBITDA 2025e Per Share |
EBITDA 2026e Per Share |
EBITDA 24 to 25e [%] |
EBITDA 25e to 26e [%] |
| 2.80905 |
3.68553 |
4.02723 |
31.2 |
9.3 |
0.38789 |
0.37725 |
0.5685 |
-2.7 |
50.7 |
ASX:IPG Revenue Per Share (2012–2027)
✅✅
ASX:IPG Earnings before Interest, Tax, Depreciation and Amortisation (EBITDA) Per Share (2012–2027)
❌
ASX:IPG Normalised Earnings Per Share (EPS) (2012–2027)
✅
Valuation
| Price To Sales |
Price To Book |
PER 2023 |
PER 2024 |
13Y Median PER Low |
PER 2025e |
13Y Median PER High |
PER 2026e |
Last Updated |
| 1.2 |
2.7 |
21.8 |
17.3 |
11.9 |
15.4 |
20.7 |
14.3 |
29/10/24 |
ASX:IPG Yearly Price Earnings Ratio (PER) Highs and Lows
✅
ASX:IPG Weekly Price Chart with Average True Range (ATR) Trailing Stop (10-Year View)
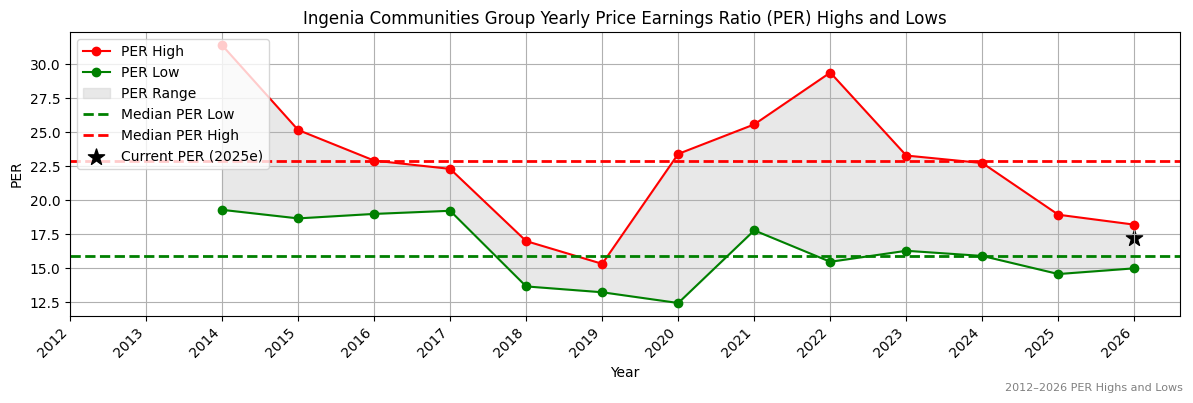
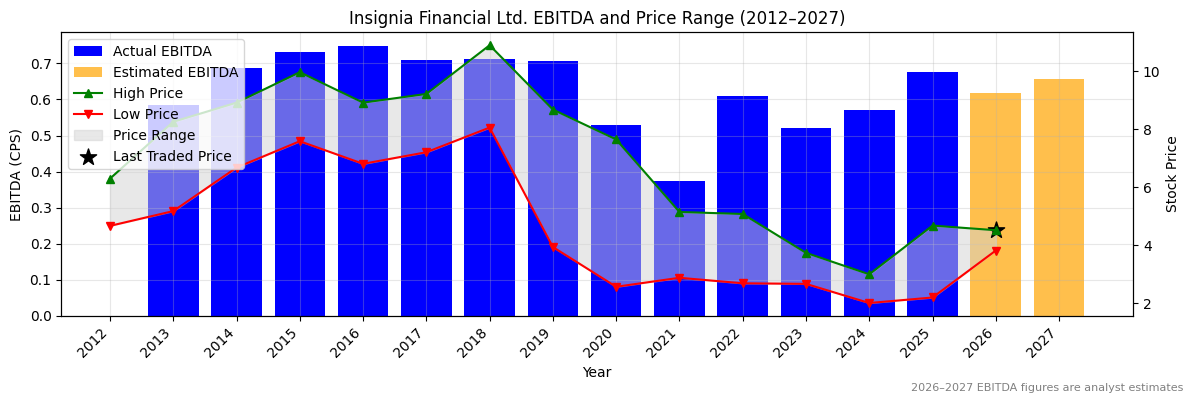
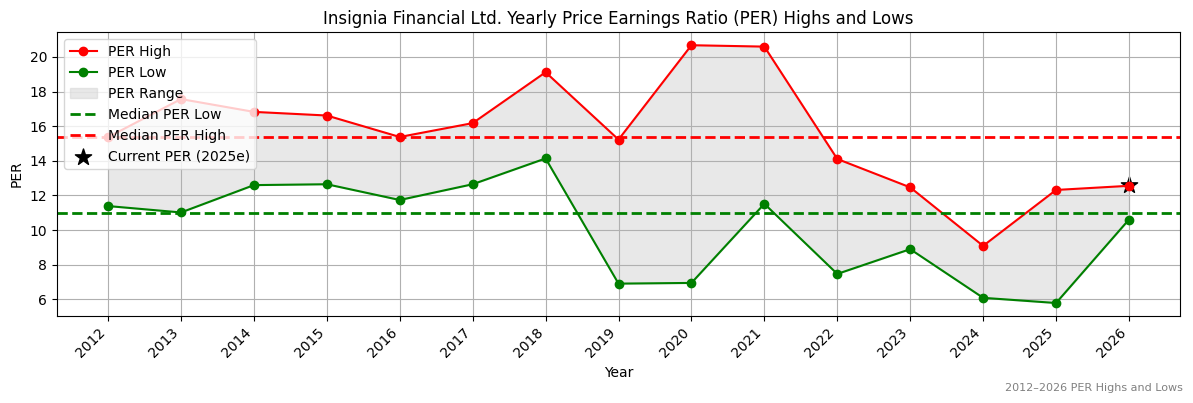
Ticker code: ING
ING Red Flags & Risk Indicators
❌
⚠️ RED FLAGS: 5 identified
- Highly Shorted
- Falling Earnings
- Falling Revenues
- More Net Debt Than Equity
- Falling EBITDA Margins
Income Statement
| Revenue 2024 Per Share |
Revenue 2025e Per Share |
Revenue 2026e Per Share |
Revenue 24 to 25e [%] |
Revenue 25e to 26e [%] |
EBITDA 2024 Per Share |
EBITDA 2025e Per Share |
EBITDA 2026e Per Share |
EBITDA 24 to 25e [%] |
EBITDA 25e to 26e [%] |
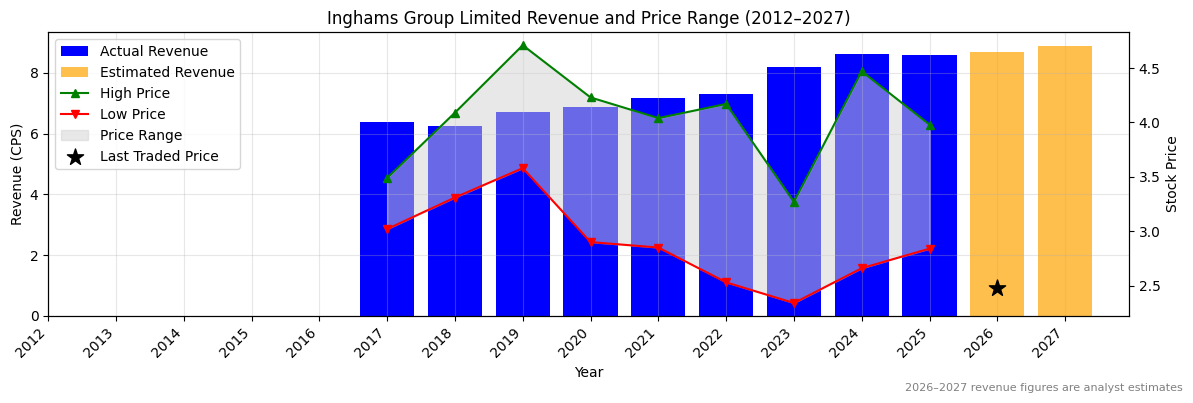
| 8.61447 |
8.57256 |
8.68735 |
-0.5 |
1.3 |
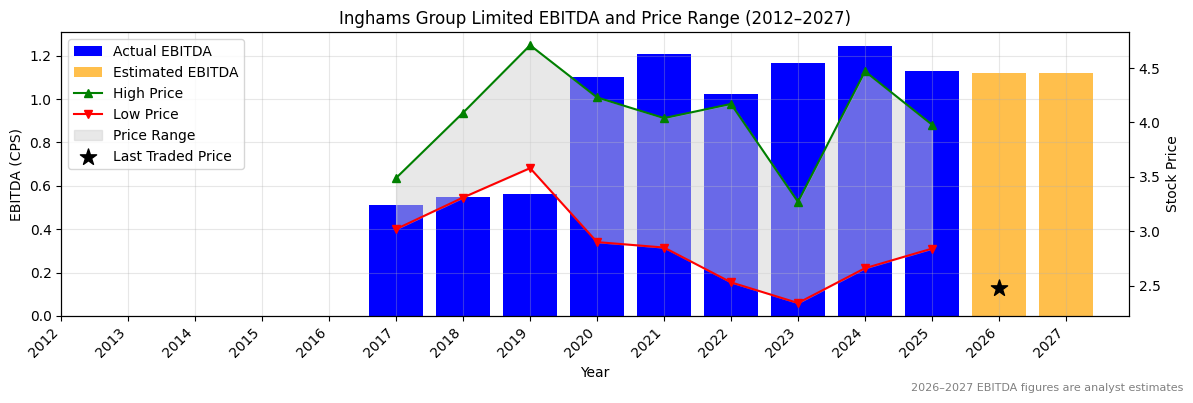
1.2459 |
1.13005 |
1.11992 |
-9.3 |
-0.9 |
ING Revenue Per Share (2012–2027)
❌
ING Earnings before Interest, Tax, Depreciation and Amortisation (EBITDA) Per Share (2012–2027)
❌
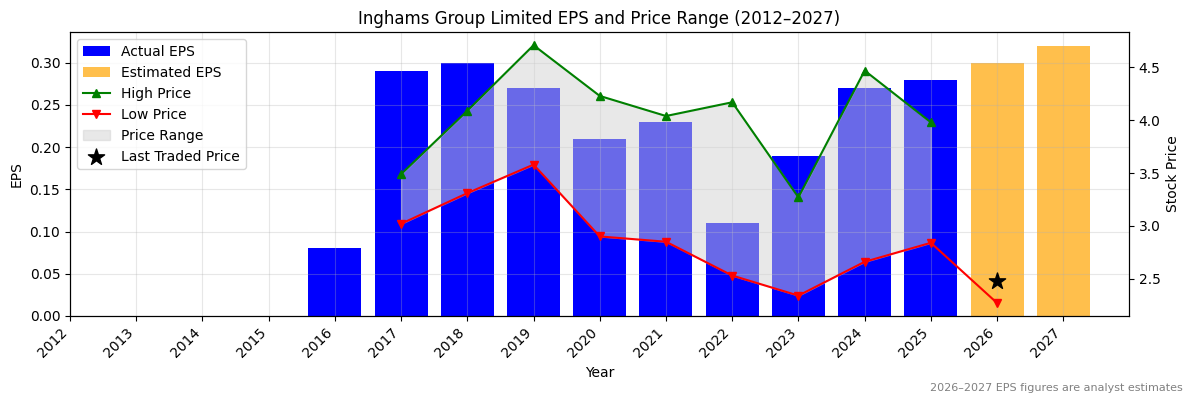
ING Normalised Earnings Per Share (EPS) (2012–2027)
✅
Valuation
| Price To Sales |
Price To Book |
PER 2023 |
PER 2024 |
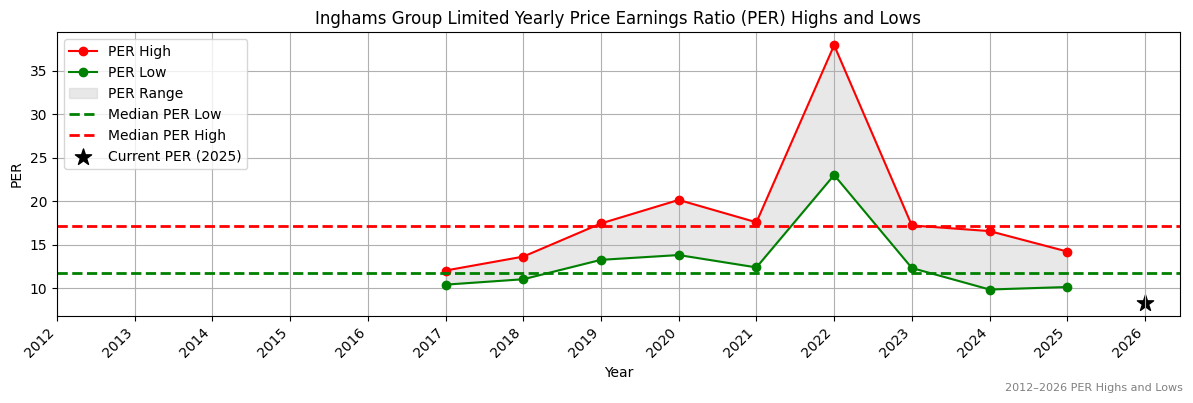
13Y Median PER Low |
PER 2025e |
13Y Median PER High |
PER 2026e |
Last Updated |
| 0.3 |
3.2 |
12.7 |
9.0 |
11.7 |
8.6 |
17.2 |
8.1 |
10/3/25 |
ING Yearly Price Earnings Ratio (PER) Highs and Lows
✅✅
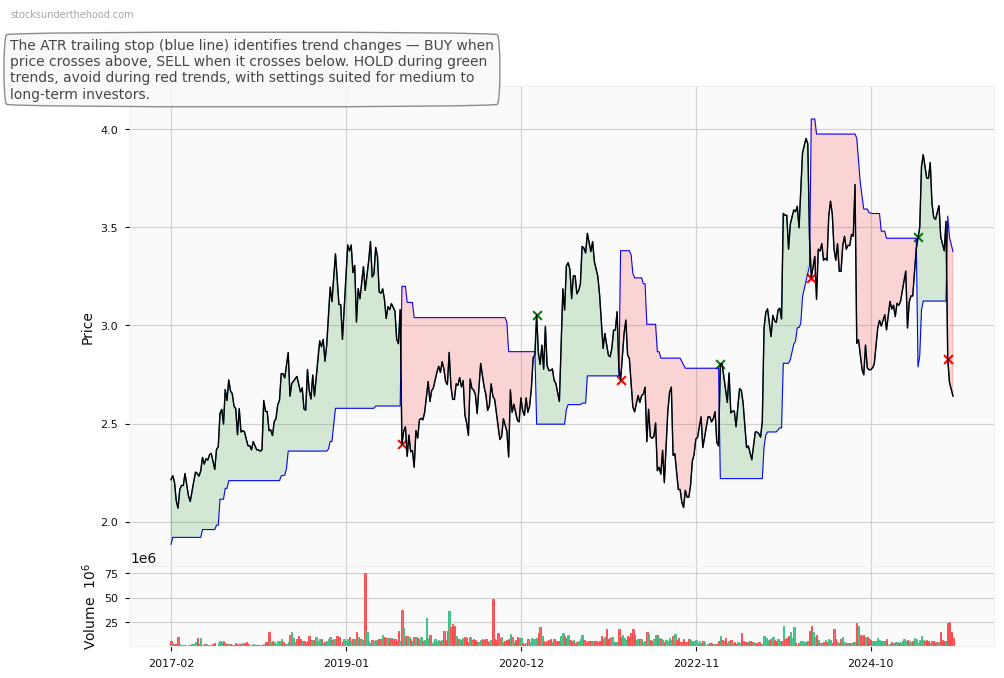
ING Weekly Price Chart with Average True Range (ATR) Trailing Stop (10-Year View)
Ticker code: INA
INA Red Flags & Risk Indicators
✅
⚠️ RED FLAGS: 0 identified
No red flags detected.
Income Statement
| Revenue 2024 Per Share |
Revenue 2025e Per Share |
Revenue 2026e Per Share |
Revenue 24 to 25e [%] |
Revenue 25e to 26e [%] |
EBITDA 2024 Per Share |
EBITDA 2025e Per Share |
EBITDA 2026e Per Share |
EBITDA 24 to 25e [%] |
EBITDA 25e to 26e [%] |
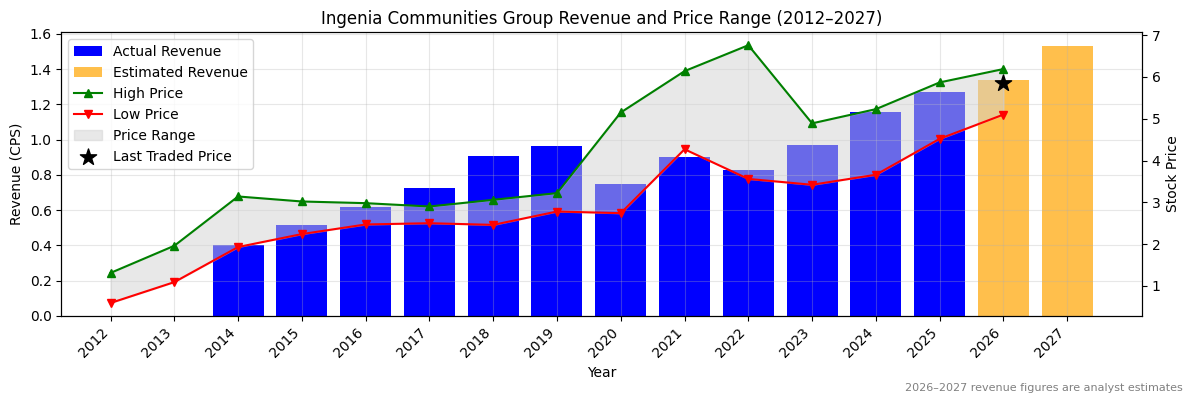
| 1.15877 |
1.27018 |
1.34019 |
9.6 |
5.5 |
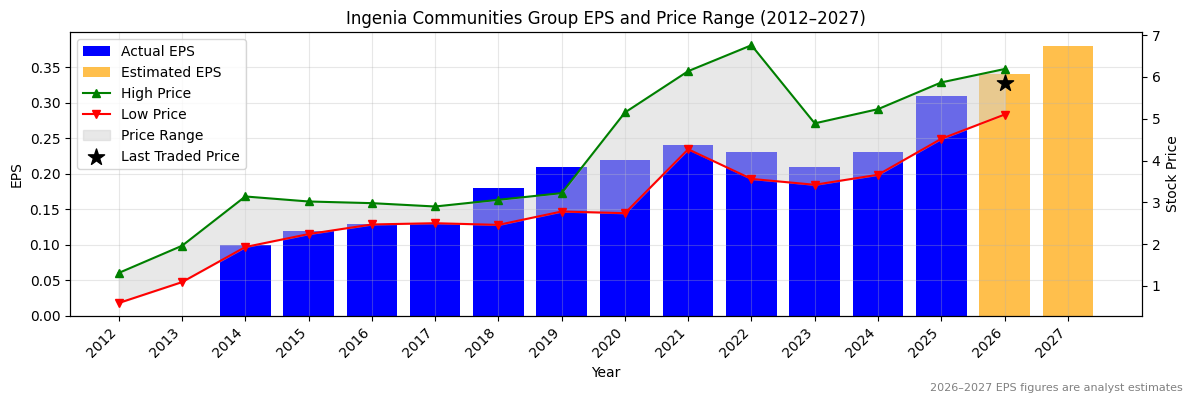
0.31905 |
0.41486 |
0.44364 |
30.0 |
6.9 |
INA Revenue Per Share (2012–2027)
✅
INA Earnings before Interest, Tax, Depreciation and Amortisation (EBITDA) Per Share (2012–2027)
✅✅
INA Normalised Earnings Per Share (EPS) (2012–2027)
✅✅
Valuation
| Price To Sales |
Price To Book |
PER 2023 |
PER 2024 |
13Y Median PER Low |
PER 2025e |
13Y Median PER High |
PER 2026e |
Last Updated |
| 4.3 |
1.4 |
26.8 |
24.4 |
15.9 |
18.1 |
22.9 |
16.5 |
29/8/25 |
INA Yearly Price Earnings Ratio (PER) Highs and Lows
✅
INA Weekly Price Chart with Average True Range (ATR) Trailing Stop (10-Year View)
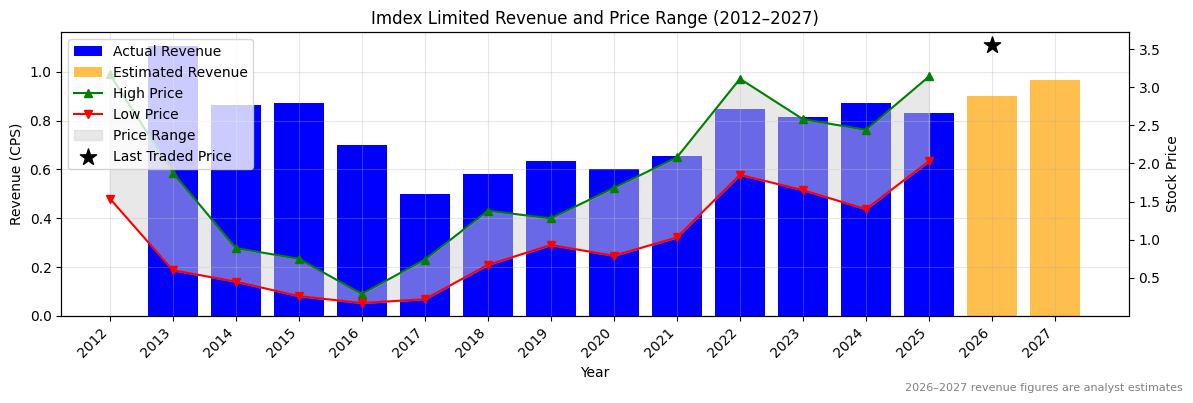
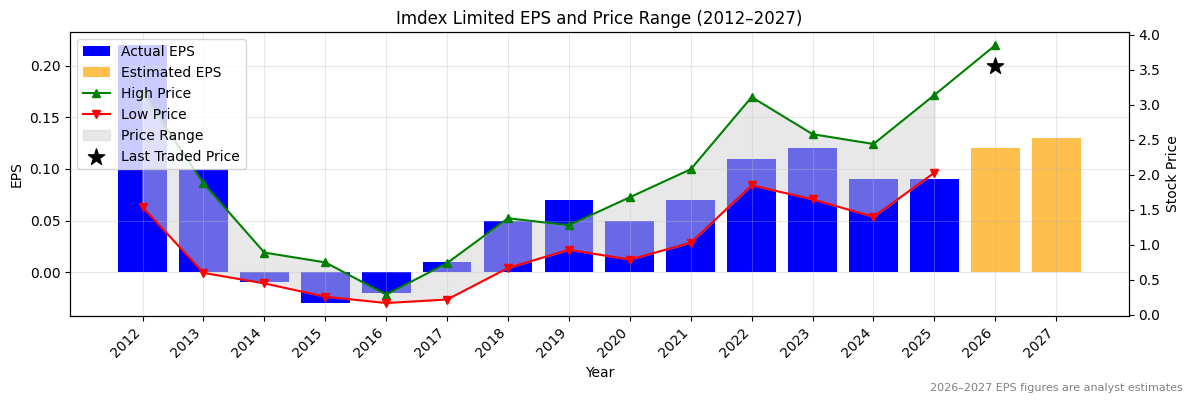
Ticker code: IMD
IMD Red Flags & Risk Indicators
⚠️
⚠️ RED FLAGS: 2 identified
- Falling Earnings
- High Relative Valuation
Income Statement
| Revenue 2024 Per Share |
Revenue 2025e Per Share |
Revenue 2026e Per Share |
Revenue 24 to 25e [%] |
Revenue 25e to 26e [%] |
EBITDA 2024 Per Share |
EBITDA 2025e Per Share |
EBITDA 2026e Per Share |
EBITDA 24 to 25e [%] |
EBITDA 25e to 26e [%] |
| 0.87228 |
0.8325 |
0.90239 |
-4.6 |
8.4 |
0.25602 |
0.25106 |
0.2829 |
-1.9 |
12.7 |
IMD Revenue Per Share (2012–2027)
❌
IMD Earnings before Interest, Tax, Depreciation and Amortisation (EBITDA) Per Share (2012–2027)
❌
IMD Normalised Earnings Per Share (EPS) (2012–2027)
❌
Valuation
| Price To Sales |
Price To Book |
PER 2023 |
PER 2024 |
13Y Median PER Low |
PER 2025e |
13Y Median PER High |
PER 2026e |
Last Updated |
| 4.1 |
2.8 |
28.7 |
38.2 |
14.7 |
38.2 |
27.9 |
28.7 |
16/6/25 |
IMD Yearly Price Earnings Ratio (PER) Highs and Lows
❌
IMD Weekly Price Chart with Average True Range (ATR) Trailing Stop (10-Year View)
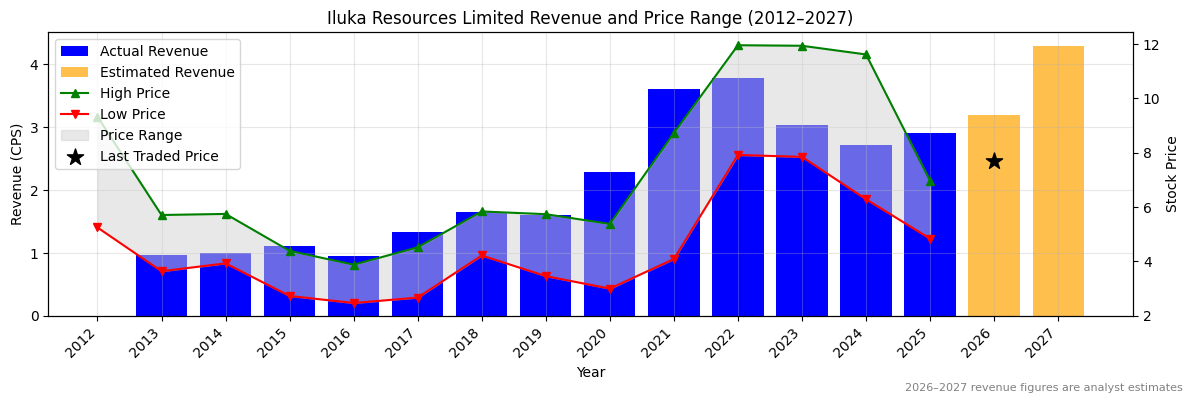
Ticker code: ILU
ILU Red Flags & Risk Indicators
⚠️
⚠️ RED FLAGS: 2 identified
- Highly Shorted
- Falling Earnings
Income Statement
| Revenue 2024 Per Share |
Revenue 2025e Per Share |
Revenue 2026e Per Share |
Revenue 24 to 25e [%] |
Revenue 25e to 26e [%] |
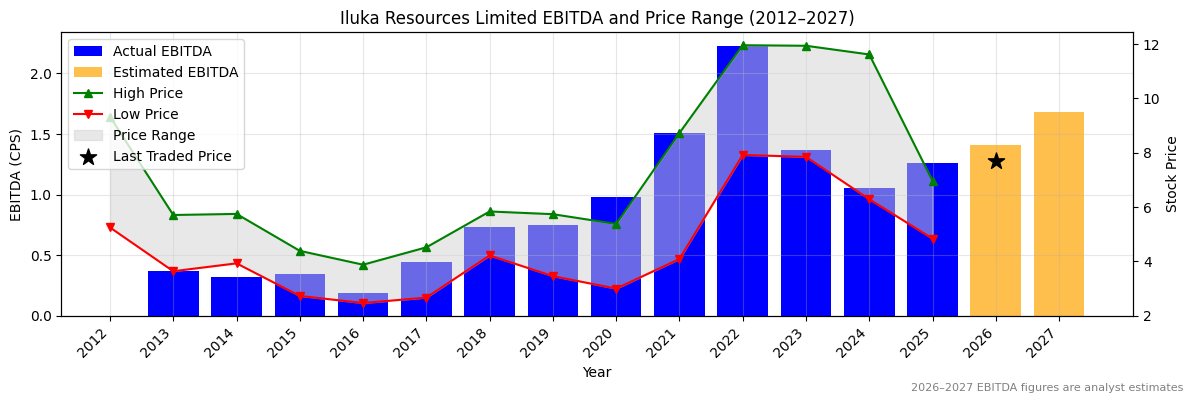
EBITDA 2024 Per Share |
EBITDA 2025e Per Share |
EBITDA 2026e Per Share |
EBITDA 24 to 25e [%] |
EBITDA 25e to 26e [%] |
| 2.71773 |
2.90517 |
3.19087 |
6.9 |
9.8 |
1.05275 |
1.26359 |
1.40946 |
20.0 |
11.5 |
ILU Revenue Per Share (2012–2027)
✅
ILU Earnings before Interest, Tax, Depreciation and Amortisation (EBITDA) Per Share (2012–2027)
✅
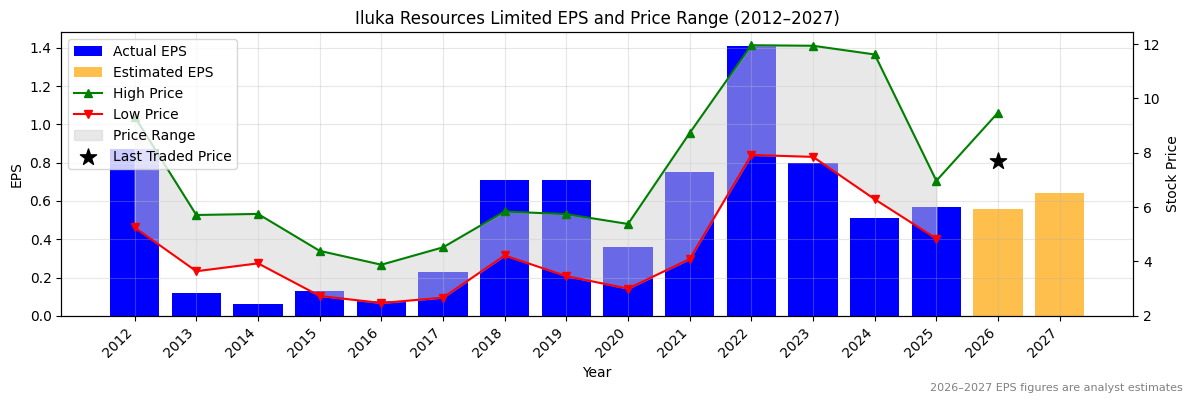
ILU Normalised Earnings Per Share (EPS) (2012–2027)
✅
Valuation
| Price To Sales |
Price To Book |
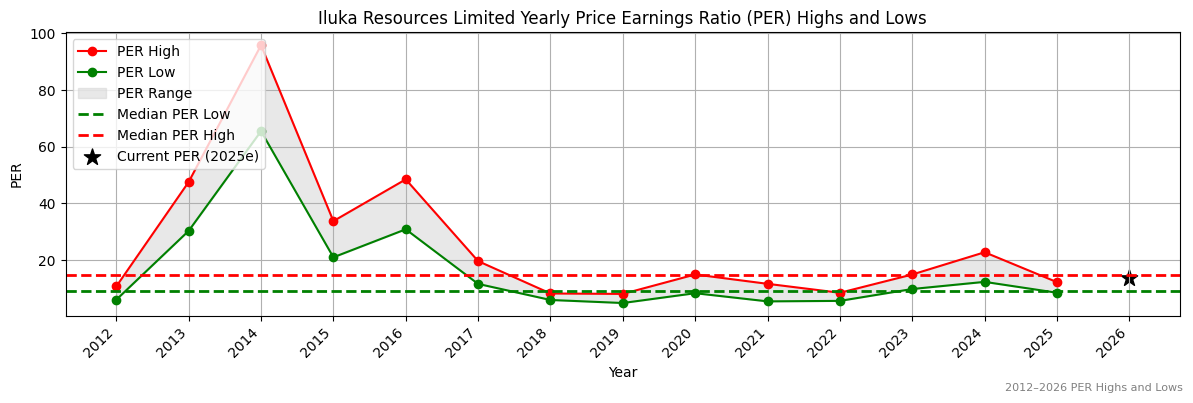
PER 2023 |
PER 2024 |
13Y Median PER Low |
PER 2025e |
13Y Median PER High |
PER 2026e |
Last Updated |
| 2.7 |
1.2 |
8.7 |
13.6 |
9.2 |
12.1 |
14.9 |
12.4 |
1/1/25 |
ILU Yearly Price Earnings Ratio (PER) Highs and Lows
✅
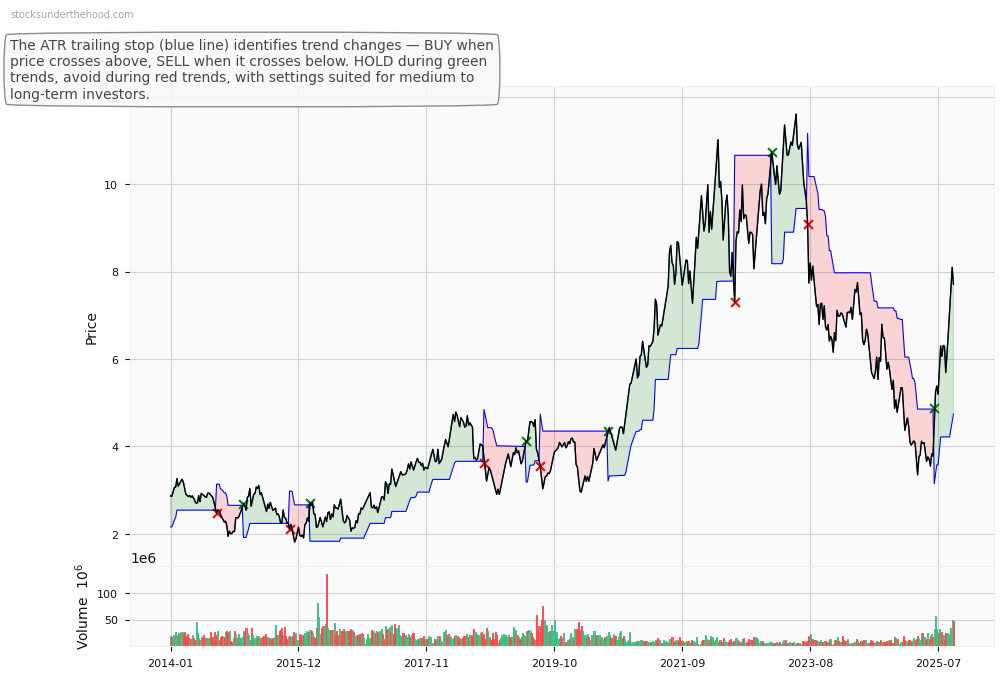
ILU Weekly Price Chart with Average True Range (ATR) Trailing Stop (10-Year View)
Ticker code: IIQ
IIQ Red Flags & Risk Indicators
❌
⚠️ RED FLAGS: 4 identified
- Increasing Shorts
- Zero Revenue
- Falling Earnings
- Falling EBITDA Margins
Income Statement
| Revenue 2024 Per Share |
Revenue 2025e Per Share |
Revenue 2026e Per Share |
Revenue 24 to 25e [%] |
Revenue 25e to 26e [%] |
EBITDA 2024 Per Share |
EBITDA 2025e Per Share |
EBITDA 2026e Per Share |
EBITDA 24 to 25e [%] |
EBITDA 25e to 26e [%] |
| None |
0.01474 |
0.05909 |
None |
300.9 |
-0.05071 |
-0.07079 |
-0.03315 |
-39.6 |
53.2 |
IIQ Revenue Per Share (2012–2027)
IIQ Earnings before Interest, Tax, Depreciation and Amortisation (EBITDA) Per Share (2012–2027)
❌
IIQ Normalised Earnings Per Share (EPS) (2012–2027)
Valuation
| Price To Sales |
Price To Book |
PER 2023 |
PER 2024 |
13Y Median PER Low |
PER 2025e |
13Y Median PER High |
PER 2026e |
Last Updated |
| 26.8 |
2.3 |
None |
None |
None |
-4.5 |
None |
None |
27/11/24 |
IIQ Yearly Price Earnings Ratio (PER) Highs and Lows
IIQ Weekly Price Chart with Average True Range (ATR) Trailing Stop (10-Year View)
Ticker code: IGO
IGO Red Flags & Risk Indicators
❌
⚠️ RED FLAGS: 3 identified
- Negative Operating Cash Flow
- Falling Earnings
- Falling Revenues
Income Statement
| Revenue 2024 Per Share |
Revenue 2025e Per Share |
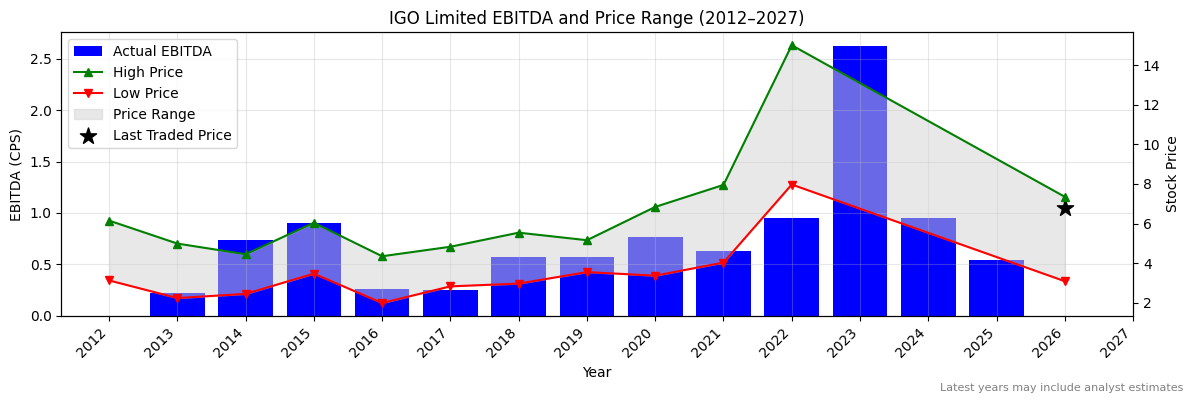
Revenue 2026e Per Share |
Revenue 24 to 25e [%] |
Revenue 25e to 26e [%] |
EBITDA 2024 Per Share |
EBITDA 2025e Per Share |
EBITDA 2026e Per Share |
EBITDA 24 to 25e [%] |
EBITDA 25e to 26e [%] |
| 1.0716 |
None |
None |
None |
None |
0.94884 |
0.54598 |
None |
-42.5 |
None |
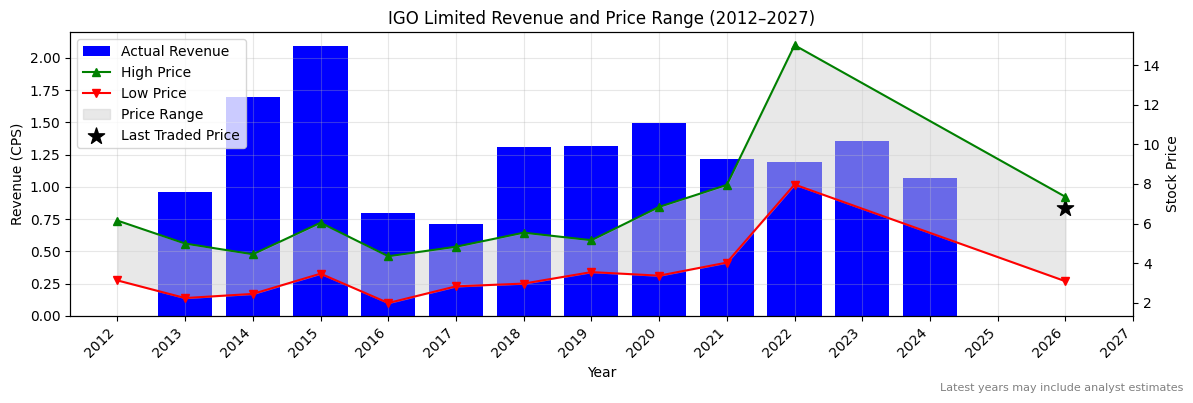
IGO Revenue Per Share (2012–2027)
IGO Earnings before Interest, Tax, Depreciation and Amortisation (EBITDA) Per Share (2012–2027)
❌
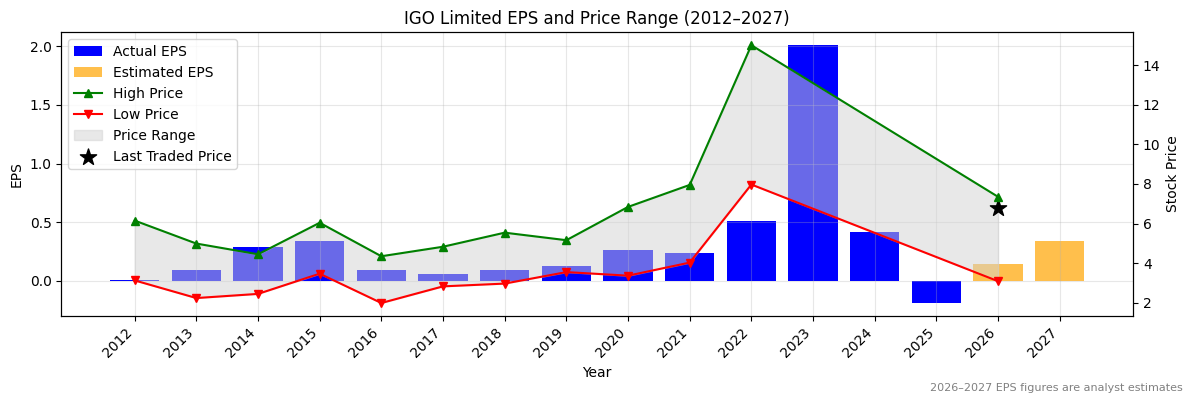
IGO Normalised Earnings Per Share (EPS) (2012–2027)
❌
Valuation
| Price To Sales |
Price To Book |
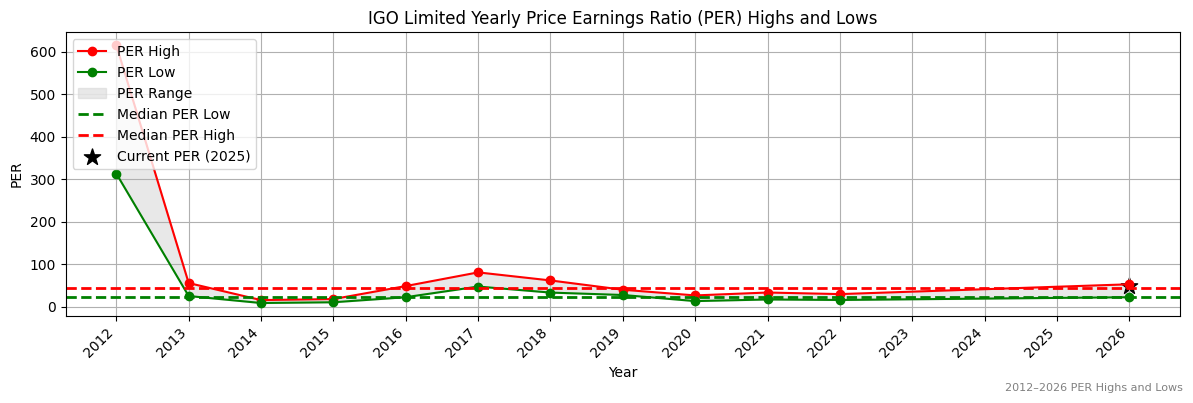
PER 2023 |
PER 2024 |
13Y Median PER Low |
PER 2025e |
13Y Median PER High |
PER 2026e |
Last Updated |
| 7.7 |
1.9 |
2.7 |
12.8 |
22.1 |
-28.3 |
41.0 |
38.4 |
6/7/24 |
IGO Yearly Price Earnings Ratio (PER) Highs and Lows
✅✅
IGO Weekly Price Chart with Average True Range (ATR) Trailing Stop (10-Year View)
Ticker code: IGL
IGL Red Flags & Risk Indicators
⚠️
⚠️ RED FLAGS: 2 identified
- Increasing Shorts
- More Net Debt Than Equity
Income Statement
| Revenue 2024 Per Share |
Revenue 2025e Per Share |
Revenue 2026e Per Share |
Revenue 24 to 25e [%] |
Revenue 25e to 26e [%] |
EBITDA 2024 Per Share |
EBITDA 2025e Per Share |
EBITDA 2026e Per Share |
EBITDA 24 to 25e [%] |
EBITDA 25e to 26e [%] |
| 6.31688 |
6.31136 |
6.448 |
-0.1 |
2.2 |
0.82987 |
0.89436 |
0.91074 |
7.8 |
1.8 |
IGL Revenue Per Share (2012–2027)
❌
IGL Earnings before Interest, Tax, Depreciation and Amortisation (EBITDA) Per Share (2012–2027)
✅
IGL Normalised Earnings Per Share (EPS) (2012–2027)
✅
Valuation
| Price To Sales |
Price To Book |
PER 2023 |
PER 2024 |
13Y Median PER Low |
PER 2025e |
13Y Median PER High |
PER 2026e |
Last Updated |
| 0.4 |
2.0 |
10.6 |
9.9 |
6.5 |
8.4 |
9.4 |
7.9 |
8/7/25 |
IGL Yearly Price Earnings Ratio (PER) Highs and Lows
✅
IGL Weekly Price Chart with Average True Range (ATR) Trailing Stop (10-Year View)
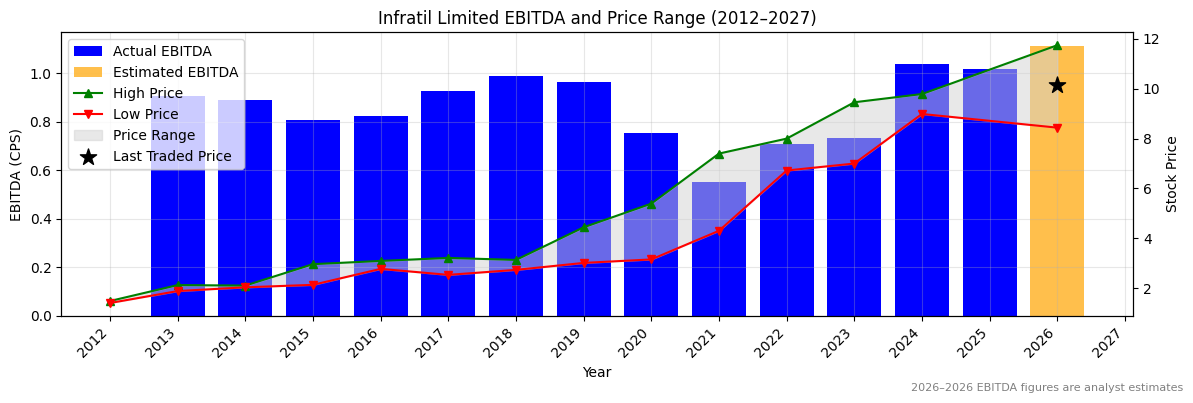
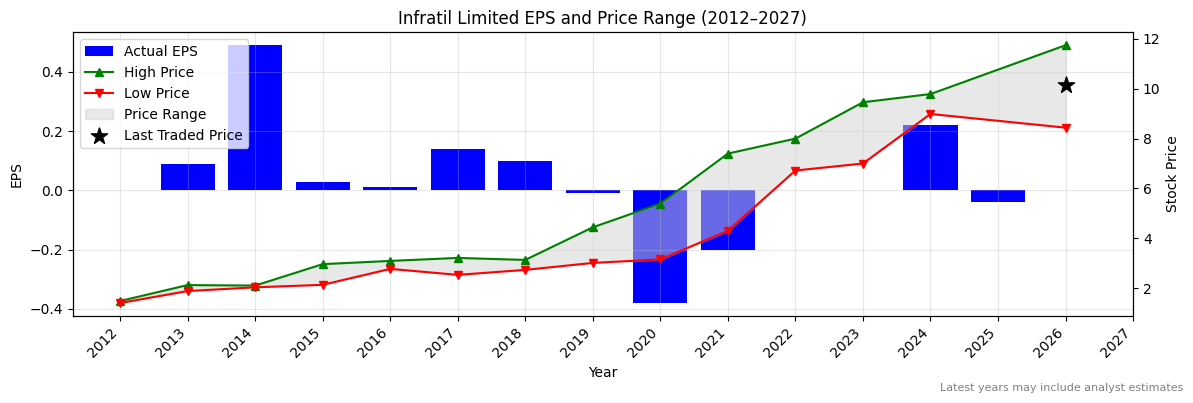
Ticker code: IFT
IFT Red Flags & Risk Indicators
❌
⚠️ RED FLAGS: 4 identified
- Falling Earnings
- Falling Revenues
- More Net Debt Than Equity
- High Relative Valuation
Income Statement
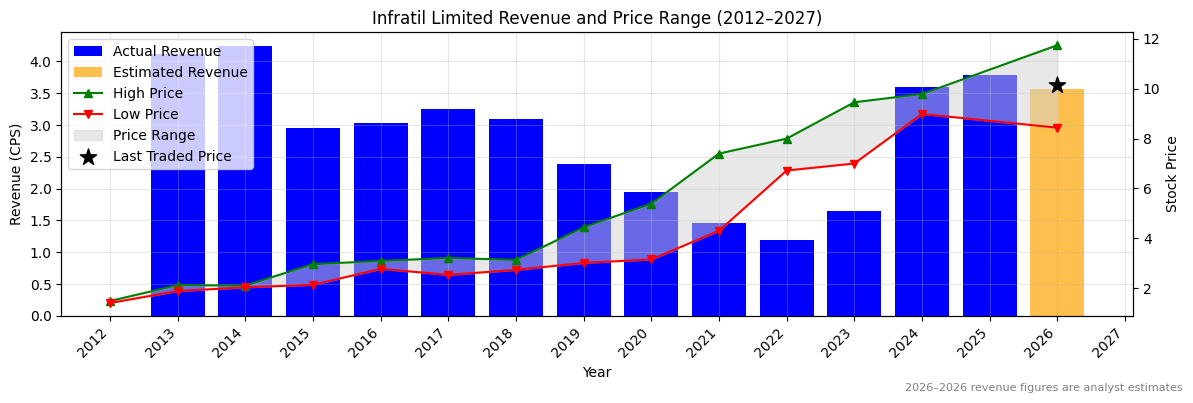
| Revenue 2024 Per Share |
Revenue 2025e Per Share |
Revenue 2026e Per Share |
Revenue 24 to 25e [%] |
Revenue 25e to 26e [%] |
EBITDA 2024 Per Share |
EBITDA 2025e Per Share |
EBITDA 2026e Per Share |
EBITDA 24 to 25e [%] |
EBITDA 25e to 26e [%] |
| 3.59753 |
3.77885 |
3.63836 |
5.0 |
-3.7 |
1.03783 |
1.01674 |
1.13725 |
-2.0 |
11.9 |
IFT Revenue Per Share (2012–2027)
✅
IFT Earnings before Interest, Tax, Depreciation and Amortisation (EBITDA) Per Share (2012–2027)
❌
IFT Normalised Earnings Per Share (EPS) (2012–2027)
Valuation
| Price To Sales |
Price To Book |
PER 2023 |
PER 2024 |
13Y Median PER Low |
PER 2025e |
13Y Median PER High |
PER 2026e |
Last Updated |
| 2.8 |
1.6 |
None |
None |
24.1 |
None |
27.4 |
None |
12/11/24 |
IFT Yearly Price Earnings Ratio (PER) Highs and Lows
IFT Weekly Price Chart with Average True Range (ATR) Trailing Stop (10-Year View)
Ticker code: IFM
IFM Red Flags & Risk Indicators
⚠️
⚠️ RED FLAGS: 1 identified
Income Statement
| Revenue 2024 Per Share |
Revenue 2025e Per Share |
Revenue 2026e Per Share |
Revenue 24 to 25e [%] |
Revenue 25e to 26e [%] |
EBITDA 2024 Per Share |
EBITDA 2025e Per Share |
EBITDA 2026e Per Share |
EBITDA 24 to 25e [%] |
EBITDA 25e to 26e [%] |
| 0.37475 |
0.38852 |
0.40685 |
3.7 |
4.7 |
0.14657 |
0.15338 |
0.15796 |
4.6 |
3.0 |
IFM Revenue Per Share (2012–2027)
✅
IFM Earnings before Interest, Tax, Depreciation and Amortisation (EBITDA) Per Share (2012–2027)
✅
IFM Normalised Earnings Per Share (EPS) (2012–2027)
❌
Valuation
| Price To Sales |
Price To Book |
PER 2023 |
PER 2024 |
13Y Median PER Low |
PER 2025e |
13Y Median PER High |
PER 2026e |
Last Updated |
| 4.4 |
4.4 |
42.1 |
28.1 |
18.5 |
28.1 |
31.3 |
24.1 |
11/10/25 |
IFM Yearly Price Earnings Ratio (PER) Highs and Lows
✅
IFM Weekly Price Chart with Average True Range (ATR) Trailing Stop (10-Year View)
Ticker code: IFL
IFL Red Flags & Risk Indicators
⚠️
⚠️ RED FLAGS: 1 identified
Income Statement
| Revenue 2024 Per Share |
Revenue 2025e Per Share |
Revenue 2026e Per Share |
Revenue 24 to 25e [%] |
Revenue 25e to 26e [%] |
EBITDA 2024 Per Share |
EBITDA 2025e Per Share |
EBITDA 2026e Per Share |
EBITDA 24 to 25e [%] |
EBITDA 25e to 26e [%] |
| 2.08534 |
2.09876 |
2.0682 |
0.6 |
-1.5 |
0.57089 |
0.67571 |
0.61731 |
18.4 |
-8.6 |
IFL Revenue Per Share (2012–2027)
✅
IFL Earnings before Interest, Tax, Depreciation and Amortisation (EBITDA) Per Share (2012–2027)
✅
IFL Normalised Earnings Per Share (EPS) (2012–2027)
✅
Valuation
| Price To Sales |
Price To Book |
PER 2023 |
PER 2024 |
13Y Median PER Low |
PER 2025e |
13Y Median PER High |
PER 2026e |
Last Updated |
| 1.9 |
1.5 |
15.1 |
13.8 |
11.0 |
11.9 |
15.4 |
12.6 |
17/9/25 |
IFL Yearly Price Earnings Ratio (PER) Highs and Lows
✅
IFL Weekly Price Chart with Average True Range (ATR) Trailing Stop (10-Year View)
Ticker code: IEL
IEL Red Flags & Risk Indicators
❌
⚠️ RED FLAGS: 4 identified
- Highly Shorted
- Falling Earnings
- Falling Revenues
- Falling EBITDA Margins
Income Statement
| Revenue 2024 Per Share |
Revenue 2025e Per Share |
Revenue 2026e Per Share |
Revenue 24 to 25e [%] |
Revenue 25e to 26e [%] |
EBITDA 2024 Per Share |
EBITDA 2025e Per Share |
EBITDA 2026e Per Share |
EBITDA 24 to 25e [%] |
EBITDA 25e to 26e [%] |
| 3.72661 |
3.16955 |
3.05519 |
-14.9 |
-3.6 |
1.05929 |
0.64731 |
0.61343 |
-38.9 |
-5.2 |
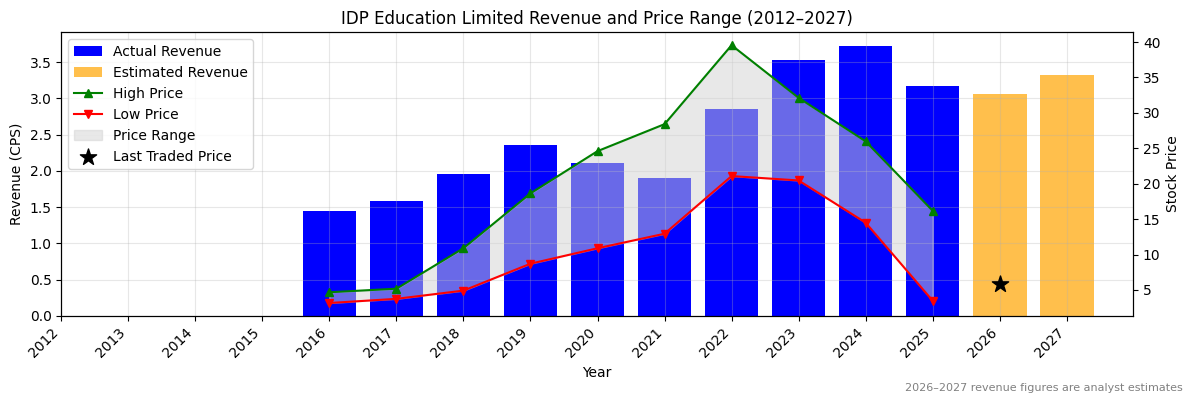
IEL Revenue Per Share (2012–2027)
❌
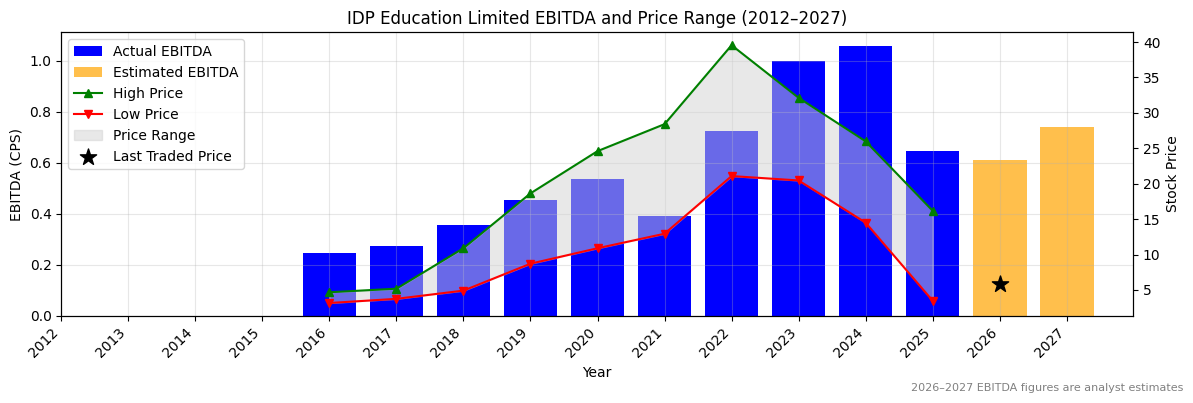
IEL Earnings before Interest, Tax, Depreciation and Amortisation (EBITDA) Per Share (2012–2027)
❌
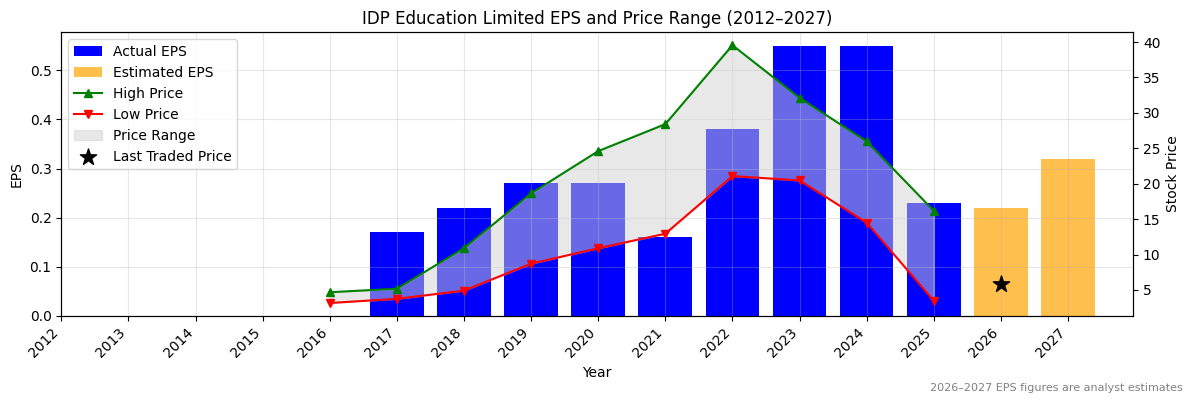
IEL Normalised Earnings Per Share (EPS) (2012–2027)
❌
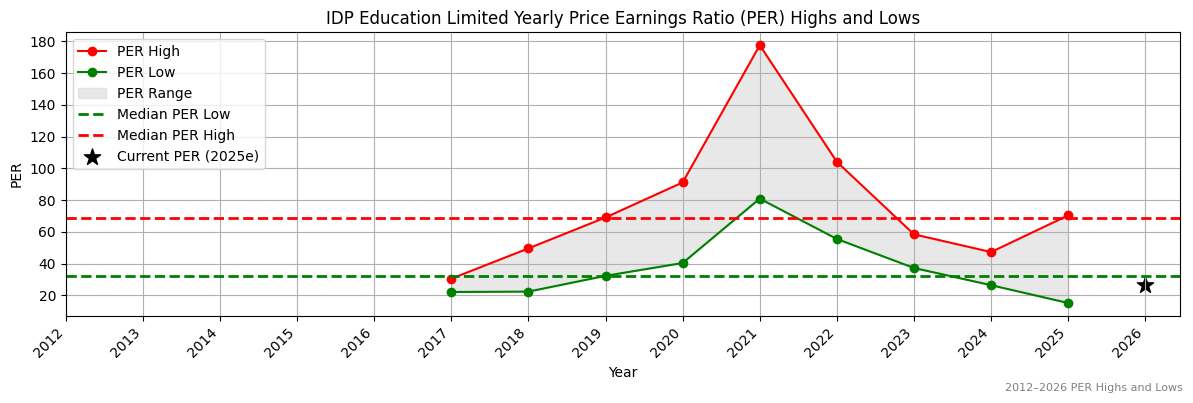
Valuation
| Price To Sales |
Price To Book |
PER 2023 |
PER 2024 |
13Y Median PER Low |
PER 2025e |
13Y Median PER High |
PER 2026e |
Last Updated |
| 1.8 |
2.9 |
10.2 |
10.2 |
32.3 |
24.4 |
69.0 |
25.5 |
6/10/25 |
IEL Yearly Price Earnings Ratio (PER) Highs and Lows
✅✅
IEL Weekly Price Chart with Average True Range (ATR) Trailing Stop (10-Year View)
Ticker code: IDX
IDX Red Flags & Risk Indicators
⚠️
⚠️ RED FLAGS: 1 identified
Income Statement
| Revenue 2024 Per Share |
Revenue 2025e Per Share |
Revenue 2026e Per Share |
Revenue 24 to 25e [%] |
Revenue 25e to 26e [%] |
EBITDA 2024 Per Share |
EBITDA 2025e Per Share |
EBITDA 2026e Per Share |
EBITDA 24 to 25e [%] |
EBITDA 25e to 26e [%] |
| 2.00811 |
1.69714 |
2.16514 |
-15.5 |
27.6 |
0.39119 |
0.33346 |
0.45921 |
-14.8 |
37.7 |
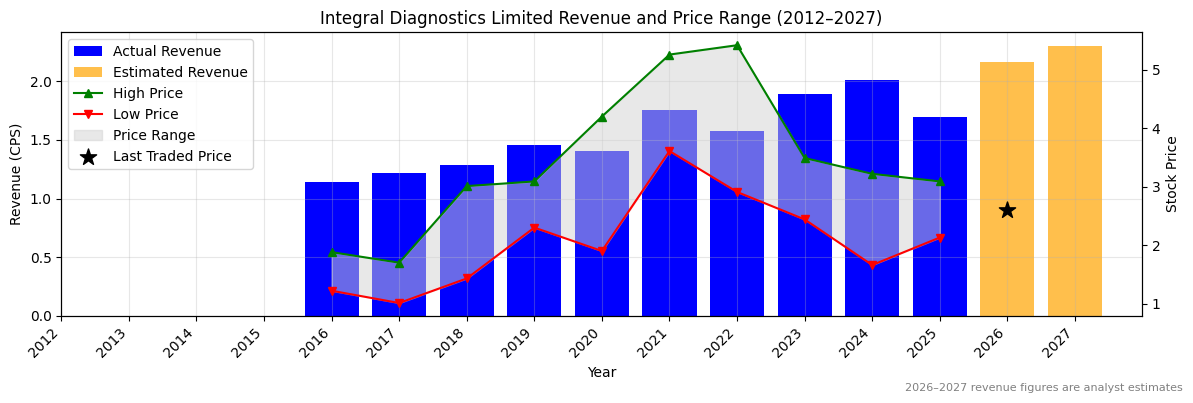
IDX Revenue Per Share (2012–2027)
❌
IDX Earnings before Interest, Tax, Depreciation and Amortisation (EBITDA) Per Share (2012–2027)
❌
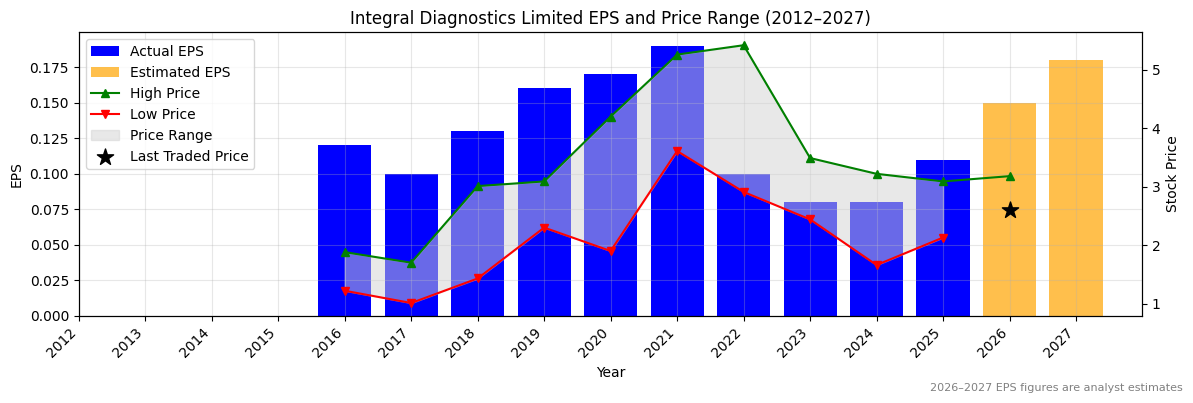
IDX Normalised Earnings Per Share (EPS) (2012–2027)
✅✅
Valuation
| Price To Sales |
Price To Book |
PER 2023 |
PER 2024 |
13Y Median PER Low |
PER 2025e |
13Y Median PER High |
PER 2026e |
Last Updated |
| 1.5 |
1.4 |
32.4 |
32.4 |
16.7 |
23.5 |
24.7 |
17.3 |
20/4/25 |
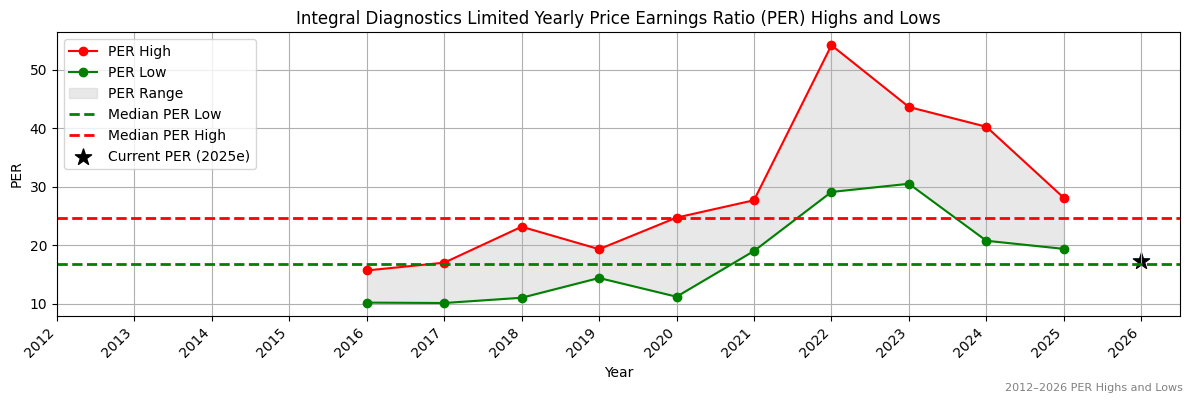
IDX Yearly Price Earnings Ratio (PER) Highs and Lows
✅
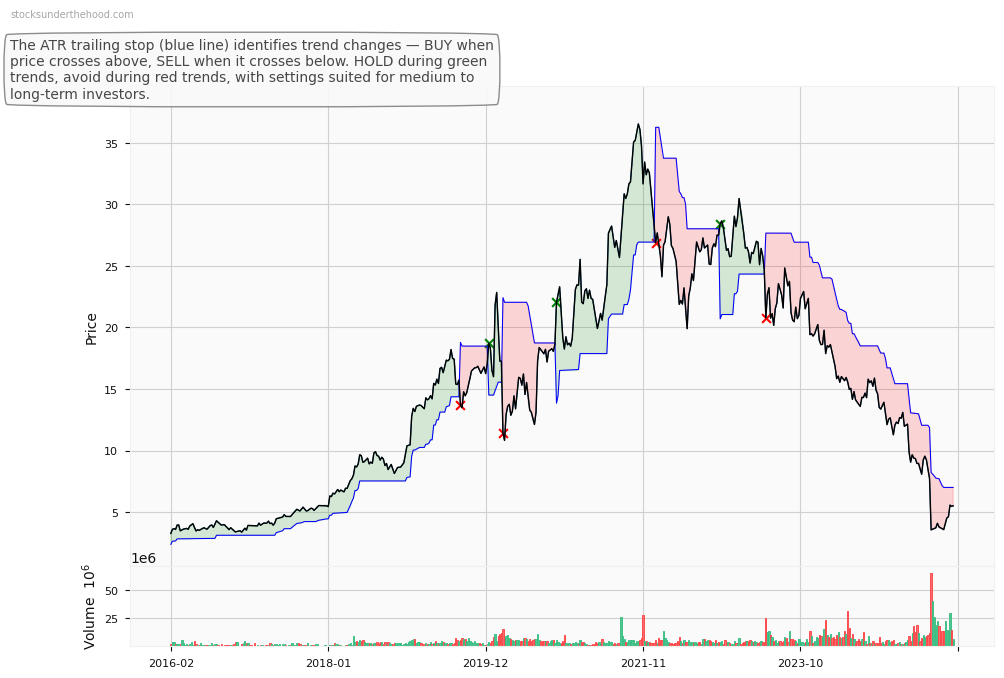
IDX Weekly Price Chart with Average True Range (ATR) Trailing Stop (10-Year View)