Ticker code: IAG
IAG Red Flags & Risk Indicators
✅
⚠️ RED FLAGS: 0 identified
No red flags detected.
Income Statement
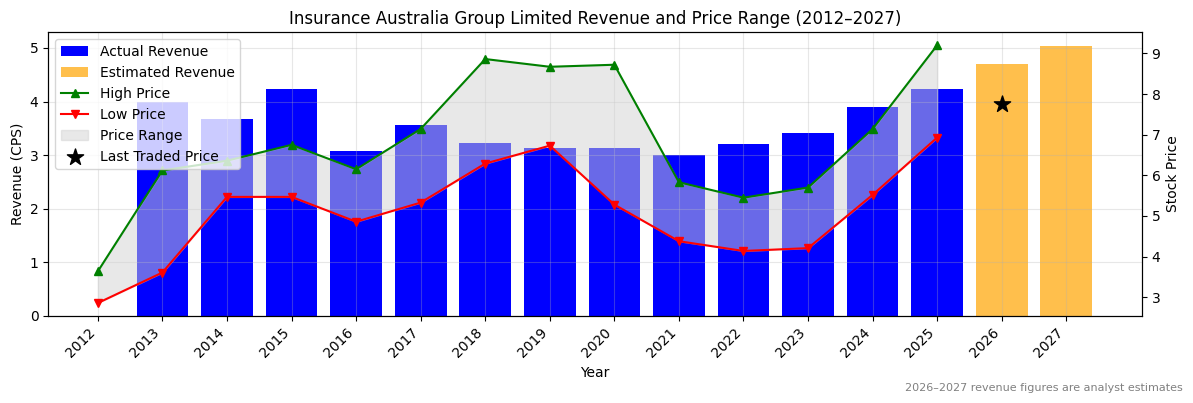
| Revenue 2024 Per Share |
Revenue 2025e Per Share |
Revenue 2026e Per Share |
Revenue 24 to 25e [%] |
Revenue 25e to 26e [%] |
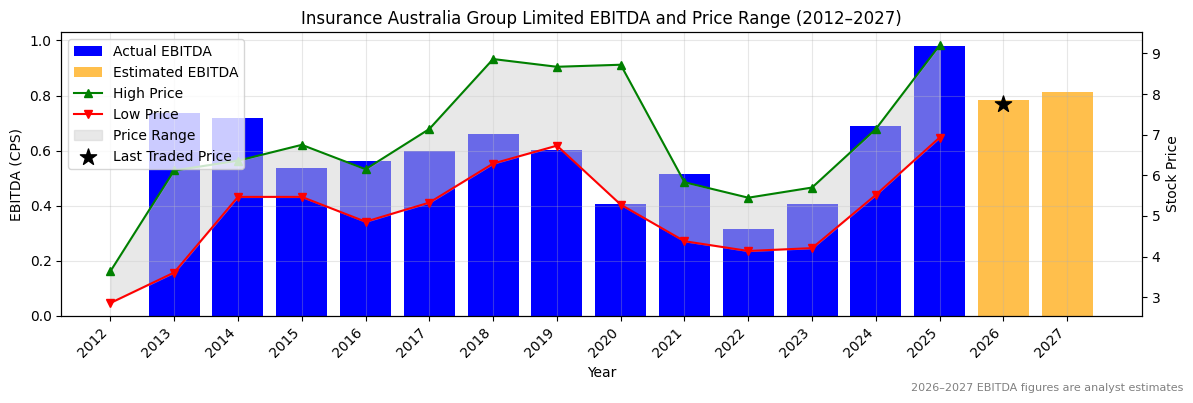
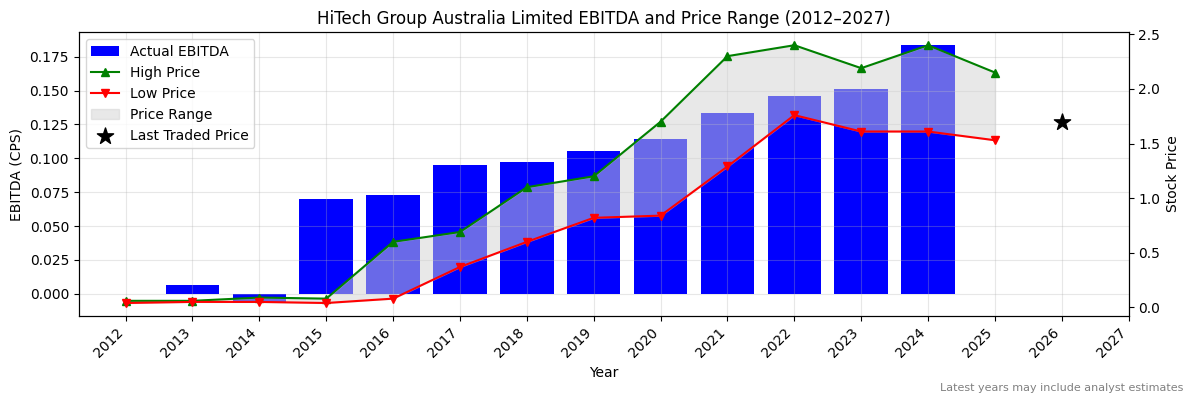
EBITDA 2024 Per Share |
EBITDA 2025e Per Share |
EBITDA 2026e Per Share |
EBITDA 24 to 25e [%] |
EBITDA 25e to 26e [%] |
| 3.90003 |
4.22658 |
4.69711 |
8.4 |
11.1 |
0.69107 |
0.98061 |
0.78381 |
41.9 |
-20.1 |
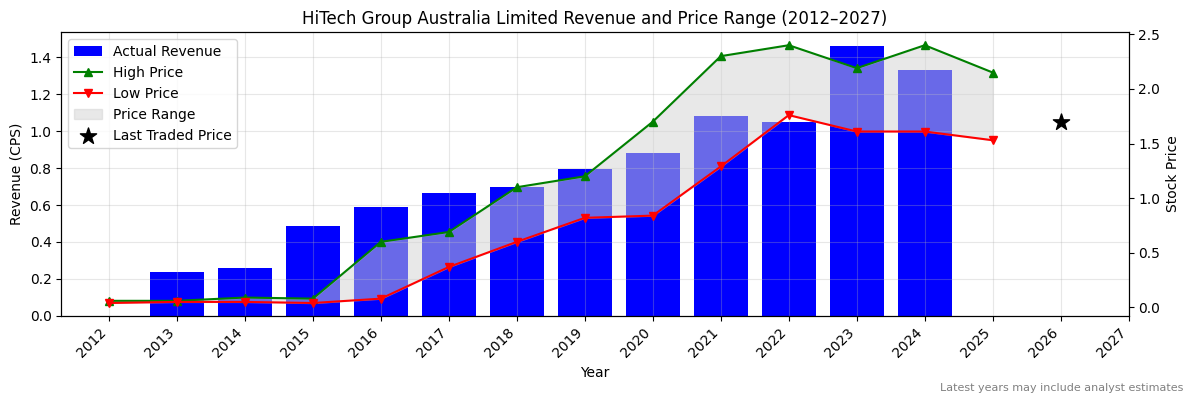
IAG Revenue Per Share (2012–2027)
✅
IAG Earnings before Interest, Tax, Depreciation and Amortisation (EBITDA) Per Share (2012–2027)
✅✅
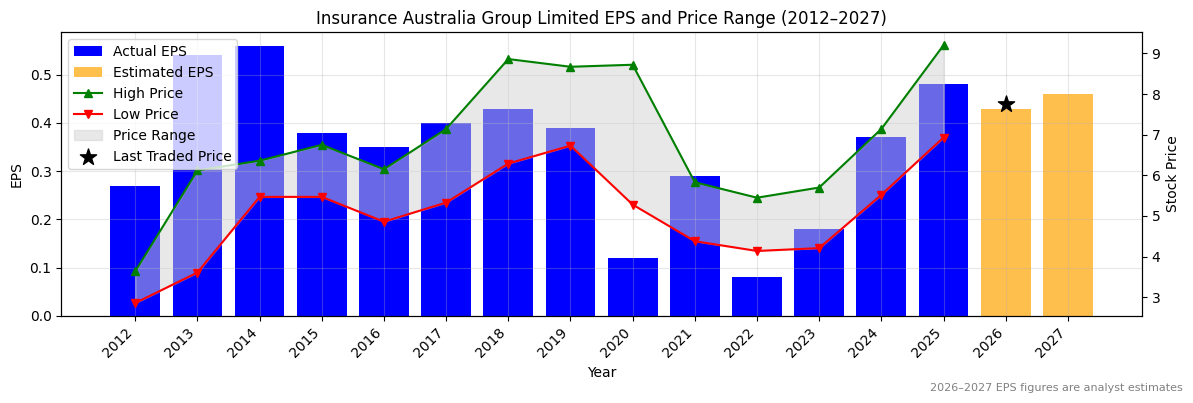
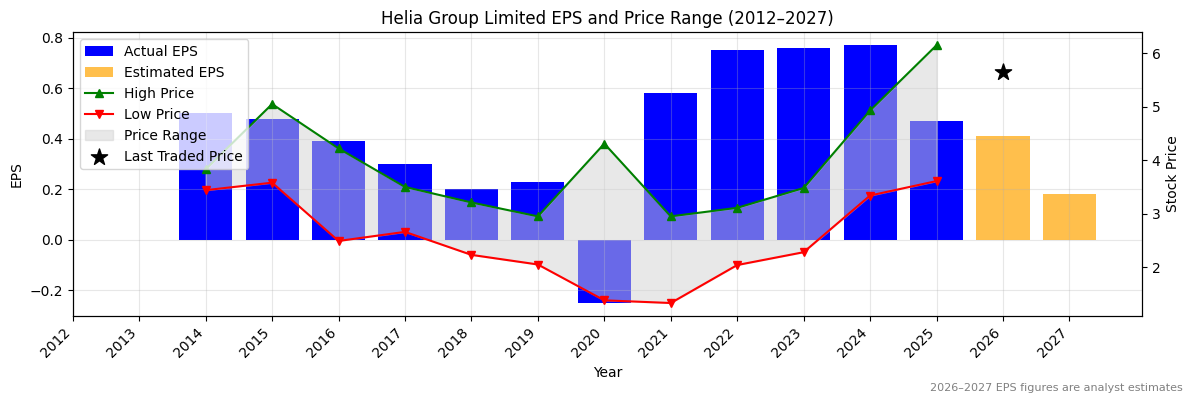
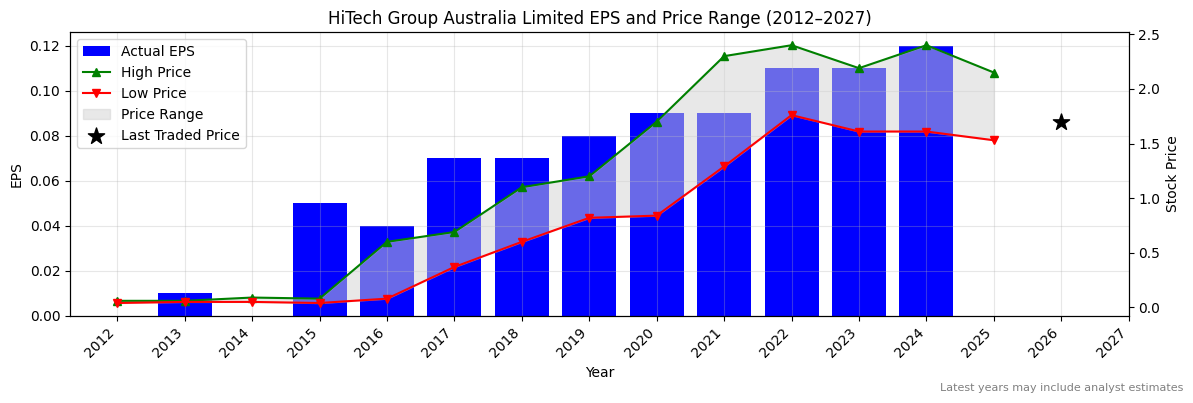
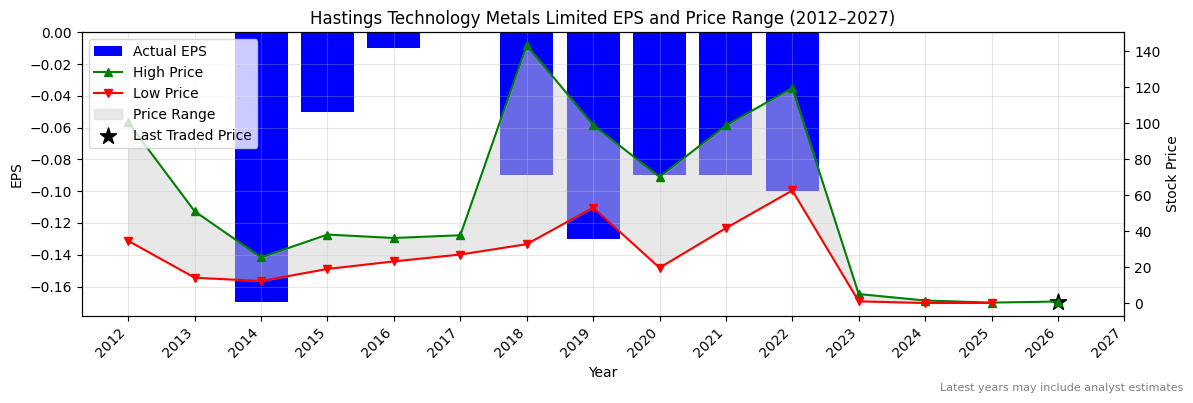
IAG Normalised Earnings Per Share (EPS) (2012–2027)
✅✅
Valuation
| Price To Sales |
Price To Book |
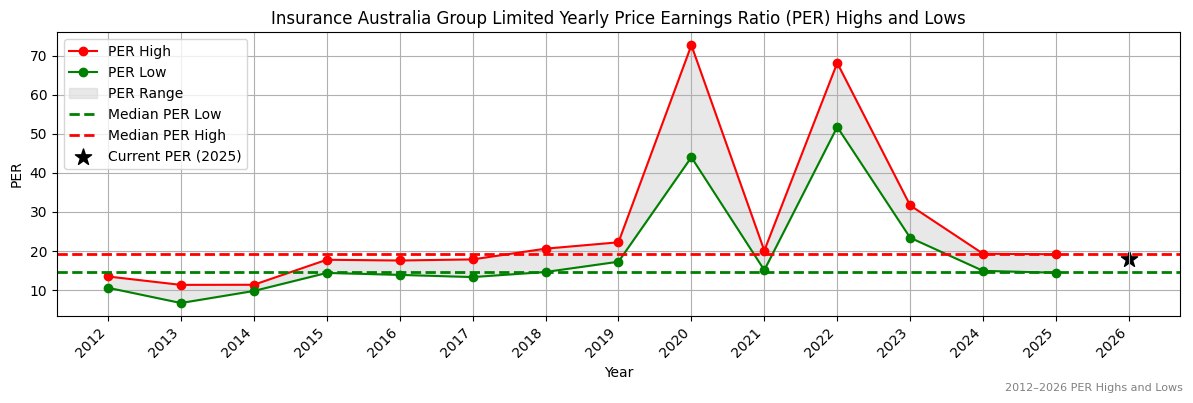
PER 2023 |
PER 2024 |
13Y Median PER Low |
PER 2025e |
13Y Median PER High |
PER 2026e |
Last Updated |
| 1.1 |
2.5 |
43.7 |
21.2 |
14.5 |
16.4 |
19.2 |
18.3 |
16/10/25 |
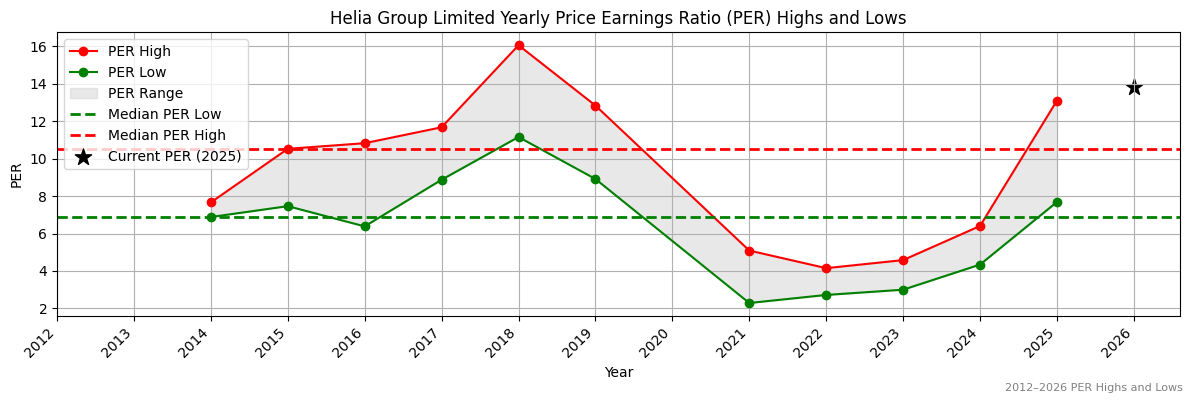
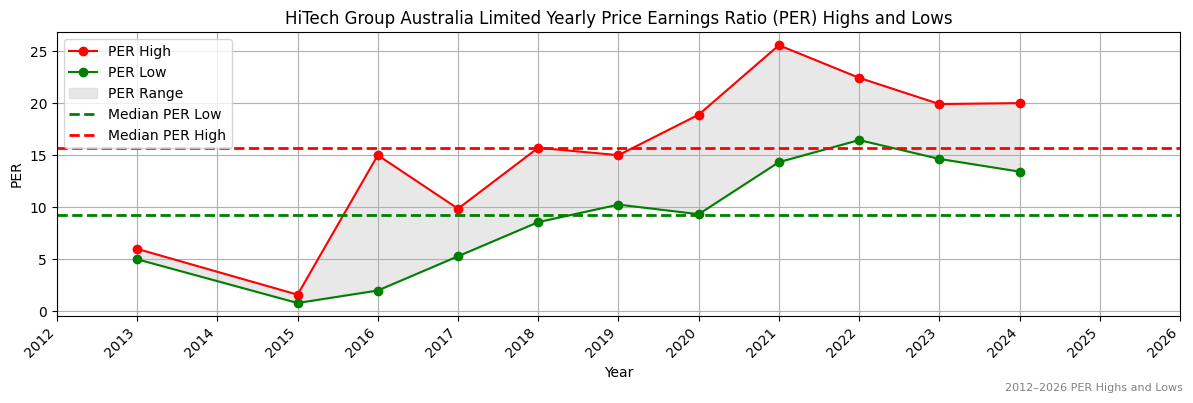
IAG Yearly Price Earnings Ratio (PER) Highs and Lows
✅
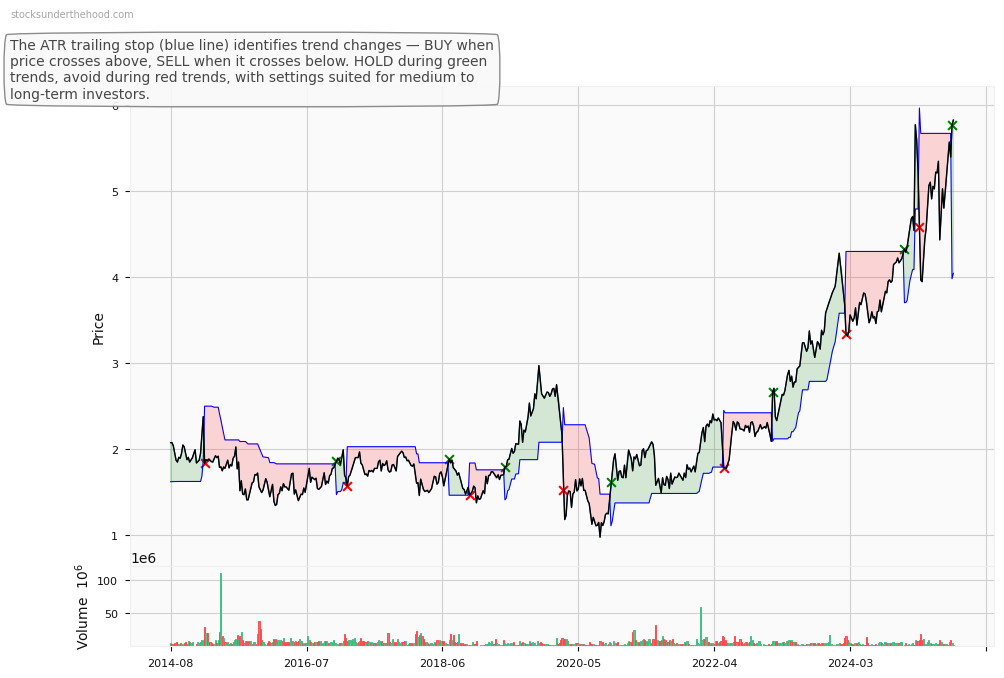
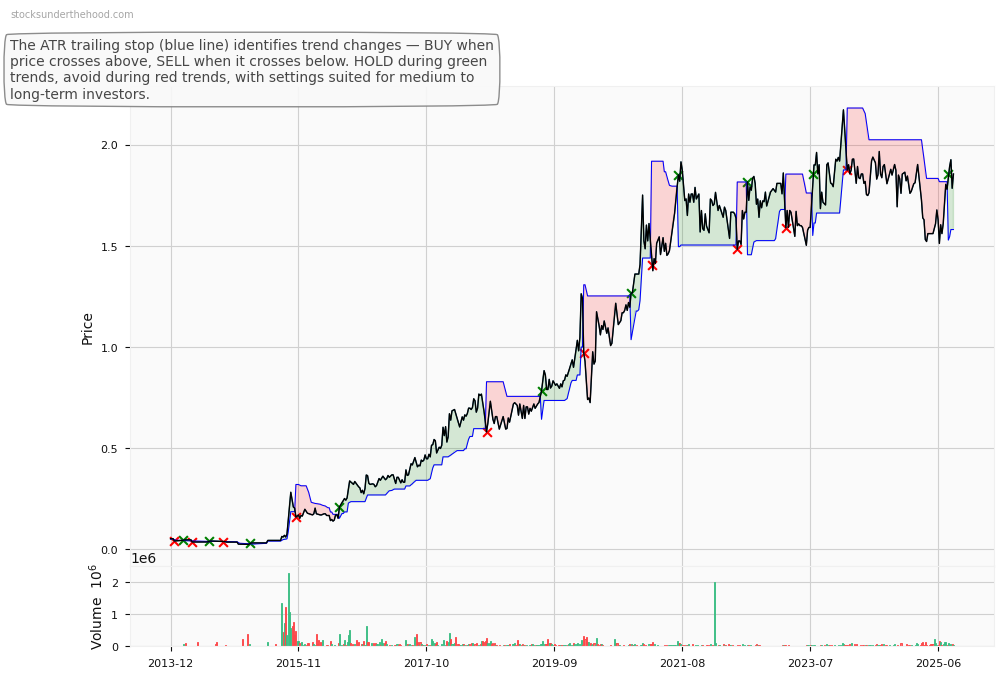
IAG Weekly Price Chart with Average True Range (ATR) Trailing Stop (10-Year View)
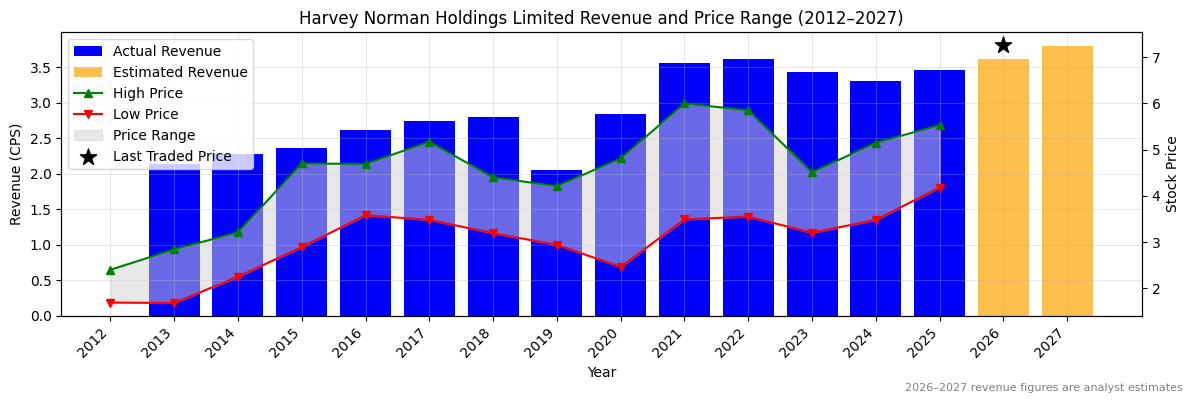
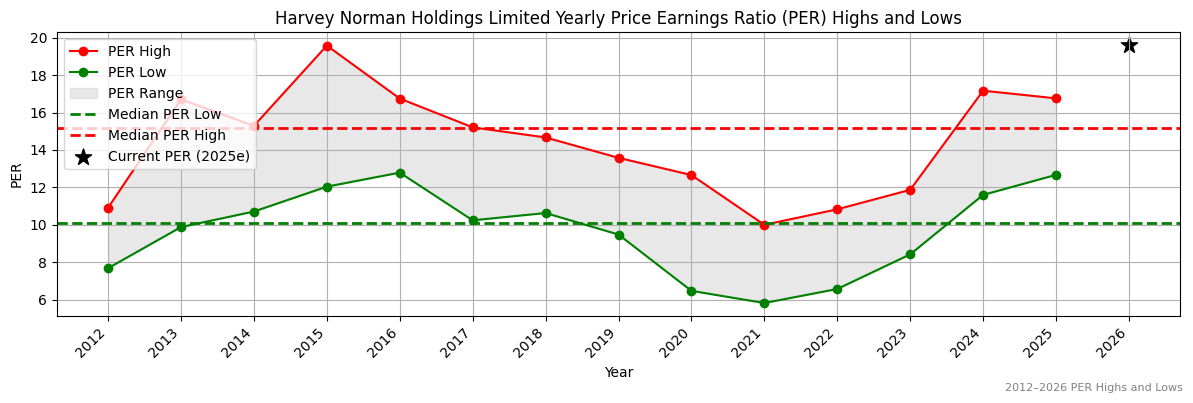
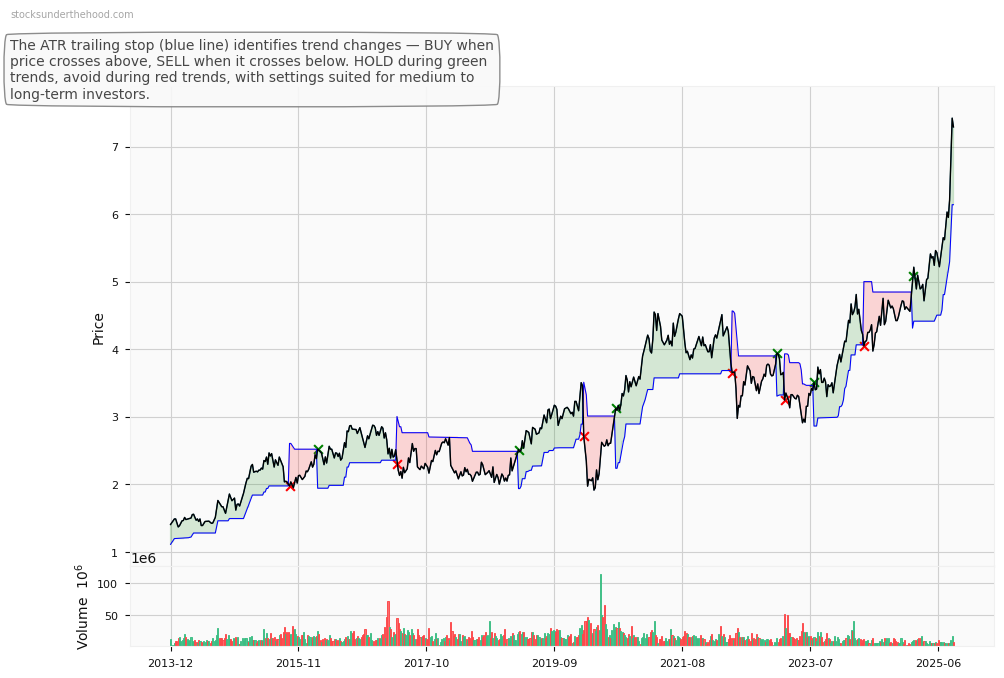
Ticker code: HVN
HVN Red Flags & Risk Indicators
⚠️
⚠️ RED FLAGS: 2 identified
- Falling Earnings
- High Relative Valuation
Income Statement
| Revenue 2024 Per Share |
Revenue 2025e Per Share |
Revenue 2026e Per Share |
Revenue 24 to 25e [%] |
Revenue 25e to 26e [%] |
EBITDA 2024 Per Share |
EBITDA 2025e Per Share |
EBITDA 2026e Per Share |
EBITDA 24 to 25e [%] |
EBITDA 25e to 26e [%] |
| 3.29855 |
3.45223 |
3.61083 |
4.7 |
4.6 |
0.72091 |
0.77742 |
0.81394 |
7.8 |
4.7 |
HVN Revenue Per Share (2012–2027)
✅
HVN Earnings before Interest, Tax, Depreciation and Amortisation (EBITDA) Per Share (2012–2027)
✅
HVN Normalised Earnings Per Share (EPS) (2012–2027)
✅
Valuation
| Price To Sales |
Price To Book |
PER 2023 |
PER 2024 |
13Y Median PER Low |
PER 2025e |
13Y Median PER High |
PER 2026e |
Last Updated |
| 3.1 |
1.9 |
19.0 |
24.1 |
10.1 |
21.9 |
15.2 |
19.5 |
14/6/25 |
HVN Yearly Price Earnings Ratio (PER) Highs and Lows
❌
HVN Weekly Price Chart with Average True Range (ATR) Trailing Stop (10-Year View)
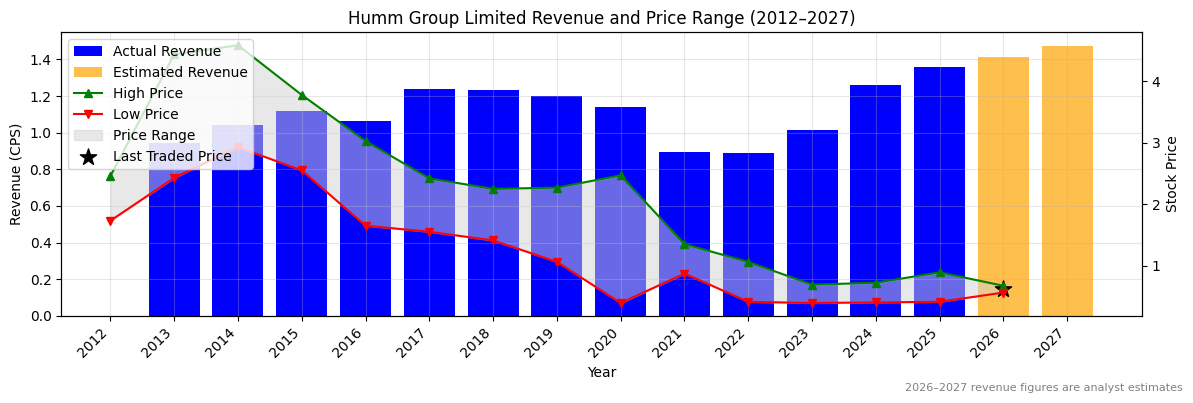
Ticker code: HUM
HUM Red Flags & Risk Indicators
❌
⚠️ RED FLAGS: 3 identified
- Low Operating Margin
- Falling Earnings
- More Net Debt Than Equity
Income Statement
| Revenue 2024 Per Share |
Revenue 2025e Per Share |
Revenue 2026e Per Share |
Revenue 24 to 25e [%] |
Revenue 25e to 26e [%] |
EBITDA 2024 Per Share |
EBITDA 2025e Per Share |
EBITDA 2026e Per Share |
EBITDA 24 to 25e [%] |
EBITDA 25e to 26e [%] |
| 1.25874 |
1.35831 |
1.41173 |
7.9 |
3.9 |
0.0689 |
0.15549 |
0.15374 |
125.7 |
-1.1 |
HUM Revenue Per Share (2012–2027)
✅
HUM Earnings before Interest, Tax, Depreciation and Amortisation (EBITDA) Per Share (2012–2027)
✅✅
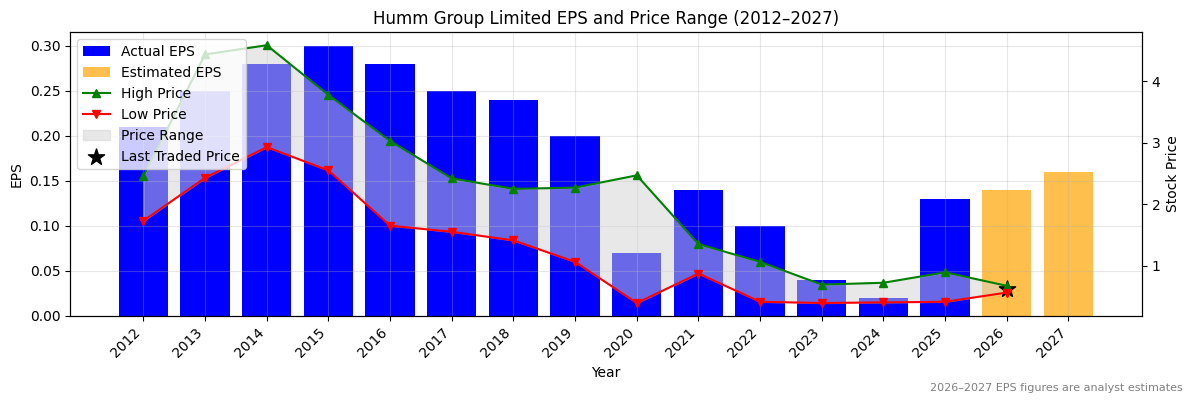
HUM Normalised Earnings Per Share (EPS) (2012–2027)
✅✅
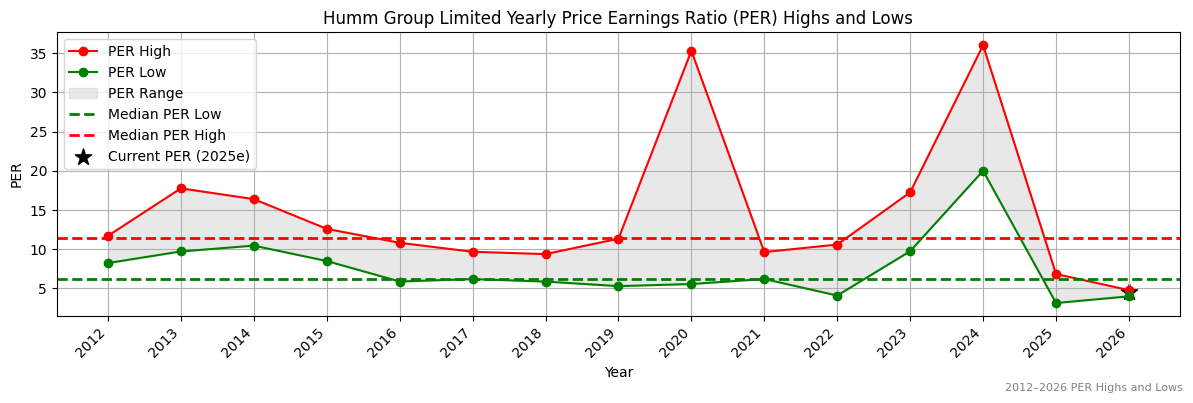
Valuation
| Price To Sales |
Price To Book |
PER 2023 |
PER 2024 |
13Y Median PER Low |
PER 2025e |
13Y Median PER High |
PER 2026e |
Last Updated |
| 1.1 |
0.6 |
15.1 |
30.3 |
6.2 |
4.7 |
11.4 |
4.3 |
4/10/25 |
HUM Yearly Price Earnings Ratio (PER) Highs and Lows
✅✅
HUM Weekly Price Chart with Average True Range (ATR) Trailing Stop (10-Year View)
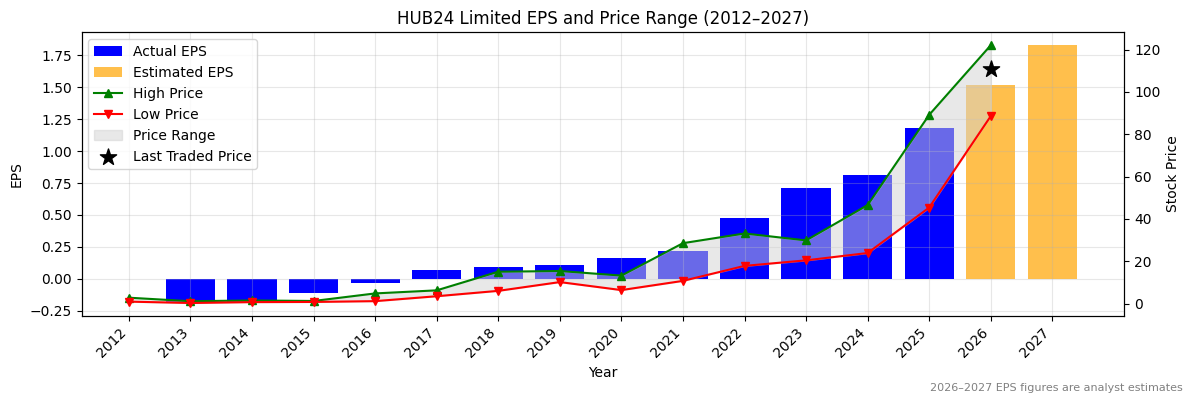
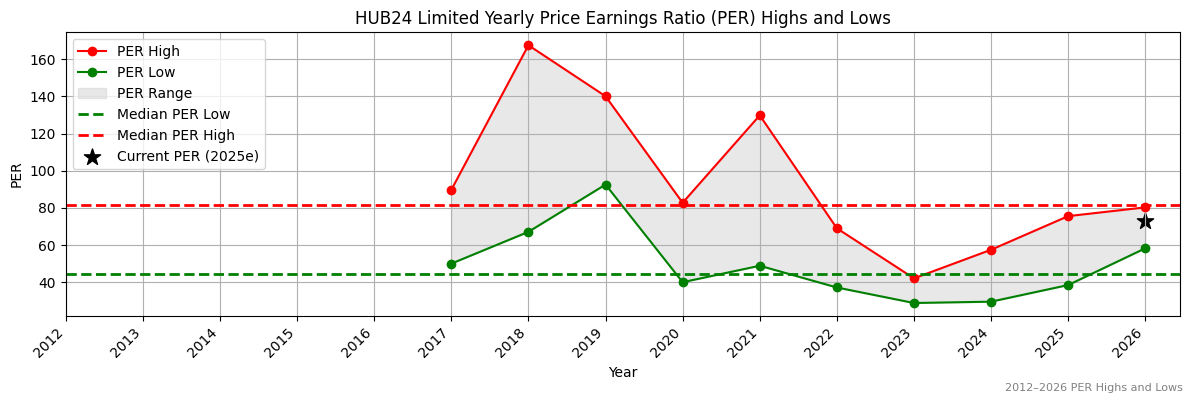
Ticker code: HUB
HUB Red Flags & Risk Indicators
✅
⚠️ RED FLAGS: 0 identified
No red flags detected.
Income Statement
| Revenue 2024 Per Share |
Revenue 2025e Per Share |
Revenue 2026e Per Share |
Revenue 24 to 25e [%] |
Revenue 25e to 26e [%] |
EBITDA 2024 Per Share |
EBITDA 2025e Per Share |
EBITDA 2026e Per Share |
EBITDA 24 to 25e [%] |
EBITDA 25e to 26e [%] |
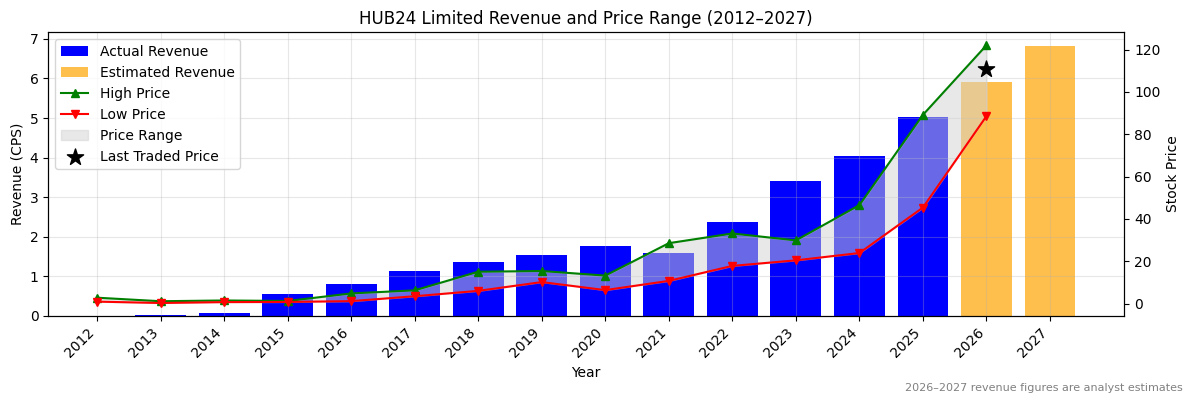
| 4.04074 |
5.02907 |
5.91823 |
24.5 |
17.7 |
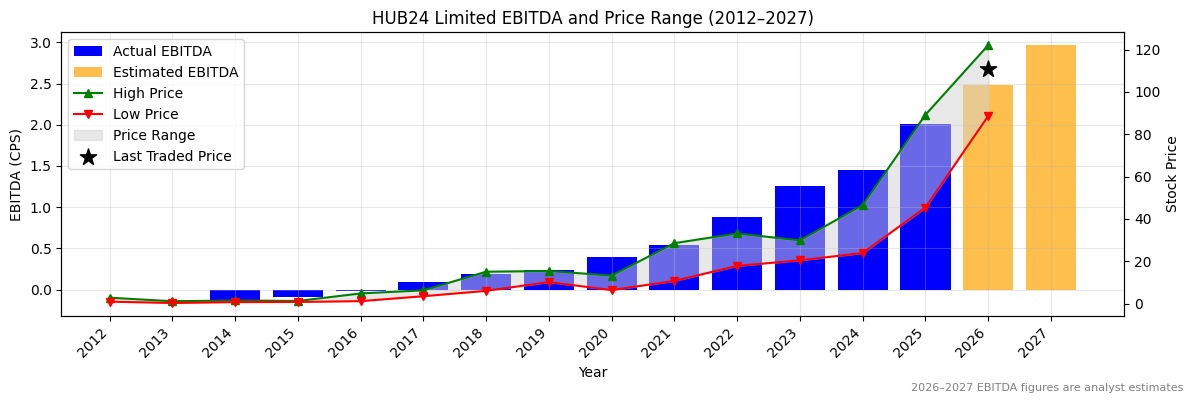
1.45679 |
2.01239 |
2.47854 |
38.1 |
23.2 |
HUB Revenue Per Share (2012–2027)
✅✅
HUB Earnings before Interest, Tax, Depreciation and Amortisation (EBITDA) Per Share (2012–2027)
✅✅
HUB Normalised Earnings Per Share (EPS) (2012–2027)
✅✅
Valuation
| Price To Sales |
Price To Book |
PER 2023 |
PER 2024 |
13Y Median PER Low |
PER 2025e |
13Y Median PER High |
PER 2026e |
Last Updated |
| 23.2 |
17.4 |
160.8 |
140.9 |
44.4 |
96.7 |
81.5 |
75.1 |
20/9/25 |
HUB Yearly Price Earnings Ratio (PER) Highs and Lows
❌
HUB Weekly Price Chart with Average True Range (ATR) Trailing Stop (10-Year View)
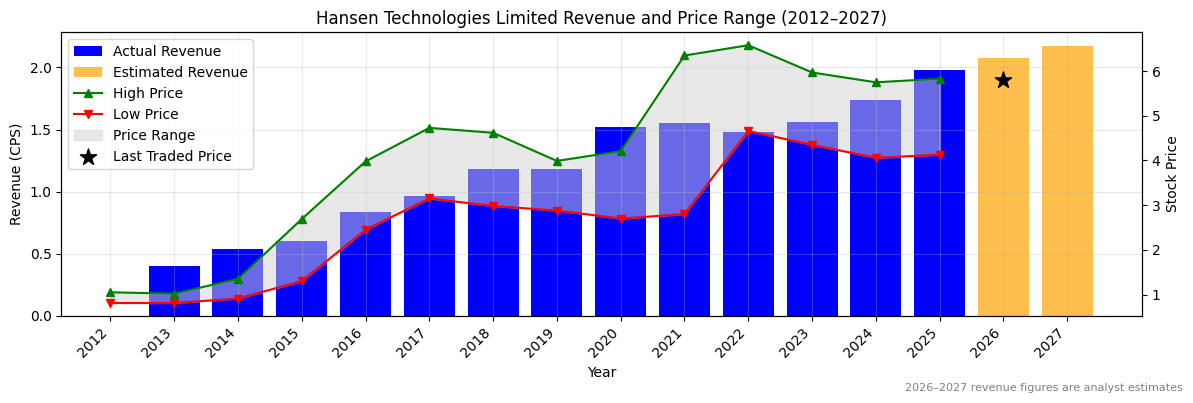
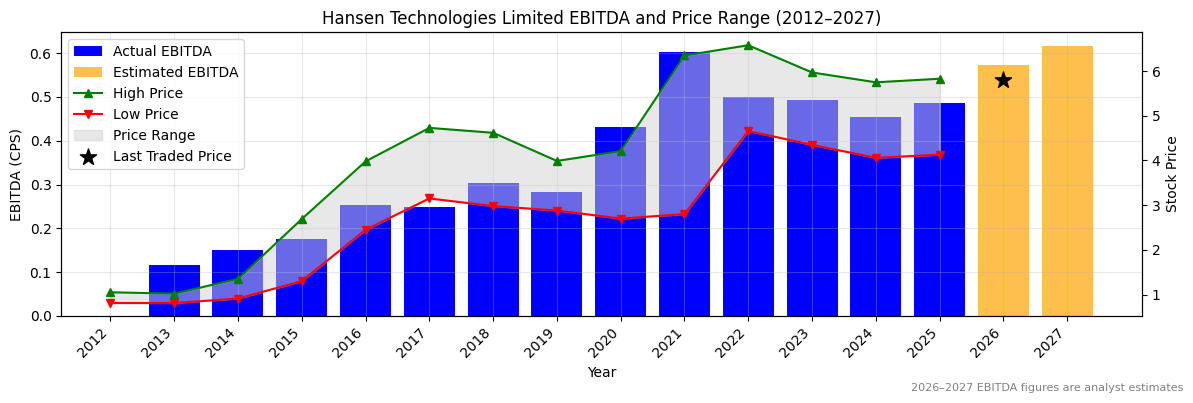
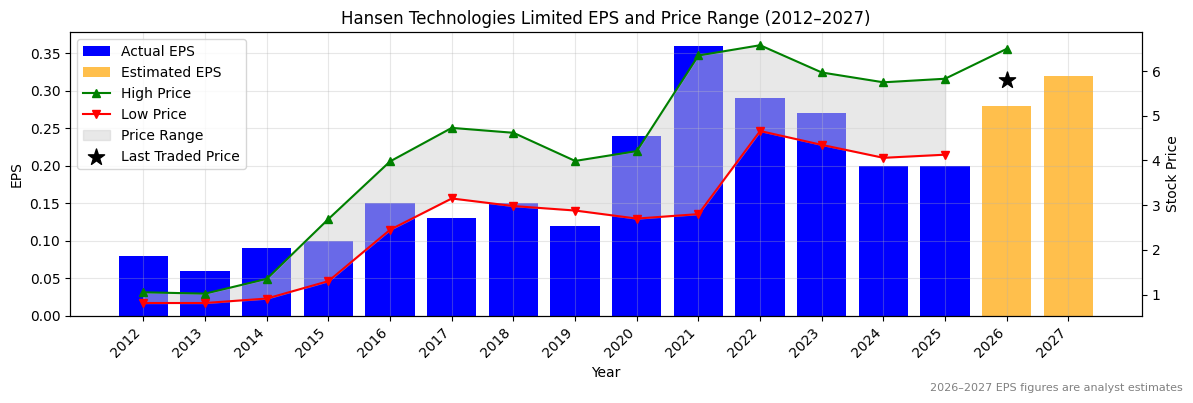
Ticker code: HSN
HSN Red Flags & Risk Indicators
❌
⚠️ RED FLAGS: 3 identified
- Increasing Shorts
- Falling Earnings
- Falling EBITDA Margins
Income Statement
| Revenue 2024 Per Share |
Revenue 2025e Per Share |
Revenue 2026e Per Share |
Revenue 24 to 25e [%] |
Revenue 25e to 26e [%] |
EBITDA 2024 Per Share |
EBITDA 2025e Per Share |
EBITDA 2026e Per Share |
EBITDA 24 to 25e [%] |
EBITDA 25e to 26e [%] |
| 1.7386 |
1.97632 |
2.07849 |
13.7 |
5.2 |
0.45485 |
0.48582 |
0.57231 |
6.8 |
17.8 |
HSN Revenue Per Share (2012–2027)
✅
HSN Earnings before Interest, Tax, Depreciation and Amortisation (EBITDA) Per Share (2012–2027)
✅
HSN Normalised Earnings Per Share (EPS) (2012–2027)
❌
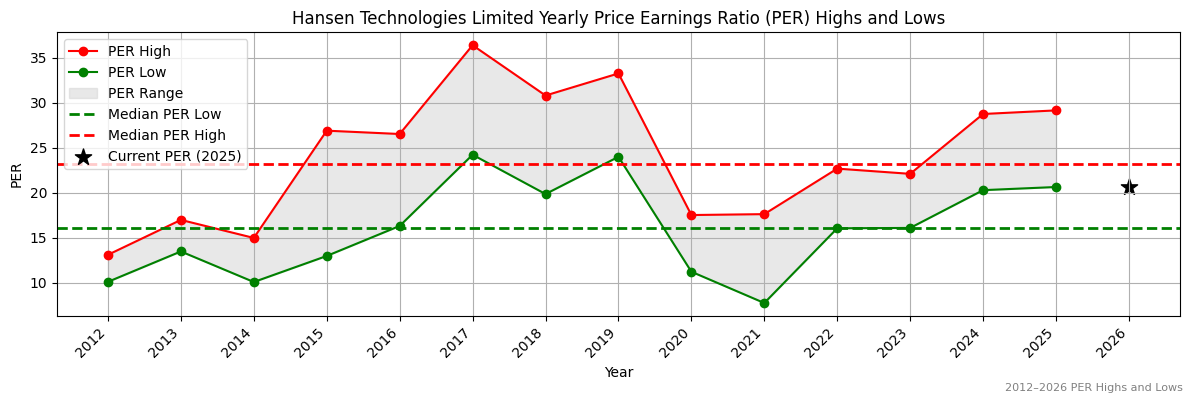
Valuation
| Price To Sales |
Price To Book |
PER 2023 |
PER 2024 |
13Y Median PER Low |
PER 2025e |
13Y Median PER High |
PER 2026e |
Last Updated |
| 2.9 |
3.0 |
20.7 |
27.9 |
16.1 |
27.9 |
23.2 |
19.9 |
24/4/25 |
HSN Yearly Price Earnings Ratio (PER) Highs and Lows
❌
HSN Weekly Price Chart with Average True Range (ATR) Trailing Stop (10-Year View)
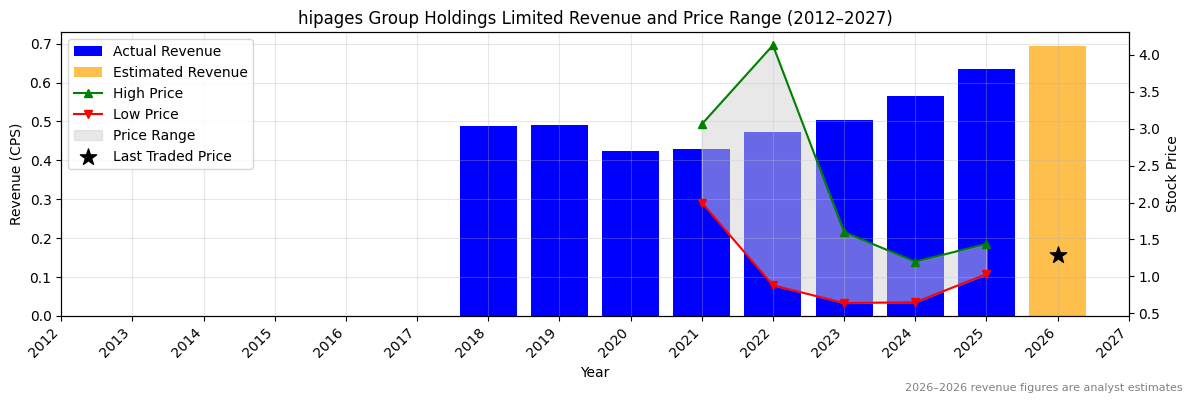
Ticker code: HPG
HPG Red Flags & Risk Indicators
⚠️
⚠️ RED FLAGS: 1 identified
Income Statement
| Revenue 2024 Per Share |
Revenue 2025e Per Share |
Revenue 2026e Per Share |
Revenue 24 to 25e [%] |
Revenue 25e to 26e [%] |
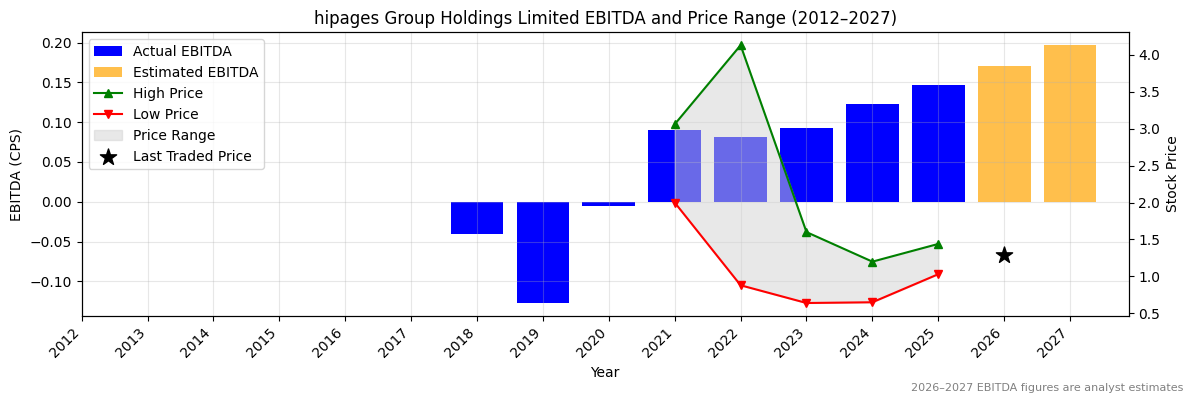
EBITDA 2024 Per Share |
EBITDA 2025e Per Share |
EBITDA 2026e Per Share |
EBITDA 24 to 25e [%] |
EBITDA 25e to 26e [%] |
| 0.56575 |
0.63515 |
0.6945 |
12.3 |
9.3 |
0.12231 |
0.14649 |
0.17005 |
19.8 |
16.1 |
HPG Revenue Per Share (2012–2027)
✅
HPG Earnings before Interest, Tax, Depreciation and Amortisation (EBITDA) Per Share (2012–2027)
✅
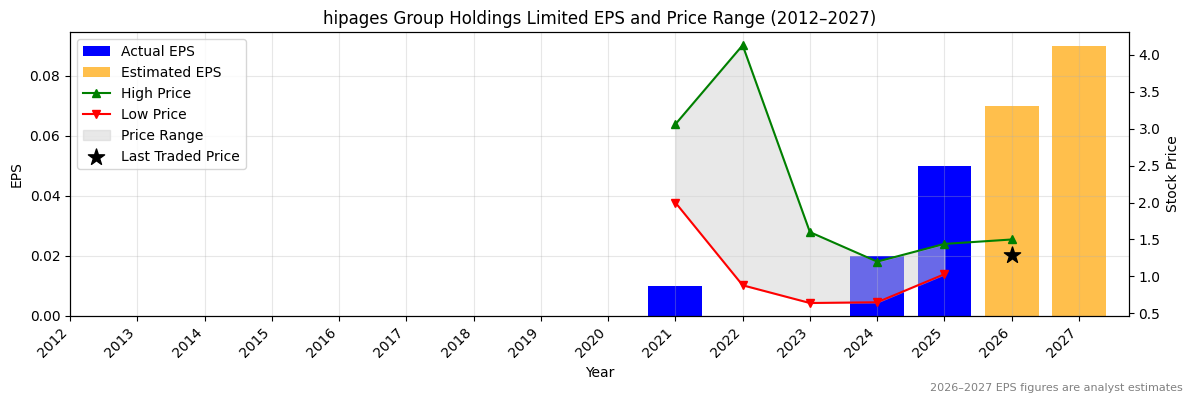
HPG Normalised Earnings Per Share (EPS) (2012–2027)
✅✅
Valuation
| Price To Sales |
Price To Book |
PER 2023 |
PER 2024 |
13Y Median PER Low |
PER 2025e |
13Y Median PER High |
PER 2026e |
Last Updated |
| 2.2 |
4.2 |
None |
67.5 |
32.5 |
27.0 |
44.4 |
19.3 |
4/10/25 |
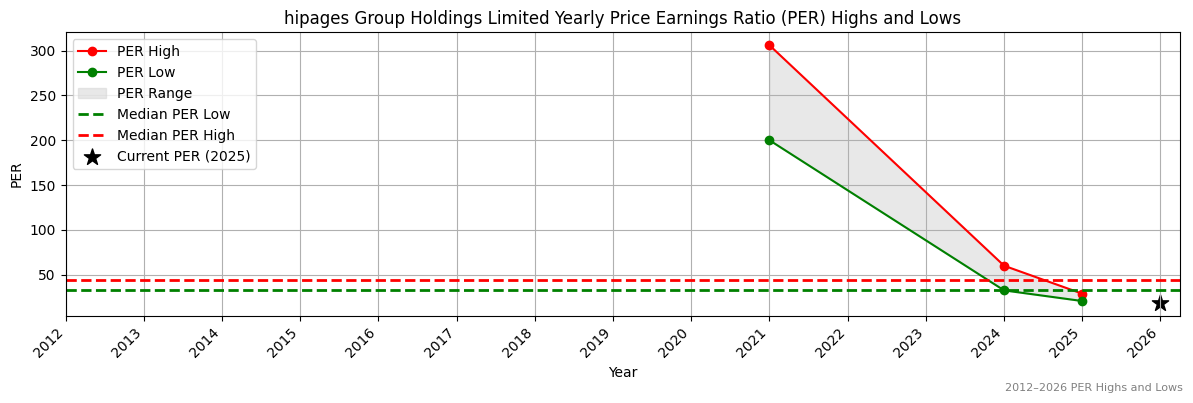
HPG Yearly Price Earnings Ratio (PER) Highs and Lows
✅✅
HPG Weekly Price Chart with Average True Range (ATR) Trailing Stop (10-Year View)
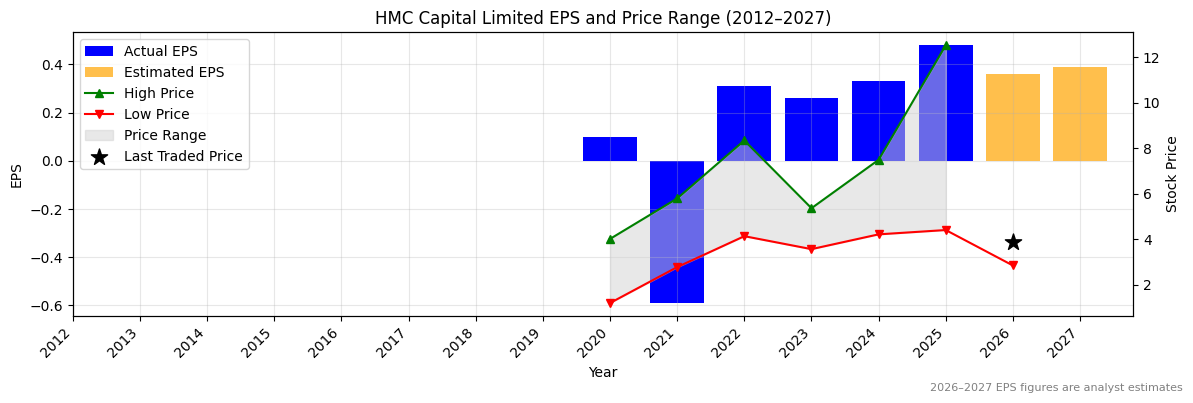
Ticker code: HMC
HMC Red Flags & Risk Indicators
❌
⚠️ RED FLAGS: 3 identified
- Highly Shorted
- Increasing Shorts
- Falling EBITDA Margins
Income Statement
| Revenue 2024 Per Share |
Revenue 2025e Per Share |
Revenue 2026e Per Share |
Revenue 24 to 25e [%] |
Revenue 25e to 26e [%] |
EBITDA 2024 Per Share |
EBITDA 2025e Per Share |
EBITDA 2026e Per Share |
EBITDA 24 to 25e [%] |
EBITDA 25e to 26e [%] |
| 0.50826 |
1.0155 |
0.7982 |
99.8 |
-21.4 |
0.38971 |
0.66384 |
0.50485 |
70.3 |
-23.9 |
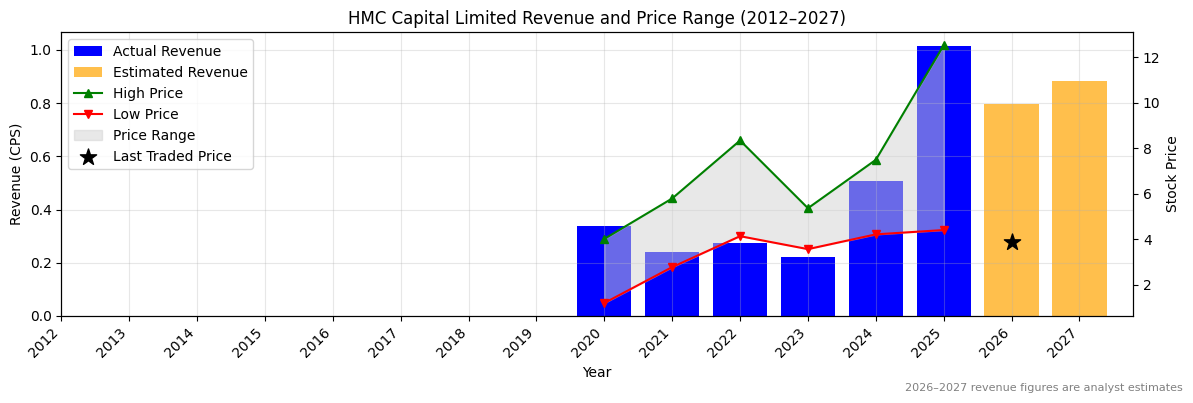
HMC Revenue Per Share (2012–2027)
✅✅
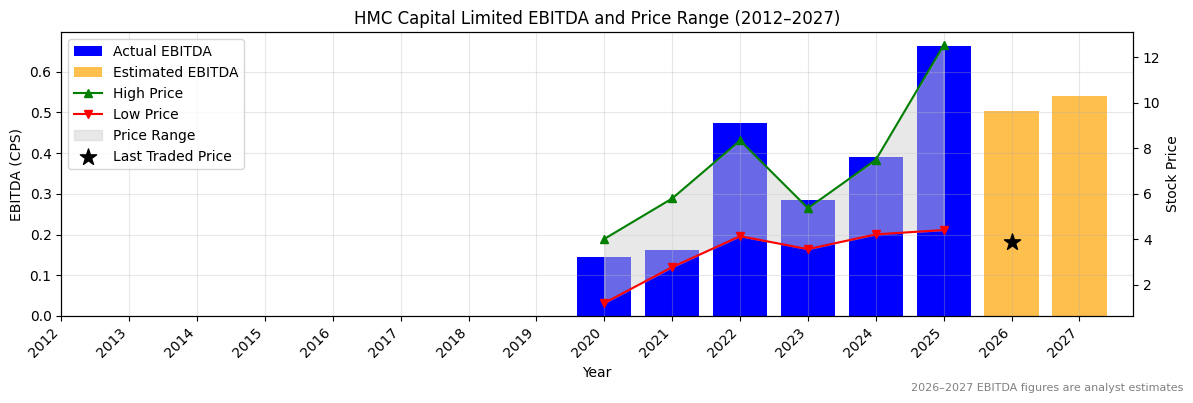
HMC Earnings before Interest, Tax, Depreciation and Amortisation (EBITDA) Per Share (2012–2027)
✅✅
HMC Normalised Earnings Per Share (EPS) (2012–2027)
✅✅
Valuation
| Price To Sales |
Price To Book |
PER 2023 |
PER 2024 |
13Y Median PER Low |
PER 2025e |
13Y Median PER High |
PER 2026e |
Last Updated |
| 5.3 |
0.8 |
11.9 |
9.4 |
12.4 |
6.5 |
26.1 |
8.6 |
30/6/25 |
HMC Yearly Price Earnings Ratio (PER) Highs and Lows
✅✅
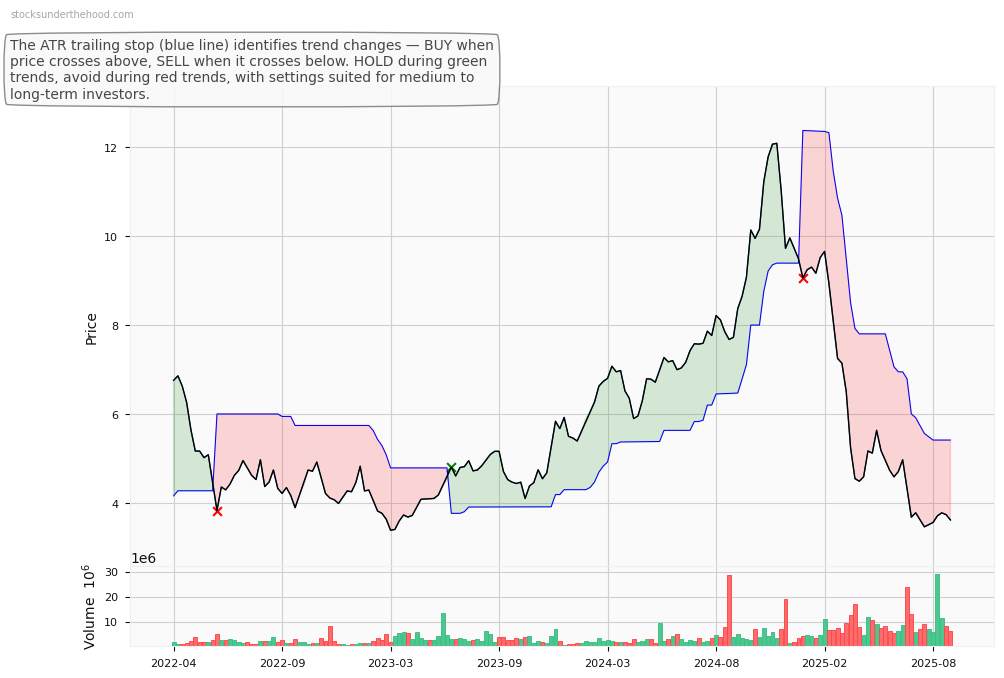
HMC Weekly Price Chart with Average True Range (ATR) Trailing Stop (10-Year View)
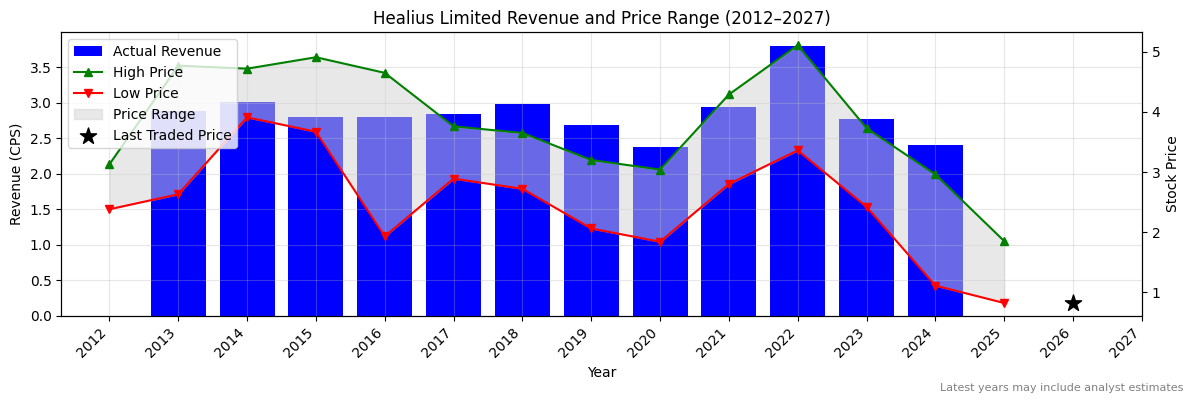
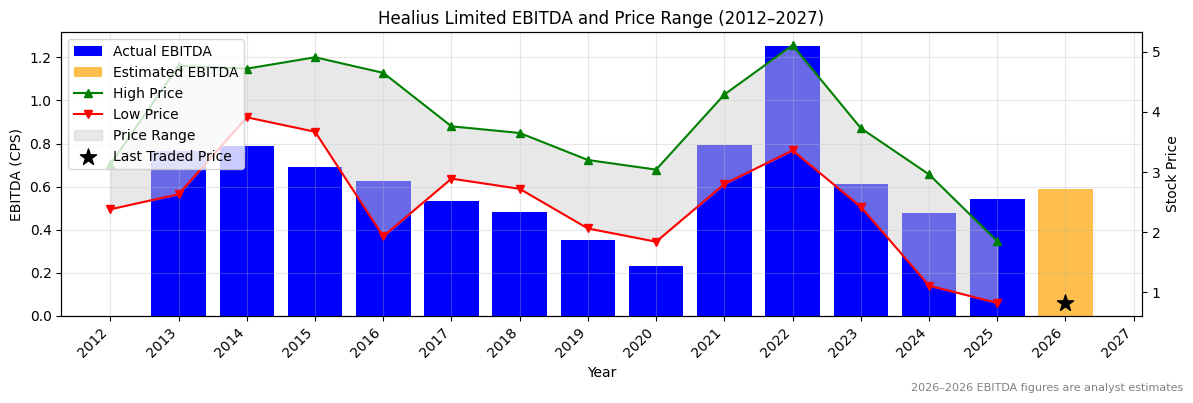
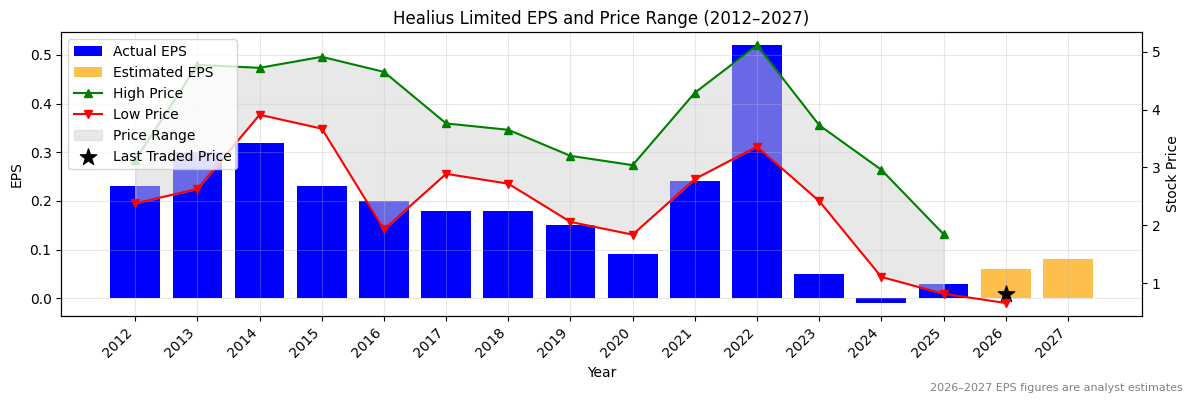
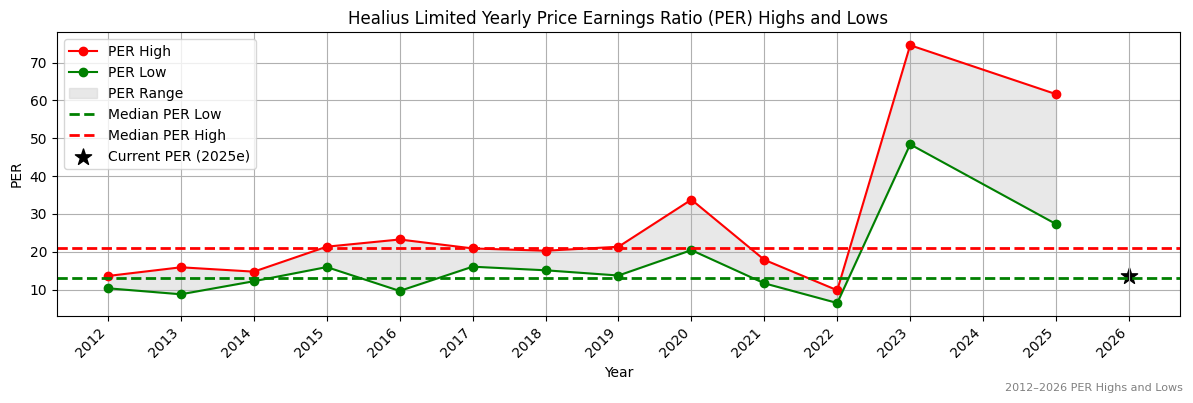
Ticker code: HLS
HLS Red Flags & Risk Indicators
❌
⚠️ RED FLAGS: 3 identified
- Increasing Shorts
- Falling Earnings
- More Net Debt Than Equity
Income Statement
| Revenue 2024 Per Share |
Revenue 2025e Per Share |
Revenue 2026e Per Share |
Revenue 24 to 25e [%] |
Revenue 25e to 26e [%] |
EBITDA 2024 Per Share |
EBITDA 2025e Per Share |
EBITDA 2026e Per Share |
EBITDA 24 to 25e [%] |
EBITDA 25e to 26e [%] |
| 2.4049 |
None |
None |
None |
None |
0.47734 |
0.54079 |
0.5869 |
13.3 |
8.5 |
HLS Revenue Per Share (2012–2027)
HLS Earnings before Interest, Tax, Depreciation and Amortisation (EBITDA) Per Share (2012–2027)
✅
HLS Normalised Earnings Per Share (EPS) (2012–2027)
✅✅
Valuation
| Price To Sales |
Price To Book |
PER 2023 |
PER 2024 |
13Y Median PER Low |
PER 2025e |
13Y Median PER High |
PER 2026e |
Last Updated |
| 0.5 |
1.1 |
17.8 |
-89.0 |
13.0 |
29.7 |
20.9 |
14.8 |
22/8/24 |
HLS Yearly Price Earnings Ratio (PER) Highs and Lows
❌
HLS Weekly Price Chart with Average True Range (ATR) Trailing Stop (10-Year View)
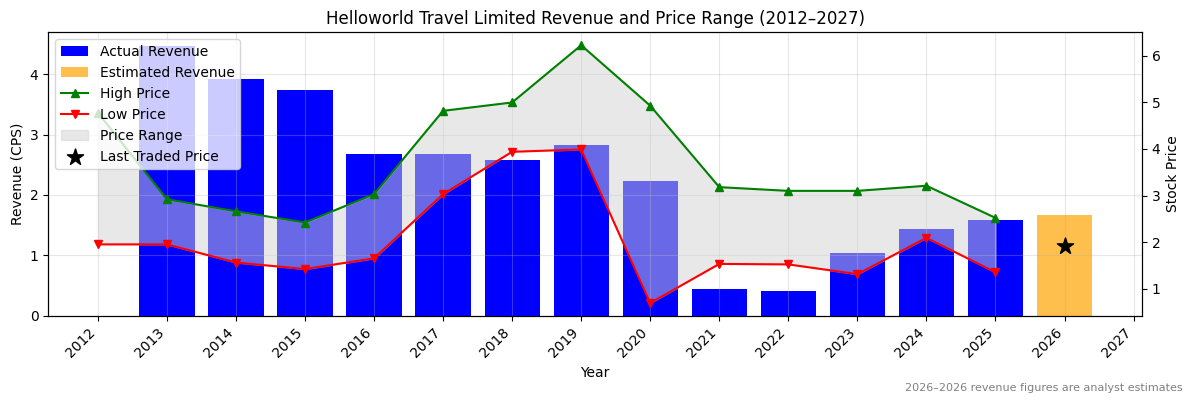
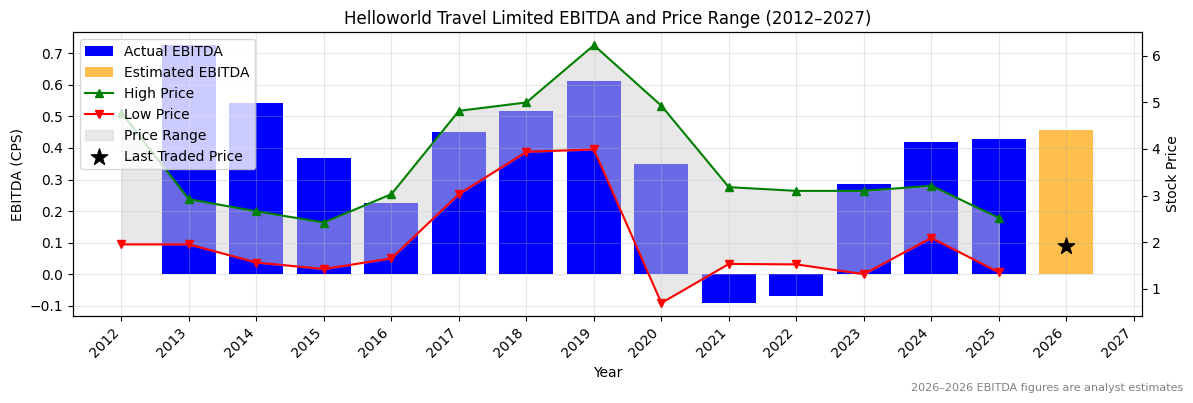
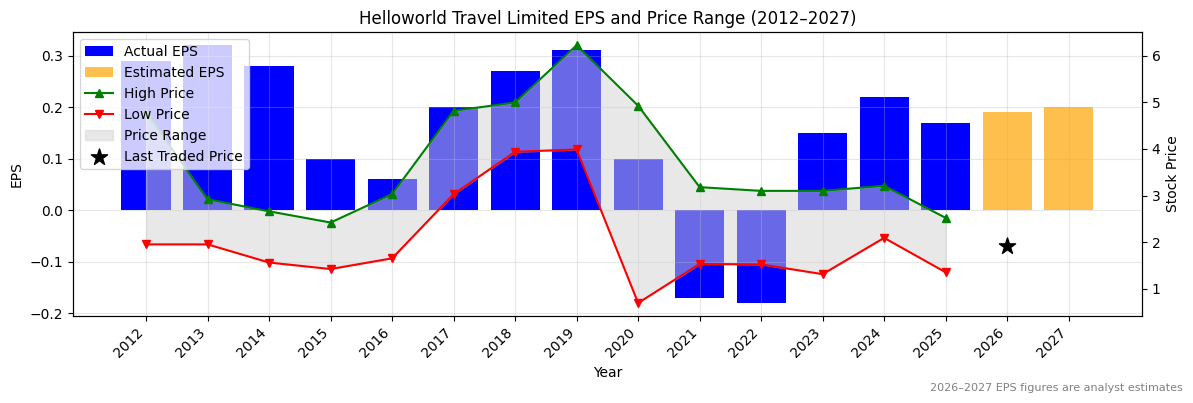
Ticker code: HLO
HLO Red Flags & Risk Indicators
⚠️
⚠️ RED FLAGS: 2 identified
- Falling Earnings
- Falling EBITDA Margins
Income Statement
| Revenue 2024 Per Share |
Revenue 2025e Per Share |
Revenue 2026e Per Share |
Revenue 24 to 25e [%] |
Revenue 25e to 26e [%] |
EBITDA 2024 Per Share |
EBITDA 2025e Per Share |
EBITDA 2026e Per Share |
EBITDA 24 to 25e [%] |
EBITDA 25e to 26e [%] |
| 1.44503 |
1.59049 |
1.6658 |
10.1 |
4.7 |
0.41906 |
0.42938 |
0.45602 |
2.5 |
6.2 |
HLO Revenue Per Share (2012–2027)
✅
HLO Earnings before Interest, Tax, Depreciation and Amortisation (EBITDA) Per Share (2012–2027)
✅
HLO Normalised Earnings Per Share (EPS) (2012–2027)
❌
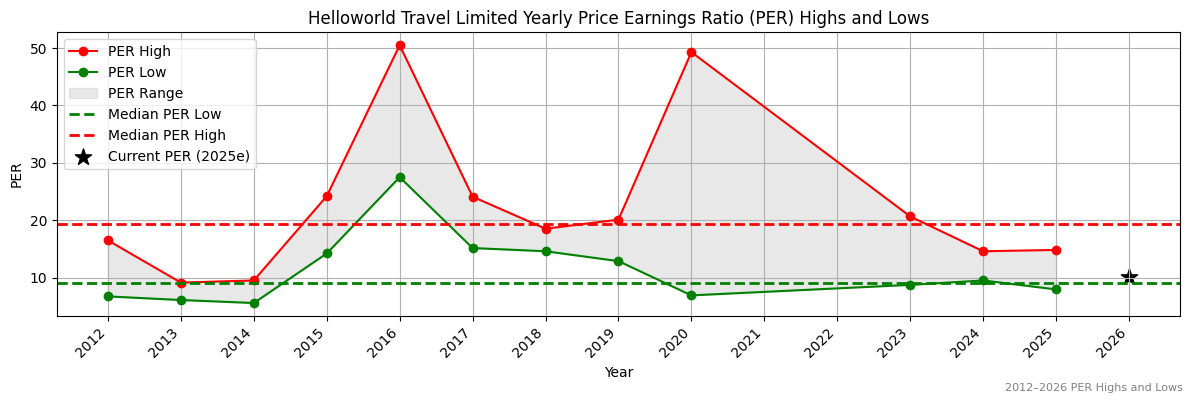
Valuation
| Price To Sales |
Price To Book |
PER 2023 |
PER 2024 |
13Y Median PER Low |
PER 2025e |
13Y Median PER High |
PER 2026e |
Last Updated |
| 1.7 |
0.9 |
12.7 |
8.6 |
9.1 |
11.2 |
19.3 |
10.0 |
10/10/24 |
HLO Yearly Price Earnings Ratio (PER) Highs and Lows
✅
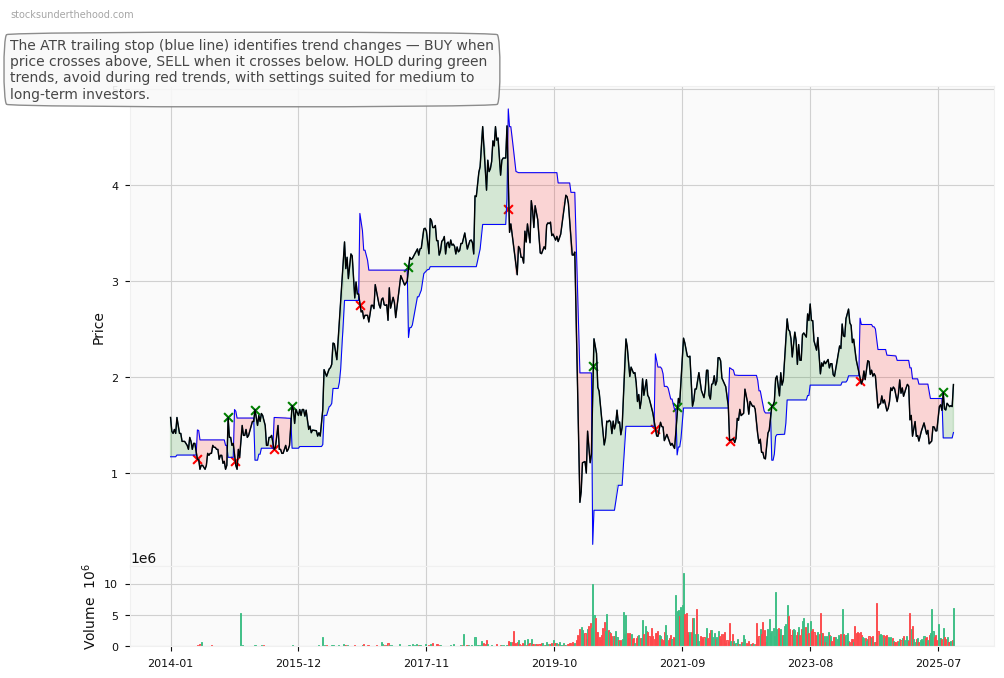
HLO Weekly Price Chart with Average True Range (ATR) Trailing Stop (10-Year View)
Ticker code: HLI
HLI Red Flags & Risk Indicators
❌
⚠️ RED FLAGS: 3 identified
- Increasing Shorts
- Falling Earnings
- High Relative Valuation
Income Statement
| Revenue 2024 Per Share |
Revenue 2025e Per Share |
Revenue 2026e Per Share |
Revenue 24 to 25e [%] |
Revenue 25e to 26e [%] |
EBITDA 2024 Per Share |
EBITDA 2025e Per Share |
EBITDA 2026e Per Share |
EBITDA 24 to 25e [%] |
EBITDA 25e to 26e [%] |
| 1.32193 |
None |
None |
None |
None |
1.3341 |
None |
None |
None |
None |
HLI Revenue Per Share (2012–2027)
HLI Earnings before Interest, Tax, Depreciation and Amortisation (EBITDA) Per Share (2012–2027)
HLI Normalised Earnings Per Share (EPS) (2012–2027)
❌
Valuation
| Price To Sales |
Price To Book |
PER 2023 |
PER 2024 |
13Y Median PER Low |
PER 2025e |
13Y Median PER High |
PER 2026e |
Last Updated |
| 2.6 |
1.4 |
7.1 |
7.0 |
6.9 |
11.5 |
10.5 |
13.1 |
3/3/24 |
HLI Yearly Price Earnings Ratio (PER) Highs and Lows
❌
HLI Weekly Price Chart with Average True Range (ATR) Trailing Stop (10-Year View)
Ticker code: HIT
HIT Red Flags & Risk Indicators
❌
⚠️ RED FLAGS: 4 identified
- Negative Operating Cash Flow
- Falling Earnings
- High Price to Book vs ROE
- High Relative Valuation
Income Statement
| Revenue 2024 Per Share |
Revenue 2025e Per Share |
Revenue 2026e Per Share |
Revenue 24 to 25e [%] |
Revenue 25e to 26e [%] |
EBITDA 2024 Per Share |
EBITDA 2025e Per Share |
EBITDA 2026e Per Share |
EBITDA 24 to 25e [%] |
EBITDA 25e to 26e [%] |
| 1.33191 |
None |
None |
None |
None |
0.1835 |
None |
None |
None |
None |
HIT Revenue Per Share (2012–2027)
HIT Earnings before Interest, Tax, Depreciation and Amortisation (EBITDA) Per Share (2012–2027)
HIT Normalised Earnings Per Share (EPS) (2012–2027)
Valuation
| Price To Sales |
Price To Book |
PER 2023 |
PER 2024 |
13Y Median PER Low |
PER 2025e |
13Y Median PER High |
PER 2026e |
Last Updated |
| 1.0 |
6.0 |
14.9 |
13.6 |
9.3 |
None |
15.7 |
None |
19/2/24 |
HIT Yearly Price Earnings Ratio (PER) Highs and Lows
HIT Weekly Price Chart with Average True Range (ATR) Trailing Stop (10-Year View)
Ticker code: HDN
HDN Red Flags & Risk Indicators
✅
⚠️ RED FLAGS: 0 identified
No red flags detected.
Income Statement
| Revenue 2024 Per Share |
Revenue 2025e Per Share |
Revenue 2026e Per Share |
Revenue 24 to 25e [%] |
Revenue 25e to 26e [%] |
EBITDA 2024 Per Share |
EBITDA 2025e Per Share |
EBITDA 2026e Per Share |
EBITDA 24 to 25e [%] |
EBITDA 25e to 26e [%] |
| None |
None |
None |
None |
None |
None |
None |
None |
None |
None |
HDN Revenue Per Share (2012–2027)
HDN Earnings before Interest, Tax, Depreciation and Amortisation (EBITDA) Per Share (2012–2027)
HDN Normalised Earnings Per Share (EPS) (2012–2027)
Valuation
| Price To Sales |
Price To Book |
PER 2023 |
PER 2024 |
13Y Median PER Low |
PER 2025e |
13Y Median PER High |
PER 2026e |
Last Updated |
| 8.6 |
0.9 |
None |
None |
None |
None |
None |
None |
None |
HDN Yearly Price Earnings Ratio (PER) Highs and Lows
HDN Weekly Price Chart with Average True Range (ATR) Trailing Stop (10-Year View)
Ticker code: HAS
HAS Red Flags & Risk Indicators
❌
⚠️ RED FLAGS: 6 identified
- Negative Operating Cash Flow
- Large Share Issuance
- Zero Revenue
- Falling Earnings
- More Net Debt Than Equity
- Risk Of Capital Raise
Income Statement
| Revenue 2024 Per Share |
Revenue 2025e Per Share |
Revenue 2026e Per Share |
Revenue 24 to 25e [%] |
Revenue 25e to 26e [%] |
EBITDA 2024 Per Share |
EBITDA 2025e Per Share |
EBITDA 2026e Per Share |
EBITDA 24 to 25e [%] |
EBITDA 25e to 26e [%] |
| None |
None |
None |
None |
None |
-0.04692 |
-0.50033 |
-0.01767 |
-966.3 |
96.5 |
HAS Revenue Per Share (2012–2027)
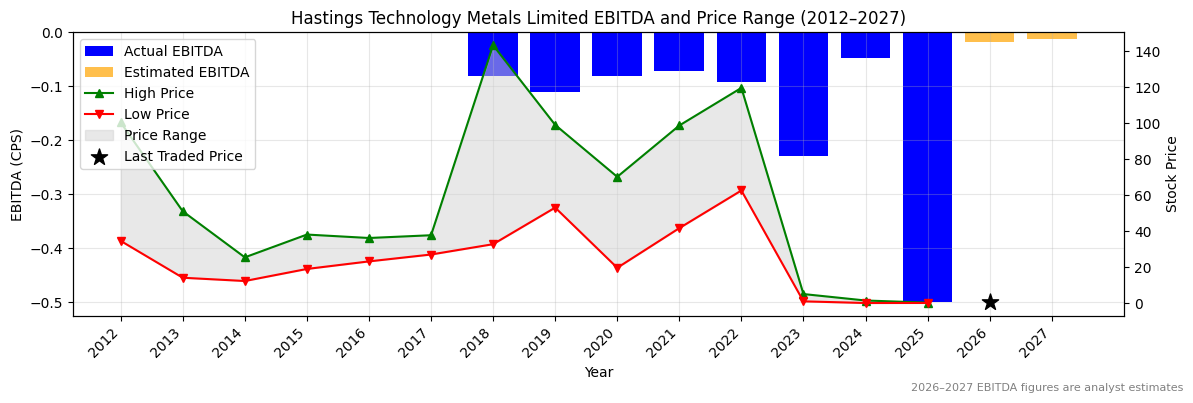
HAS Earnings before Interest, Tax, Depreciation and Amortisation (EBITDA) Per Share (2012–2027)
❌
HAS Normalised Earnings Per Share (EPS) (2012–2027)
Valuation
| Price To Sales |
Price To Book |
PER 2023 |
PER 2024 |
13Y Median PER Low |
PER 2025e |
13Y Median PER High |
PER 2026e |
Last Updated |
| 63.9 |
1.5 |
None |
None |
None |
None |
None |
None |
20/4/25 |
HAS Yearly Price Earnings Ratio (PER) Highs and Lows
HAS Weekly Price Chart with Average True Range (ATR) Trailing Stop (10-Year View)
Ticker code: GTK
GTK Red Flags & Risk Indicators
⚠️
⚠️ RED FLAGS: 2 identified
- Increasing Shorts
- Falling Revenues
Income Statement
| Revenue 2024 Per Share |
Revenue 2025e Per Share |
Revenue 2026e Per Share |
Revenue 24 to 25e [%] |
Revenue 25e to 26e [%] |
EBITDA 2024 Per Share |
EBITDA 2025e Per Share |
EBITDA 2026e Per Share |
EBITDA 24 to 25e [%] |
EBITDA 25e to 26e [%] |
| 2.0605 |
2.1601 |
2.51165 |
4.8 |
16.3 |
0.22795 |
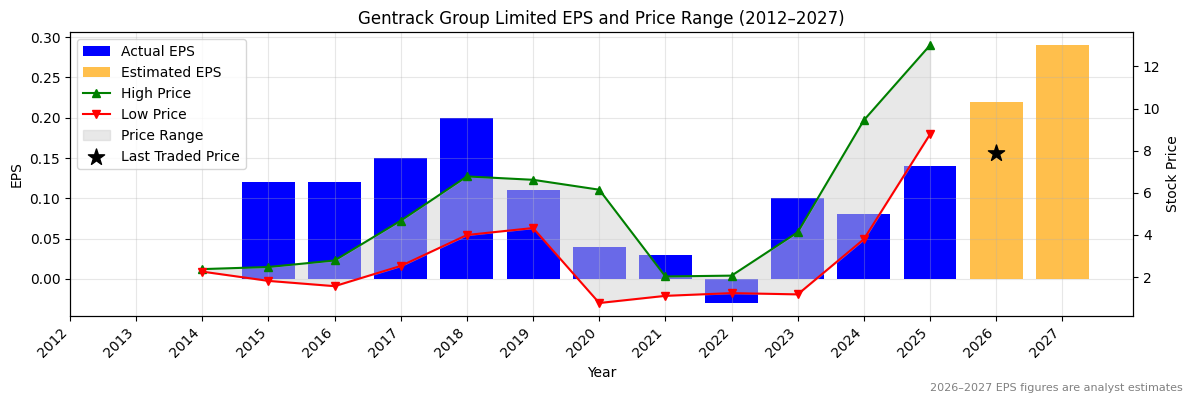
0.26615 |
0.3743 |
16.8 |
40.6 |
GTK Revenue Per Share (2012–2027)
✅
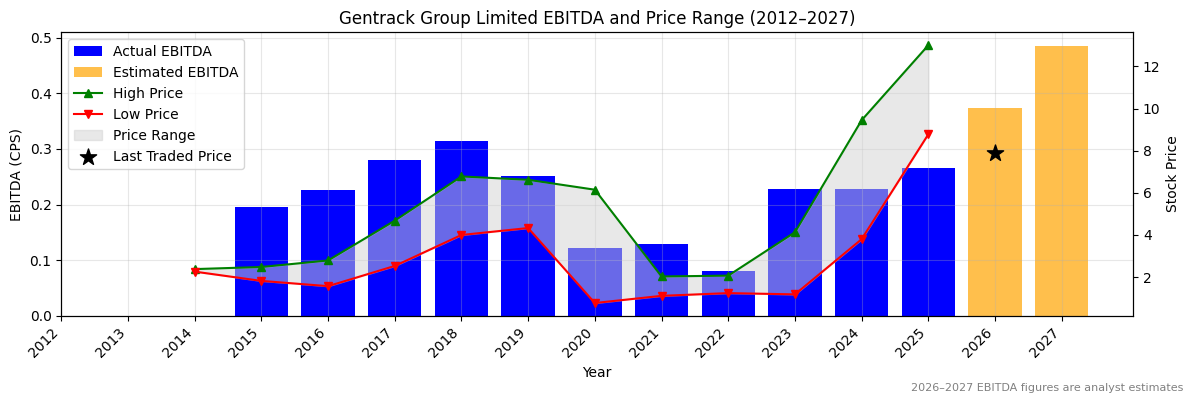
GTK Earnings before Interest, Tax, Depreciation and Amortisation (EBITDA) Per Share (2012–2027)
✅
GTK Normalised Earnings Per Share (EPS) (2012–2027)
✅✅
Valuation
| Price To Sales |
Price To Book |
PER 2023 |
PER 2024 |
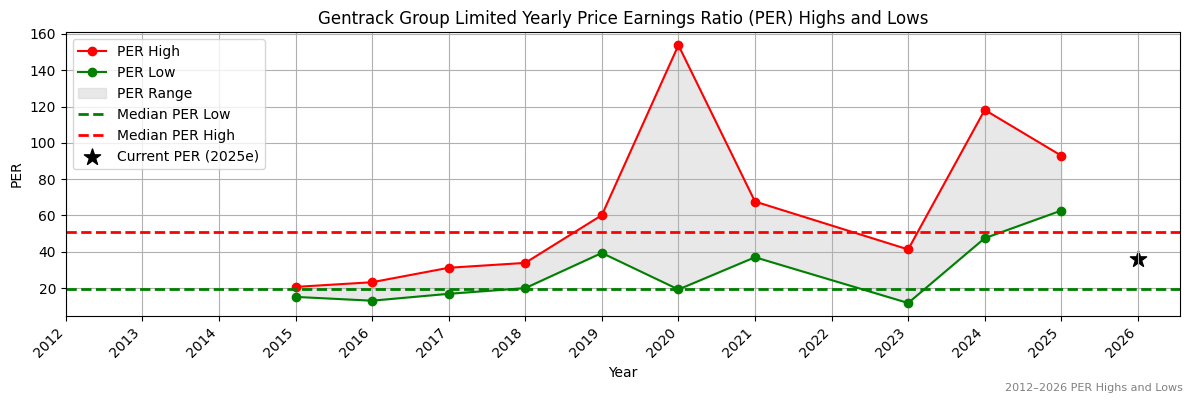
13Y Median PER Low |
PER 2025e |
13Y Median PER High |
PER 2026e |
Last Updated |
| 3.9 |
3.8 |
80.2 |
100.3 |
19.6 |
57.3 |
50.7 |
36.5 |
4/10/25 |
GTK Yearly Price Earnings Ratio (PER) Highs and Lows
❌
GTK Weekly Price Chart with Average True Range (ATR) Trailing Stop (10-Year View)
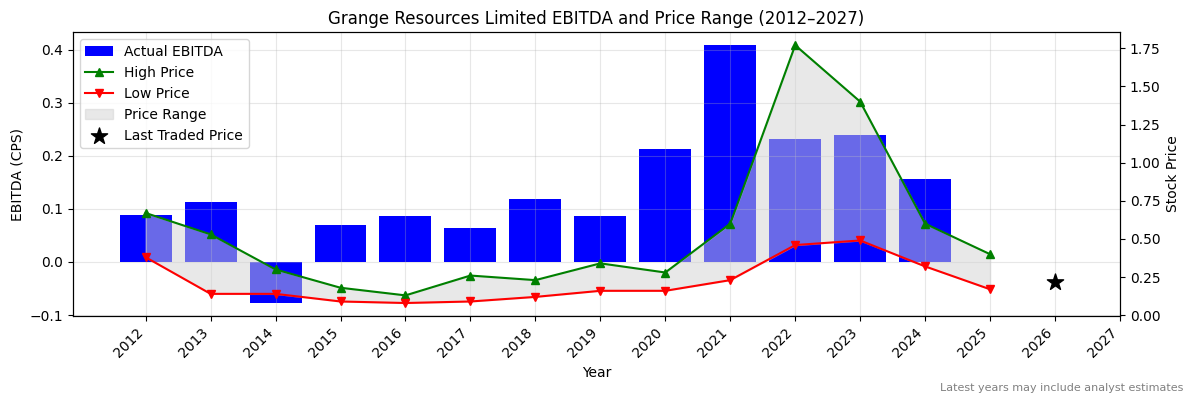
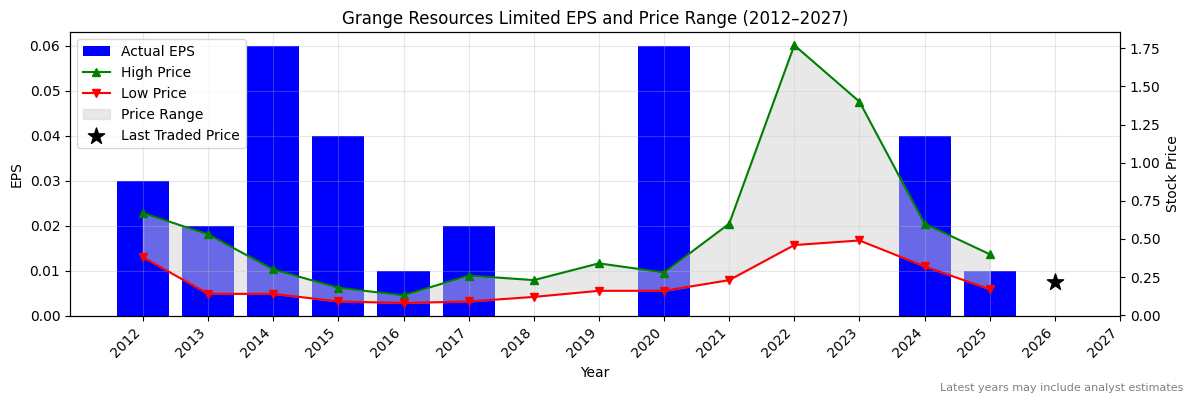
Ticker code: GRR
GRR Red Flags & Risk Indicators
⚠️
⚠️ RED FLAGS: 2 identified
- Falling Earnings
- High Relative Valuation
Income Statement
| Revenue 2024 Per Share |
Revenue 2025e Per Share |
Revenue 2026e Per Share |
Revenue 24 to 25e [%] |
Revenue 25e to 26e [%] |
EBITDA 2024 Per Share |
EBITDA 2025e Per Share |
EBITDA 2026e Per Share |
EBITDA 24 to 25e [%] |
EBITDA 25e to 26e [%] |
| 0.49284 |
None |
None |
None |
None |
0.15656 |
None |
None |
None |
None |
GRR Revenue Per Share (2012–2027)
GRR Earnings before Interest, Tax, Depreciation and Amortisation (EBITDA) Per Share (2012–2027)
GRR Normalised Earnings Per Share (EPS) (2012–2027)
❌
Valuation
| Price To Sales |
Price To Book |
PER 2023 |
PER 2024 |
13Y Median PER Low |
PER 2025e |
13Y Median PER High |
PER 2026e |
Last Updated |
| 0.6 |
0.3 |
None |
6.8 |
7.0 |
27.0 |
13.0 |
None |
3/1/24 |
GRR Yearly Price Earnings Ratio (PER) Highs and Lows
❌
GRR Weekly Price Chart with Average True Range (ATR) Trailing Stop (10-Year View)
Ticker code: GQG
GQG Red Flags & Risk Indicators
⚠️
⚠️ RED FLAGS: 1 identified
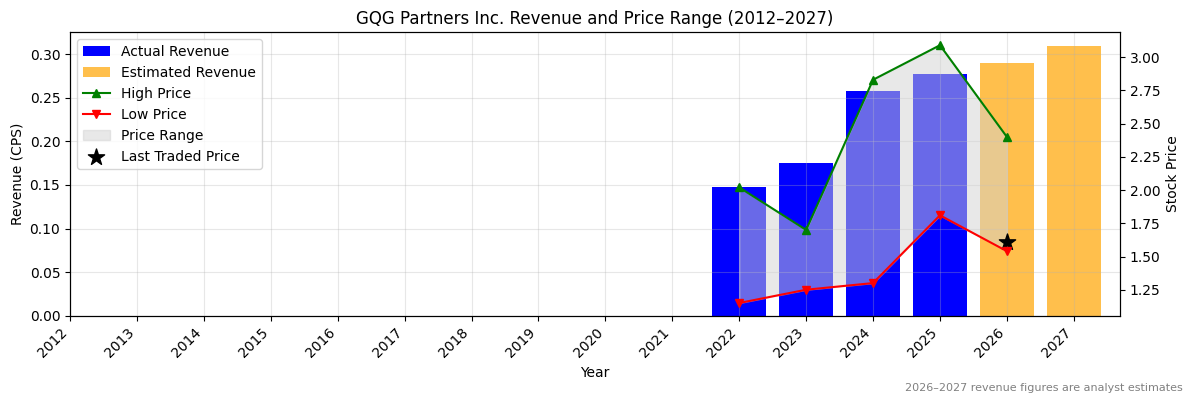
Income Statement
| Revenue 2024 Per Share |
Revenue 2025e Per Share |
Revenue 2026e Per Share |
Revenue 24 to 25e [%] |
Revenue 25e to 26e [%] |
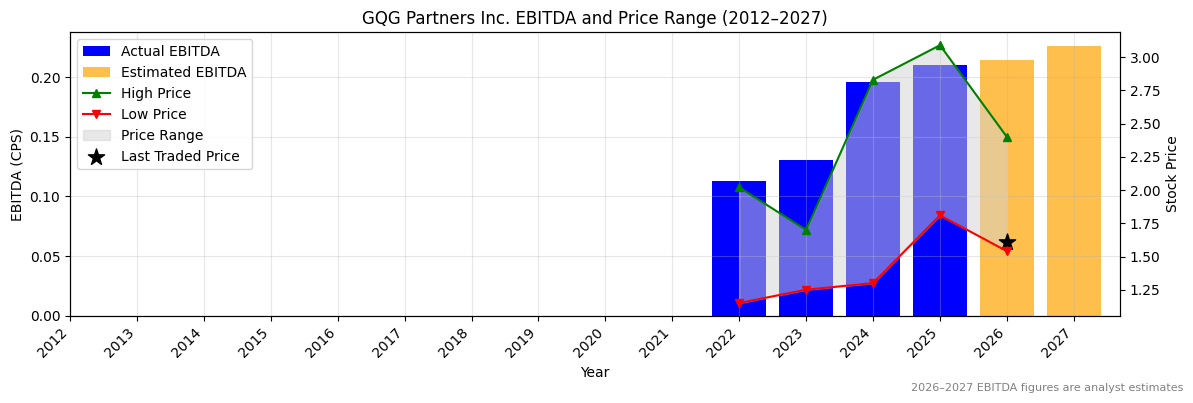
EBITDA 2024 Per Share |
EBITDA 2025e Per Share |
EBITDA 2026e Per Share |
EBITDA 24 to 25e [%] |
EBITDA 25e to 26e [%] |
| 0.25747 |
0.27734 |
0.28971 |
7.7 |
4.5 |
0.19583 |
0.21011 |
0.21463 |
7.3 |
2.2 |
GQG Revenue Per Share (2012–2027)
✅
GQG Earnings before Interest, Tax, Depreciation and Amortisation (EBITDA) Per Share (2012–2027)
✅
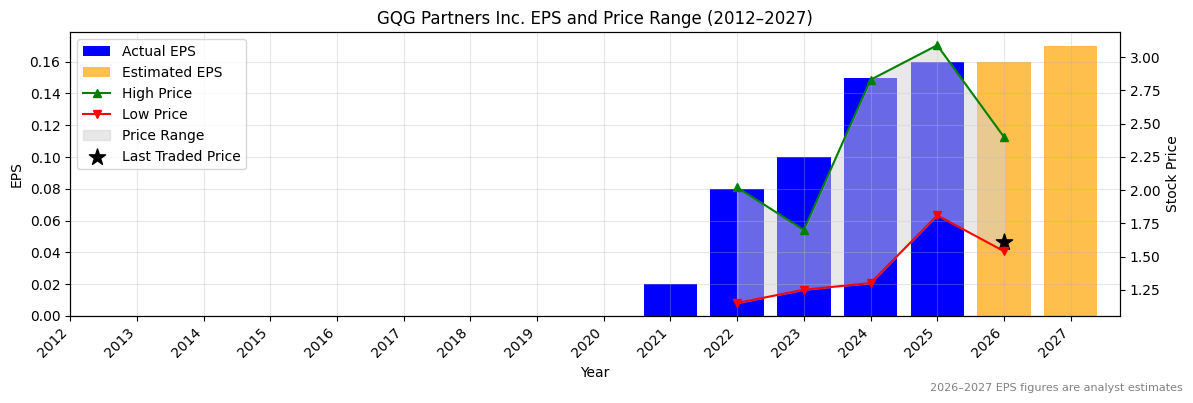
GQG Normalised Earnings Per Share (EPS) (2012–2027)
✅
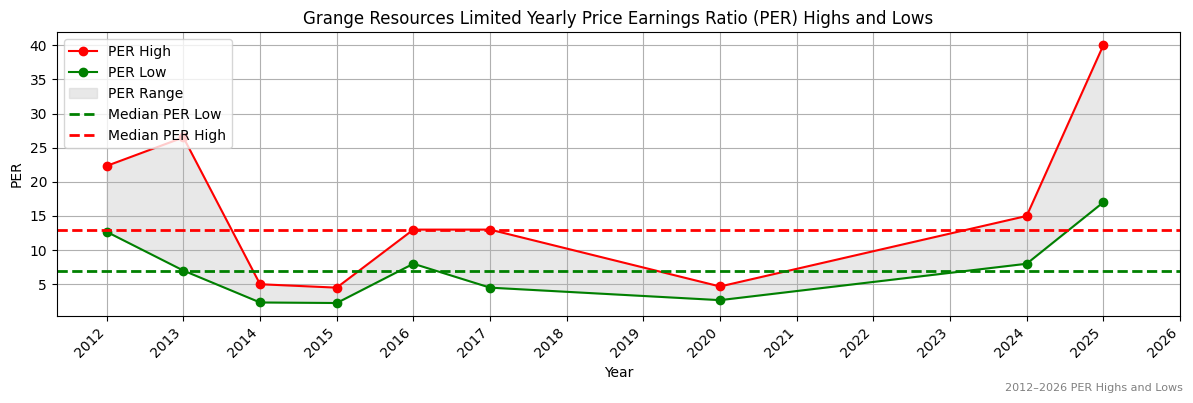
Valuation
| Price To Sales |
Price To Book |
PER 2023 |
PER 2024 |
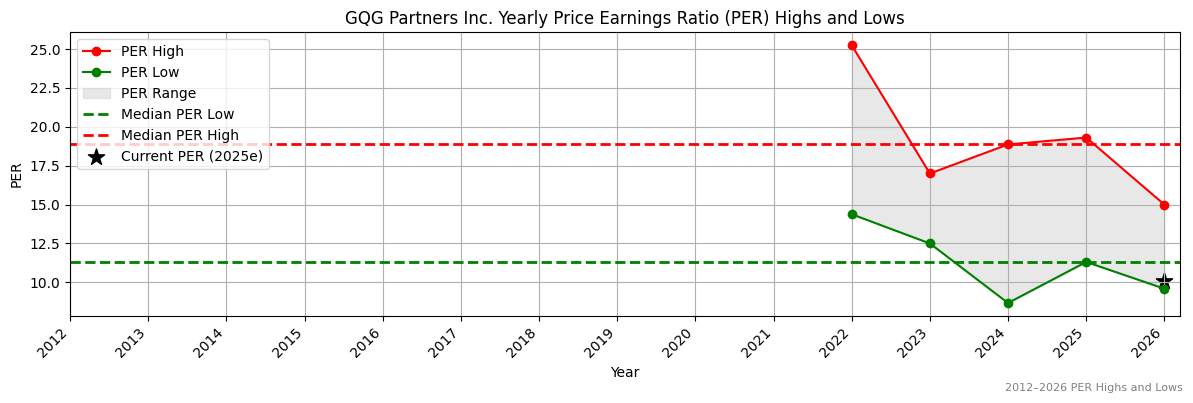
13Y Median PER Low |
PER 2025e |
13Y Median PER High |
PER 2026e |
Last Updated |
| 6.3 |
10.9 |
15.7 |
10.4 |
11.3 |
9.8 |
18.9 |
9.8 |
17/9/25 |
GQG Yearly Price Earnings Ratio (PER) Highs and Lows
✅✅
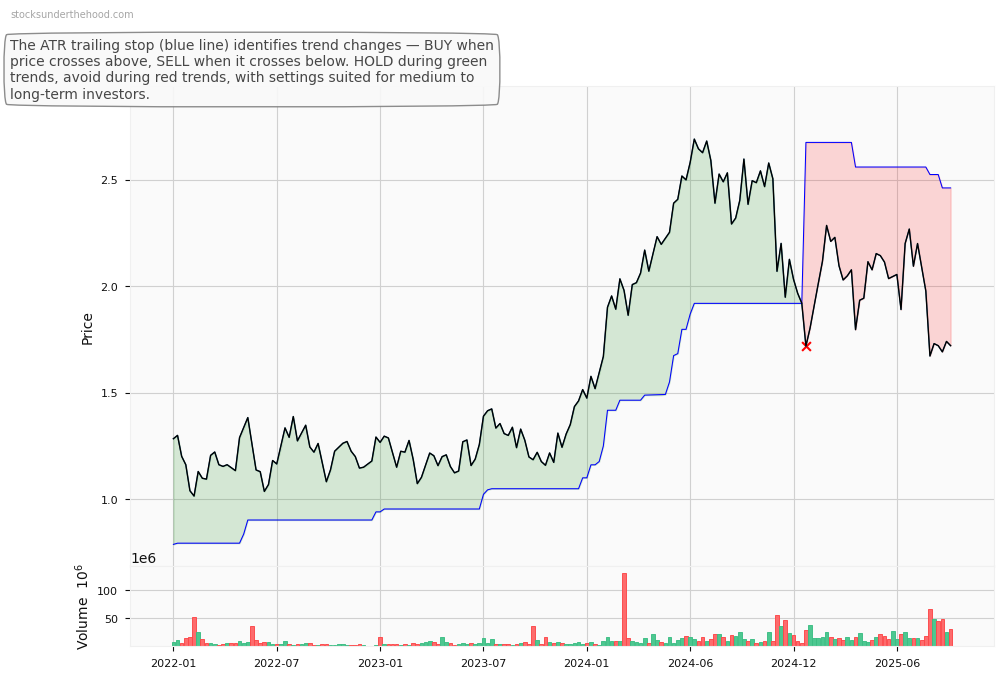
GQG Weekly Price Chart with Average True Range (ATR) Trailing Stop (10-Year View)
Ticker code: GPT
GPT Red Flags & Risk Indicators
❌
⚠️ RED FLAGS: 3 identified
- Increasing Shorts
- Falling Earnings
- High Relative Valuation
Income Statement
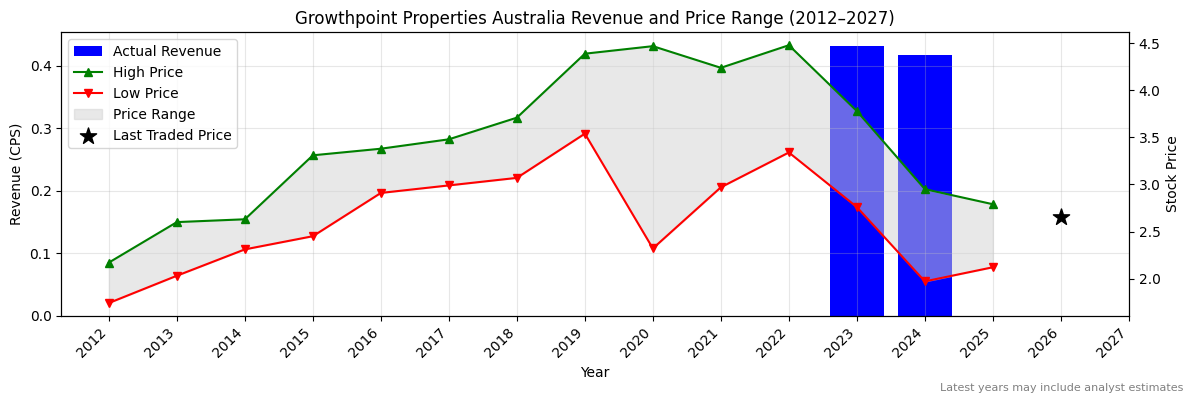
| Revenue 2024 Per Share |
Revenue 2025e Per Share |
Revenue 2026e Per Share |
Revenue 24 to 25e [%] |
Revenue 25e to 26e [%] |
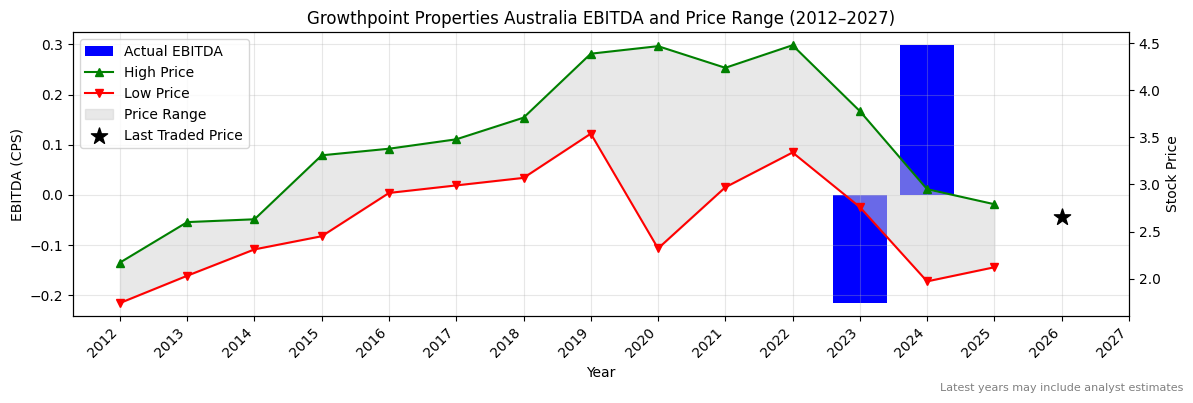
EBITDA 2024 Per Share |
EBITDA 2025e Per Share |
EBITDA 2026e Per Share |
EBITDA 24 to 25e [%] |
EBITDA 25e to 26e [%] |
| 0.49645 |
None |
None |
None |
None |
0.30057 |
None |
None |
None |
None |
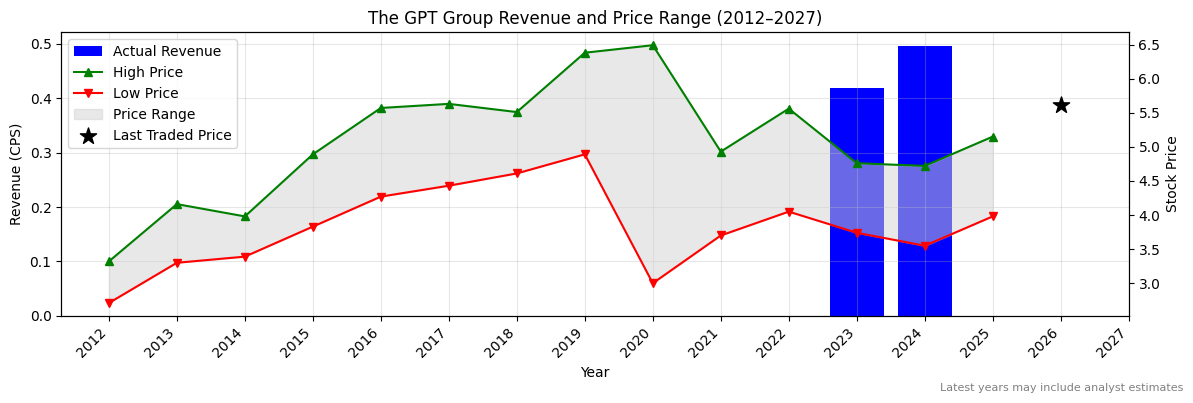
GPT Revenue Per Share (2012–2027)
GPT Earnings before Interest, Tax, Depreciation and Amortisation (EBITDA) Per Share (2012–2027)
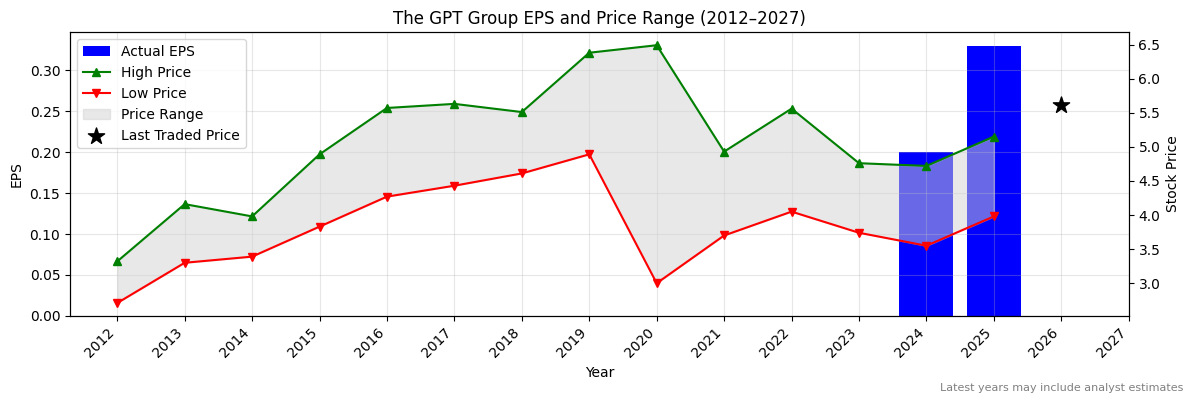
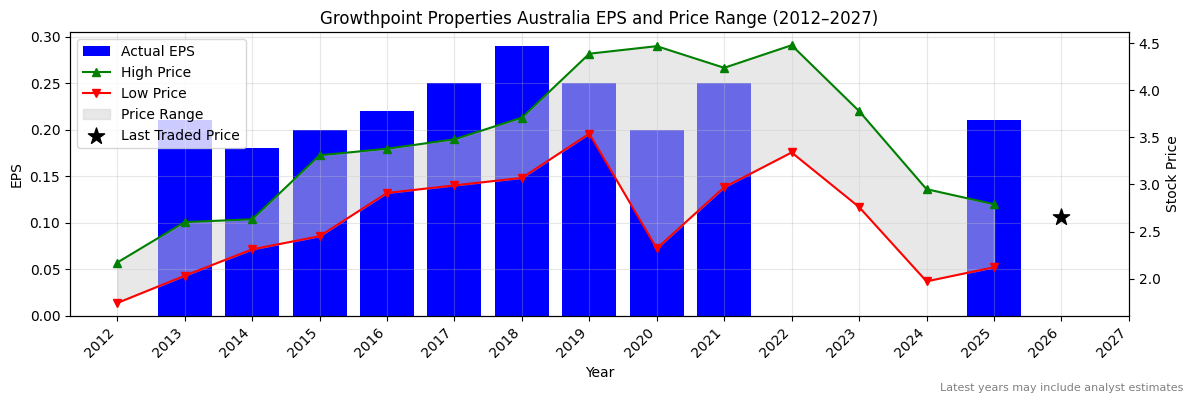
GPT Normalised Earnings Per Share (EPS) (2012–2027)
✅✅
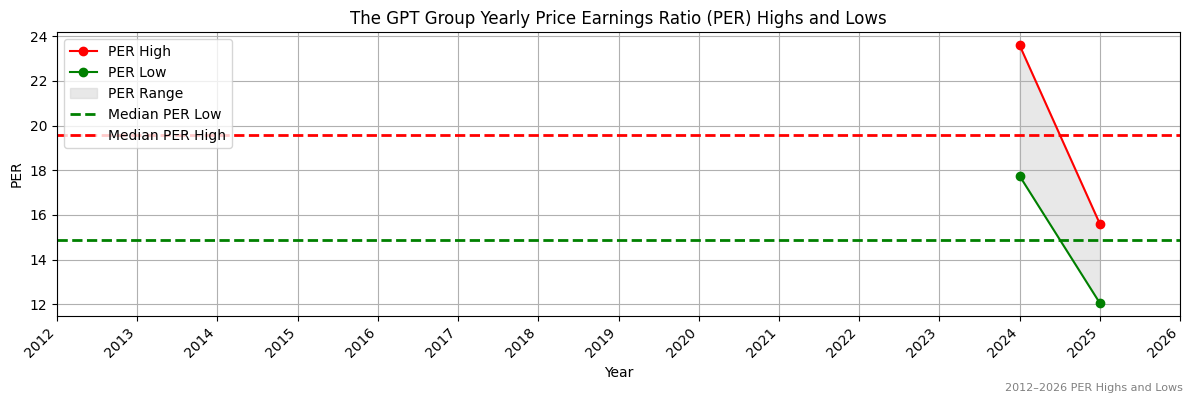
Valuation
| Price To Sales |
Price To Book |
PER 2023 |
PER 2024 |
13Y Median PER Low |
PER 2025e |
13Y Median PER High |
PER 2026e |
Last Updated |
| 9.6 |
1.0 |
None |
26.8 |
14.9 |
16.2 |
19.6 |
None |
None |
GPT Yearly Price Earnings Ratio (PER) Highs and Lows
✅
GPT Weekly Price Chart with Average True Range (ATR) Trailing Stop (10-Year View)
Ticker code: GOZ
GOZ Red Flags & Risk Indicators
⚠️
⚠️ RED FLAGS: 2 identified
- Falling Earnings
- High Relative Valuation
Income Statement
| Revenue 2024 Per Share |
Revenue 2025e Per Share |
Revenue 2026e Per Share |
Revenue 24 to 25e [%] |
Revenue 25e to 26e [%] |
EBITDA 2024 Per Share |
EBITDA 2025e Per Share |
EBITDA 2026e Per Share |
EBITDA 24 to 25e [%] |
EBITDA 25e to 26e [%] |
| 0.41754 |
None |
None |
None |
None |
0.29839 |
None |
None |
None |
None |
GOZ Revenue Per Share (2012–2027)
GOZ Earnings before Interest, Tax, Depreciation and Amortisation (EBITDA) Per Share (2012–2027)
GOZ Normalised Earnings Per Share (EPS) (2012–2027)
Valuation
| Price To Sales |
Price To Book |
PER 2023 |
PER 2024 |
13Y Median PER Low |
PER 2025e |
13Y Median PER High |
PER 2026e |
Last Updated |
| 6.0 |
0.8 |
None |
None |
11.9 |
12.2 |
15.0 |
None |
1/8/22 |
GOZ Yearly Price Earnings Ratio (PER) Highs and Lows
✅
GOZ Weekly Price Chart with Average True Range (ATR) Trailing Stop (10-Year View)
Ticker code: ASX:GOZ
ASX:GOZ Red Flags & Risk Indicators
⚠️
⚠️ RED FLAGS: 2 identified
- Falling Earnings
- High Relative Valuation
Income Statement
| Revenue 2024 Per Share |
Revenue 2025e Per Share |
Revenue 2026e Per Share |
Revenue 24 to 25e [%] |
Revenue 25e to 26e [%] |
EBITDA 2024 Per Share |
EBITDA 2025e Per Share |
EBITDA 2026e Per Share |
EBITDA 24 to 25e [%] |
EBITDA 25e to 26e [%] |
| 0.41754 |
None |
None |
None |
None |
0.29839 |
None |
None |
None |
None |
ASX:GOZ Revenue Per Share (2012–2027)
ASX:GOZ Earnings before Interest, Tax, Depreciation and Amortisation (EBITDA) Per Share (2012–2027)
ASX:GOZ Normalised Earnings Per Share (EPS) (2012–2027)
Valuation
| Price To Sales |
Price To Book |
PER 2023 |
PER 2024 |
13Y Median PER Low |
PER 2025e |
13Y Median PER High |
PER 2026e |
Last Updated |
| 6.1 |
0.8 |
None |
None |
11.9 |
12.5 |
15.0 |
None |
1/8/22 |
ASX:GOZ Yearly Price Earnings Ratio (PER) Highs and Lows
✅
ASX:GOZ Weekly Price Chart with Average True Range (ATR) Trailing Stop (10-Year View)
Ticker code: GOOGL
GOOGL Red Flags & Risk Indicators
⚠️
⚠️ RED FLAGS: 1 identified
Income Statement
| Revenue 2024 Per Share |
Revenue 2025e Per Share |
Revenue 2026e Per Share |
Revenue 24 to 25e [%] |
Revenue 25e to 26e [%] |
EBITDA 2024 Per Share |
EBITDA 2025e Per Share |
EBITDA 2026e Per Share |
EBITDA 24 to 25e [%] |
EBITDA 25e to 26e [%] |
| 28.15234 |
66.52171 |
73.76314 |
136.3 |
10.9 |
12.10376 |
29.56945 |
33.59524 |
144.3 |
13.6 |
GOOGL Revenue Per Share (2012–2027)
✅✅
GOOGL Earnings before Interest, Tax, Depreciation and Amortisation (EBITDA) Per Share (2012–2027)
✅✅
GOOGL Normalised Earnings Per Share (EPS) (2012–2027)
✅✅
Valuation
| Price To Sales |
Price To Book |
PER 2023 |
PER 2024 |
13Y Median PER Low |
PER 2025e |
13Y Median PER High |
PER 2026e |
Last Updated |
| 9.2 |
10.6 |
48.5 |
35.0 |
16.1 |
28.3 |
23.1 |
26.4 |
26/4/25 |
GOOGL Yearly Price Earnings Ratio (PER) Highs and Lows
❌
GOOGL Weekly Price Chart with Average True Range (ATR) Trailing Stop (10-Year View)