Ticker code: GNG
GNG Red Flags & Risk Indicators
⚠️
⚠️ RED FLAGS: 2 identified
- High Price to Book vs ROE
- High Relative Valuation
Income Statement
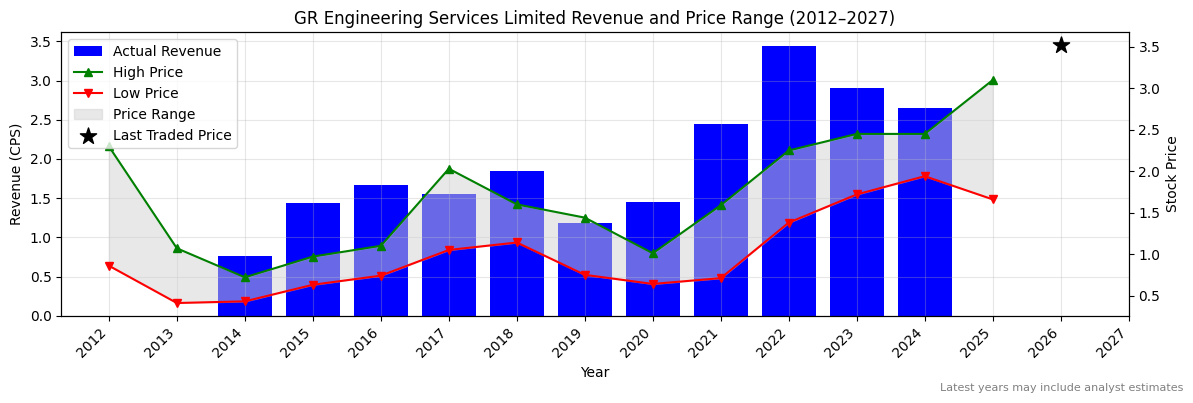
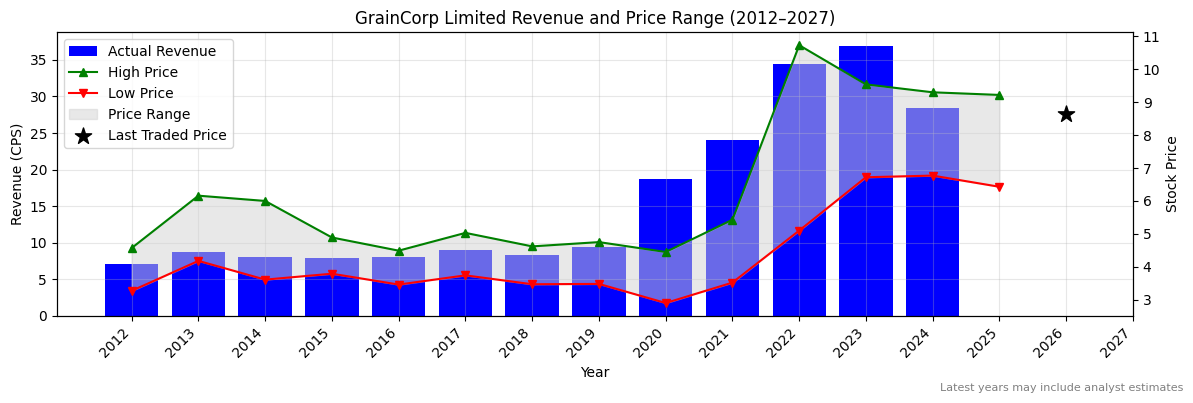
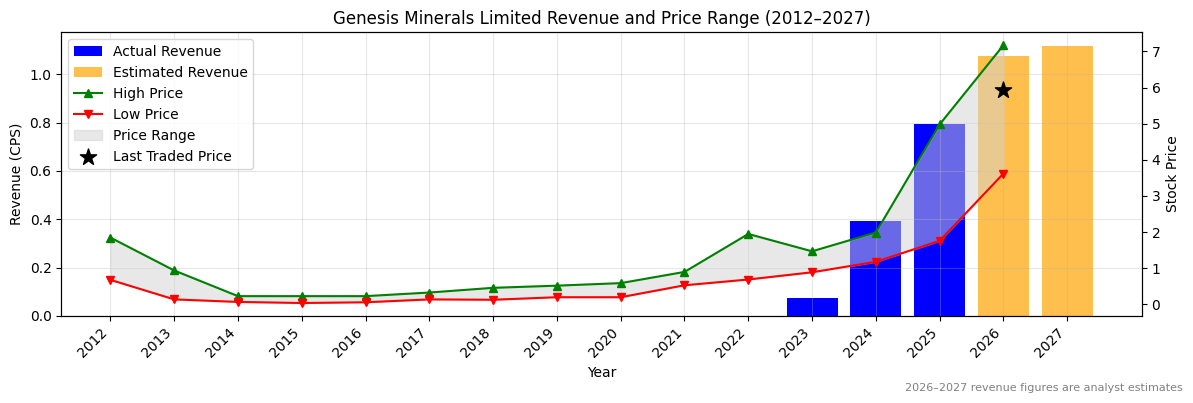
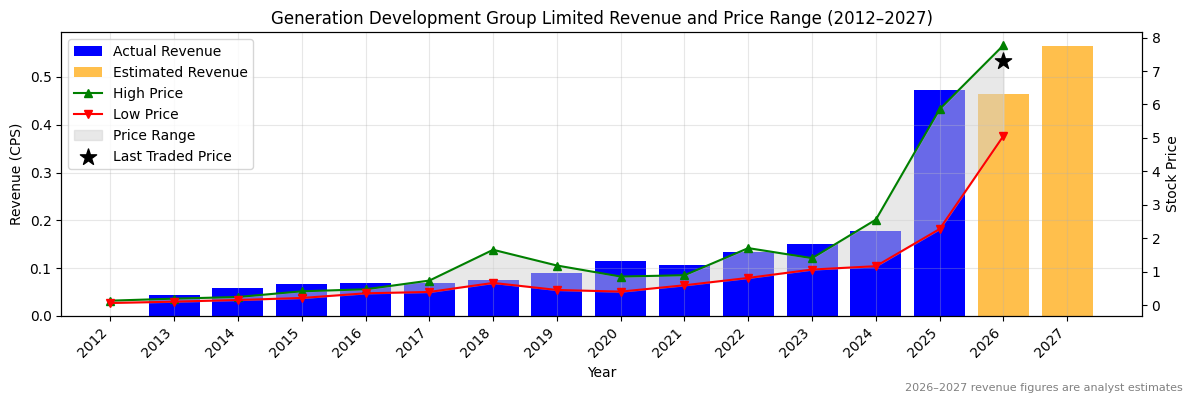
| Revenue 2024 Per Share |
Revenue 2025e Per Share |
Revenue 2026e Per Share |
Revenue 24 to 25e [%] |
Revenue 25e to 26e [%] |
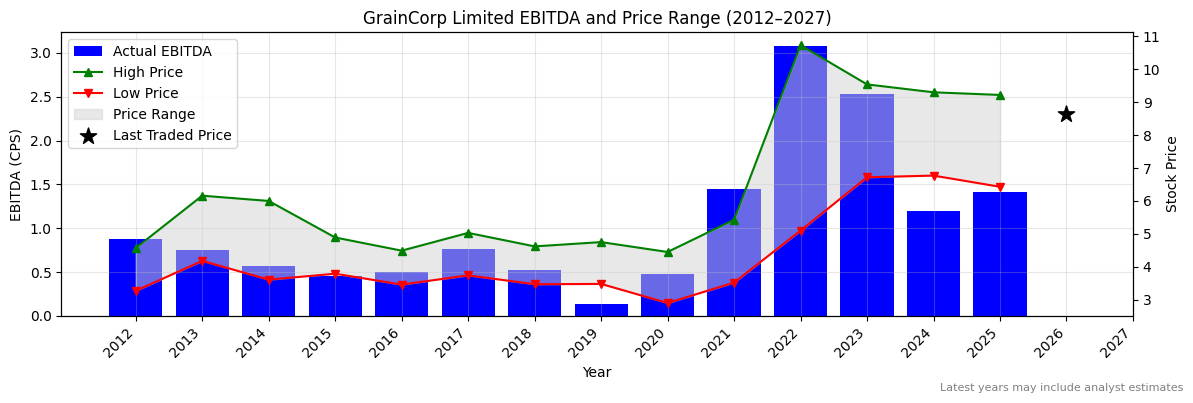
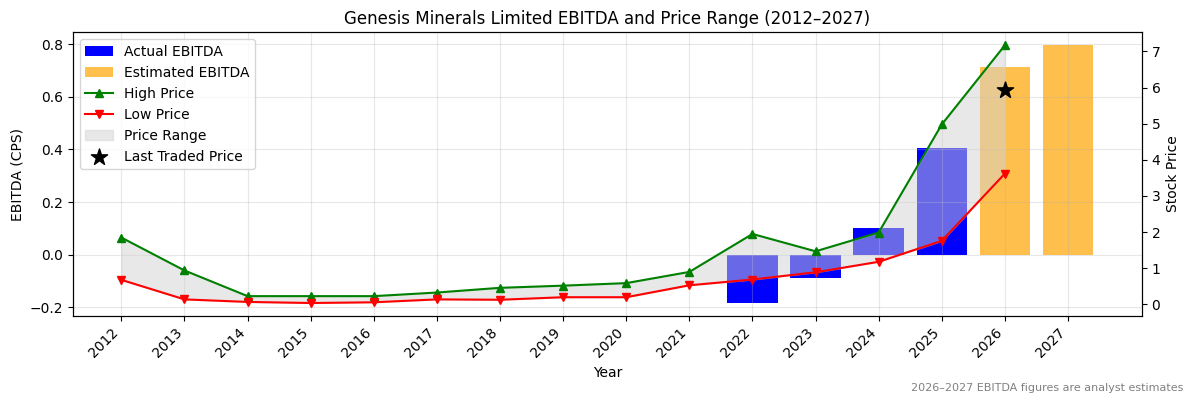
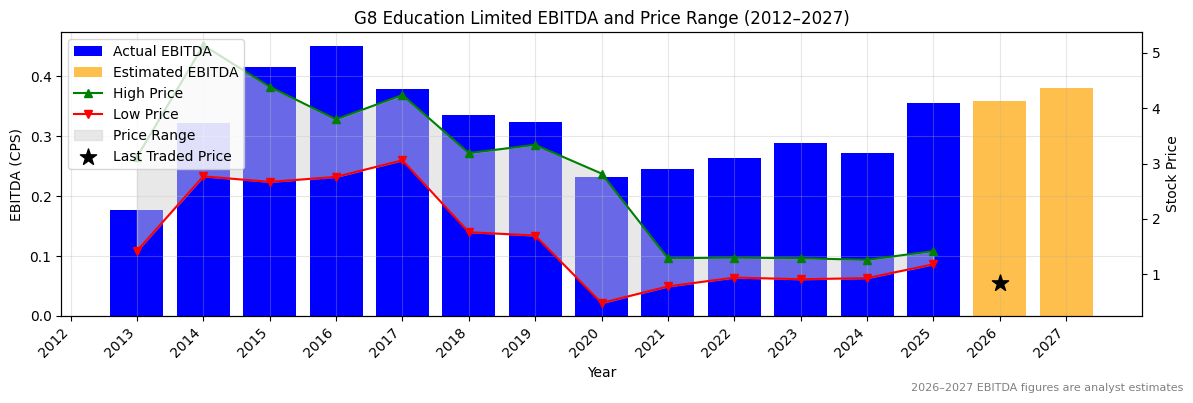
EBITDA 2024 Per Share |
EBITDA 2025e Per Share |
EBITDA 2026e Per Share |
EBITDA 24 to 25e [%] |
EBITDA 25e to 26e [%] |
| 2.6453 |
None |
None |
None |
None |
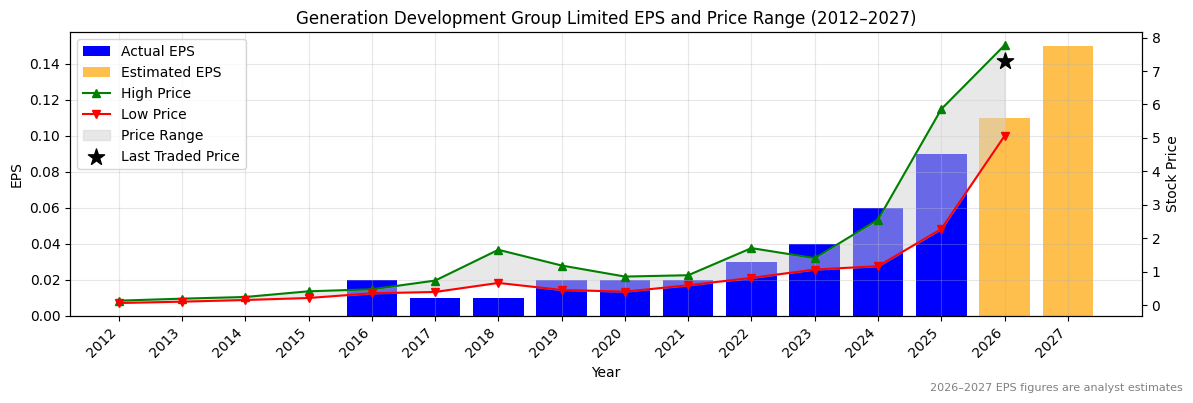
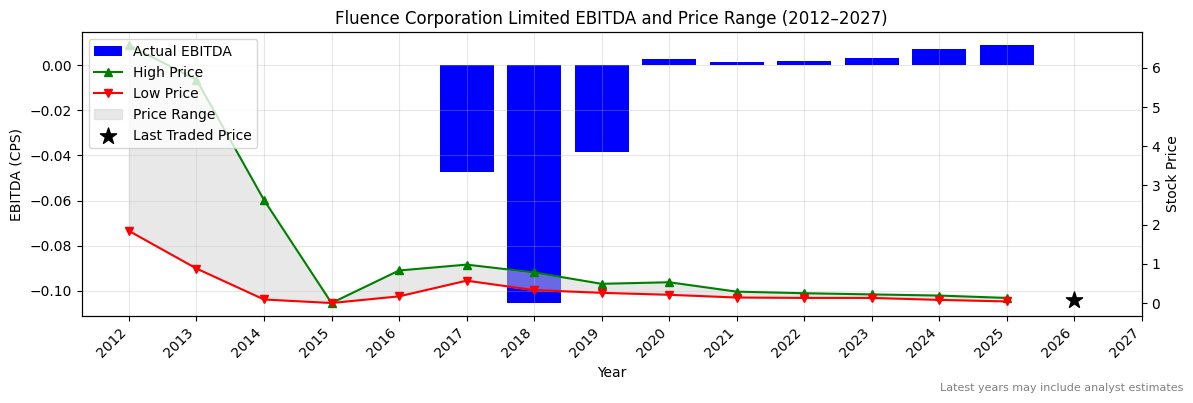
0.23188 |
0.10306 |
0.11872 |
-55.6 |
15.2 |
GNG Revenue Per Share (2012–2027)
GNG Earnings before Interest, Tax, Depreciation and Amortisation (EBITDA) Per Share (2012–2027)
❌
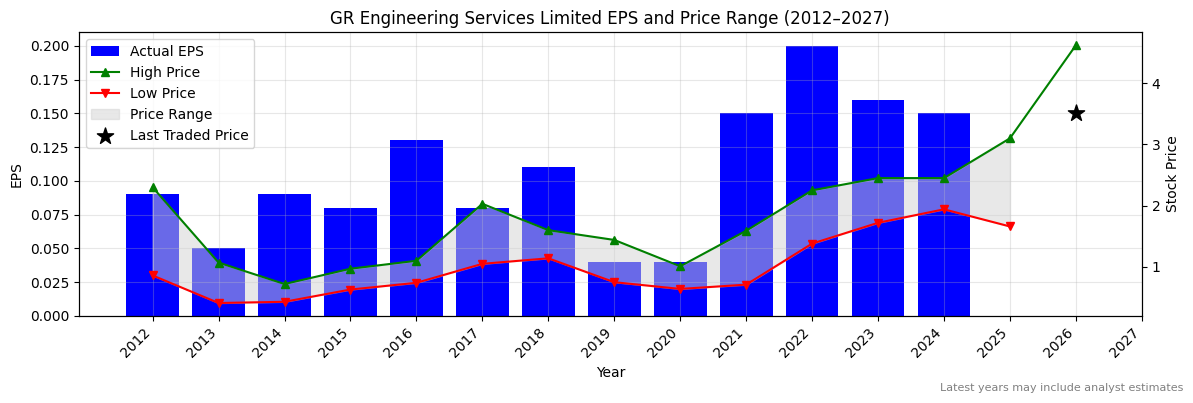
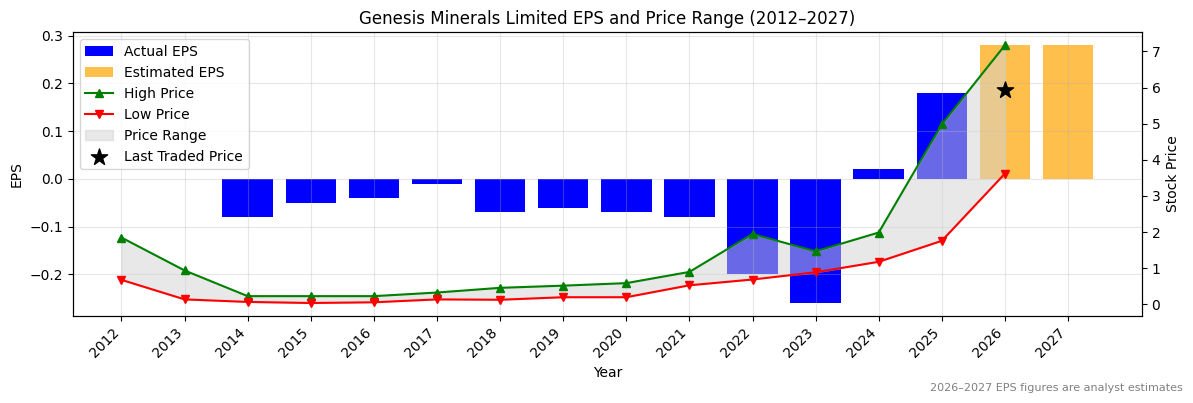
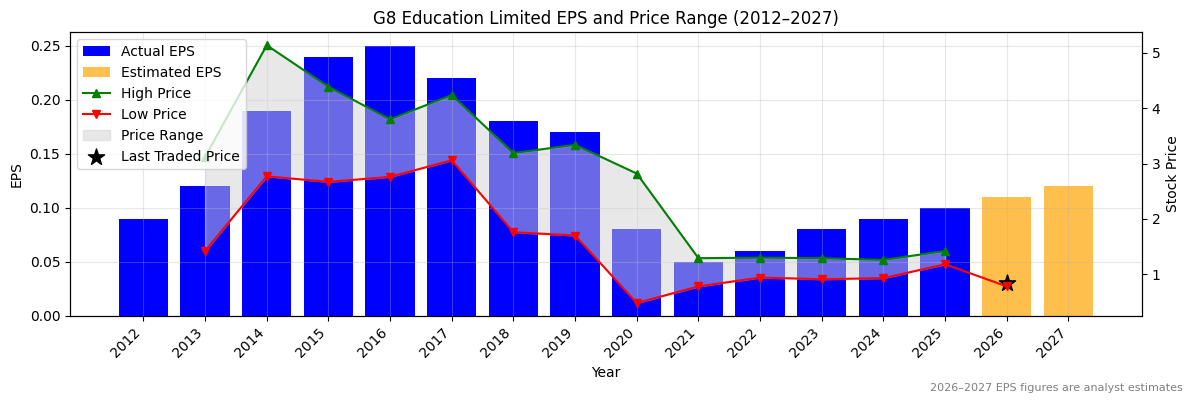
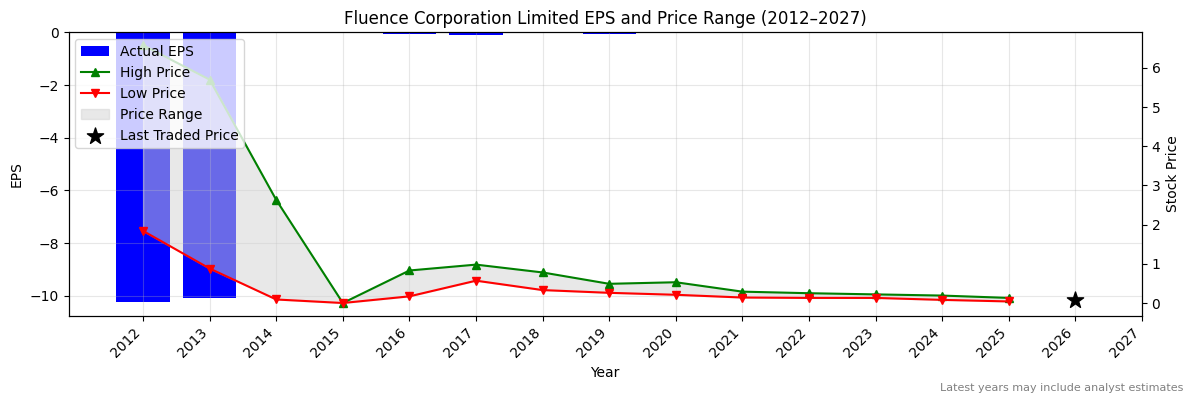
GNG Normalised Earnings Per Share (EPS) (2012–2027)
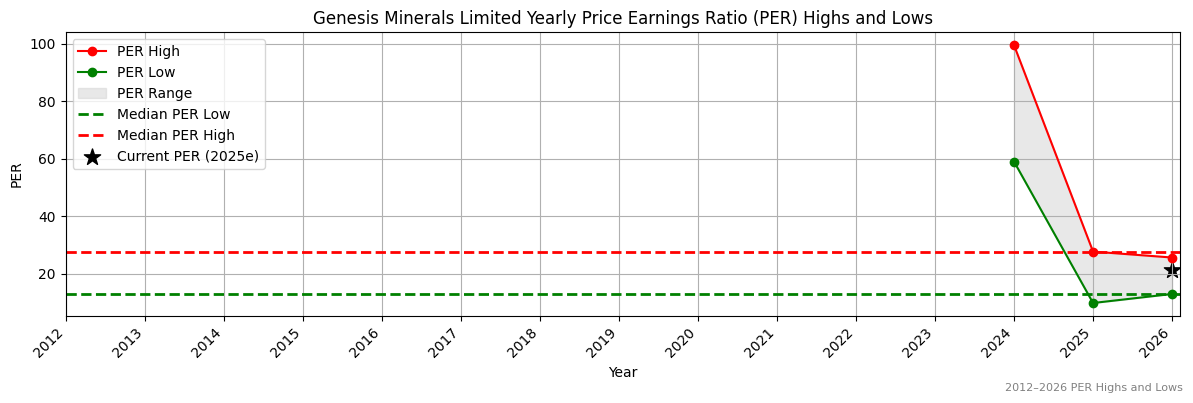
Valuation
| Price To Sales |
Price To Book |
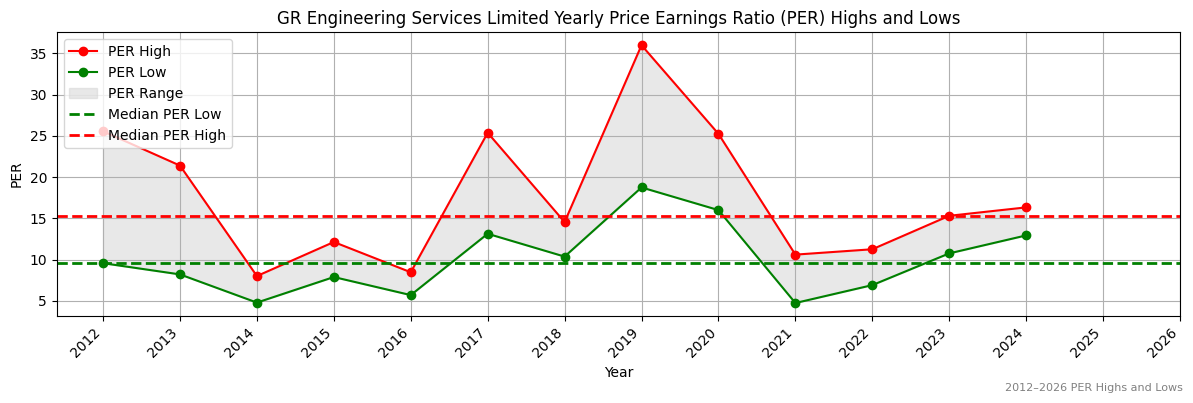
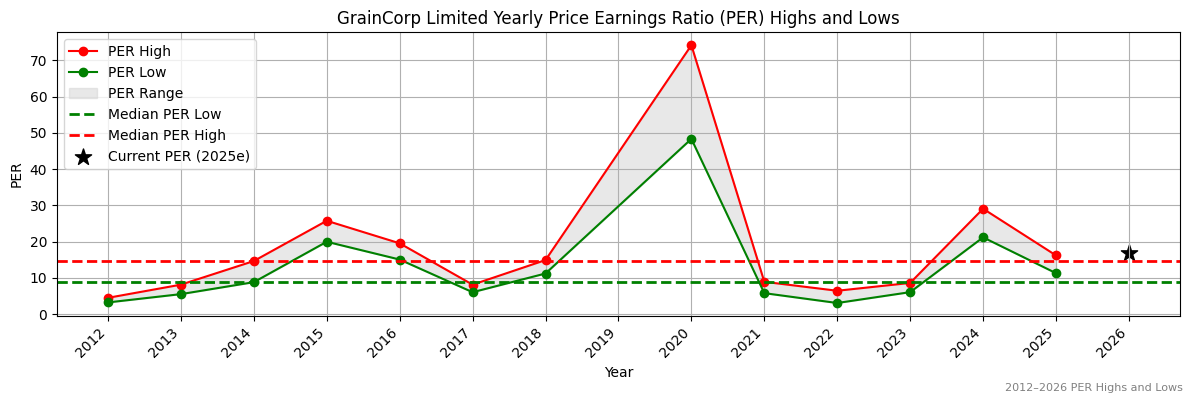
PER 2023 |
PER 2024 |
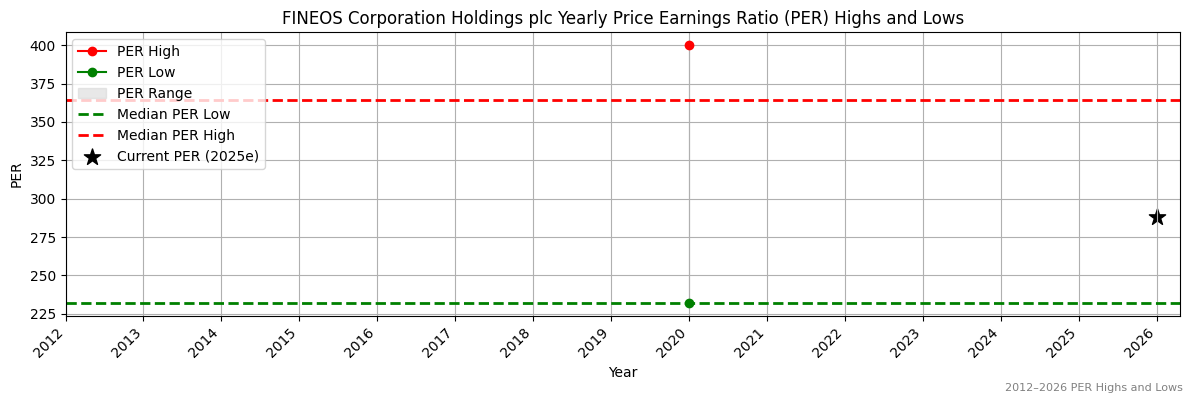
13Y Median PER Low |
PER 2025e |
13Y Median PER High |
PER 2026e |
Last Updated |
| 1.3 |
8.9 |
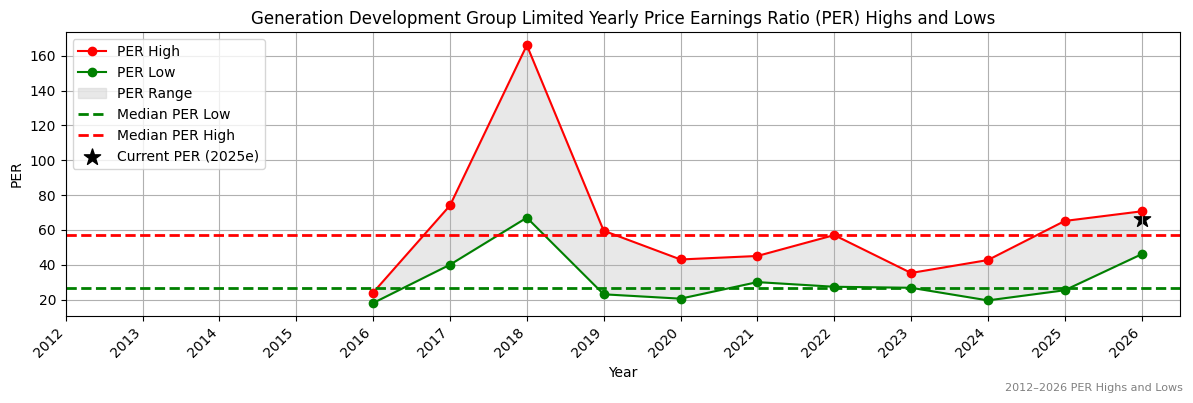
22.9 |
24.4 |
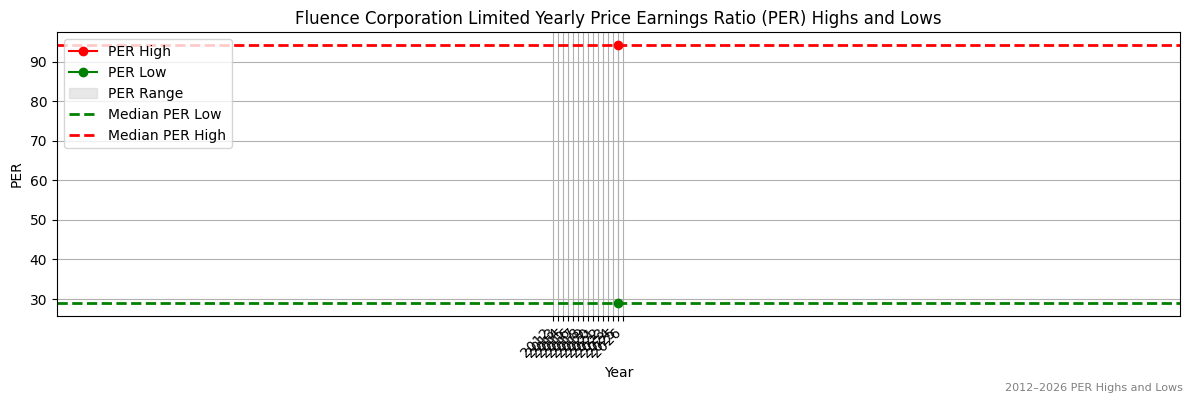
9.6 |
None |
15.3 |
None |
4/10/25 |
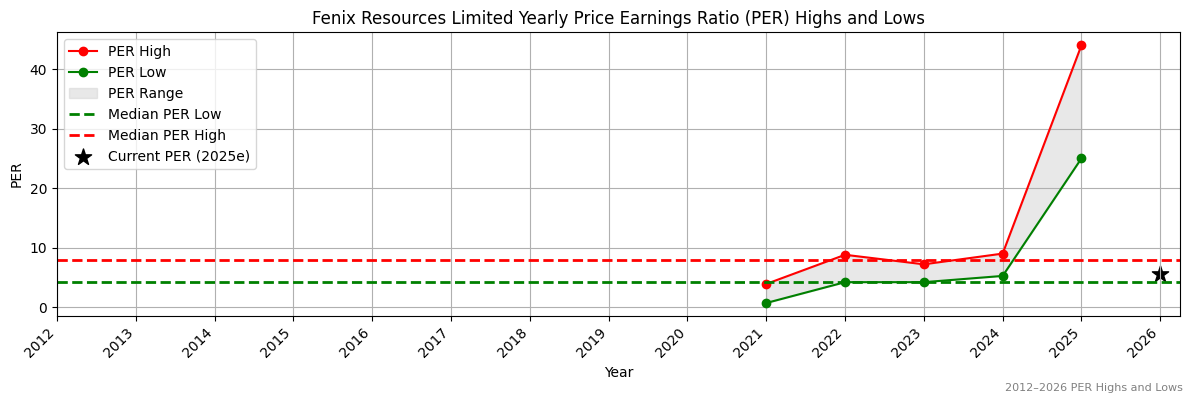
GNG Yearly Price Earnings Ratio (PER) Highs and Lows
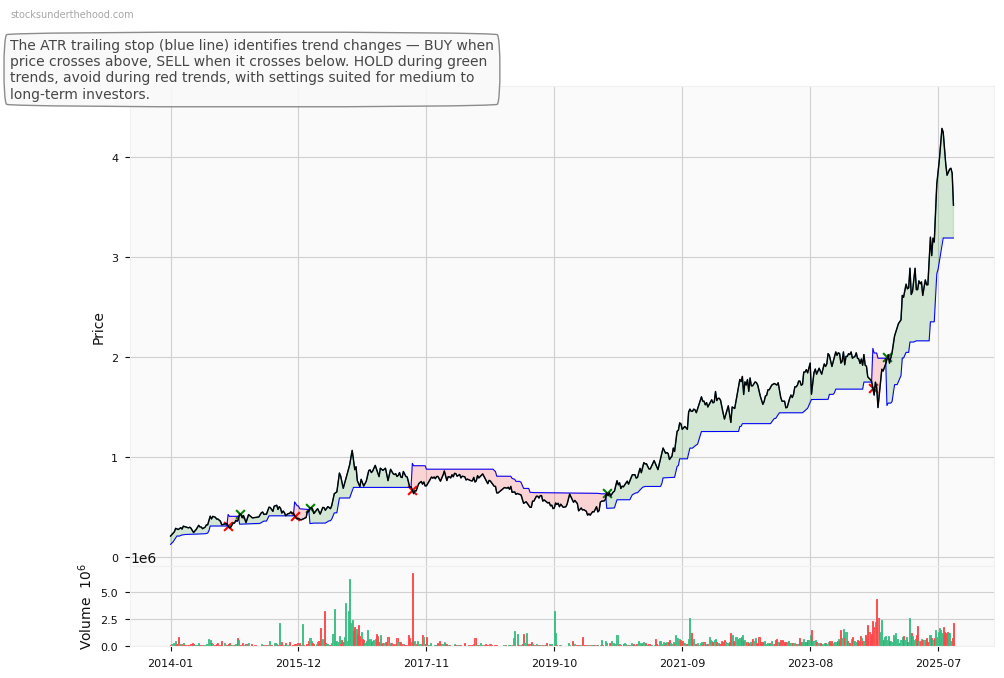
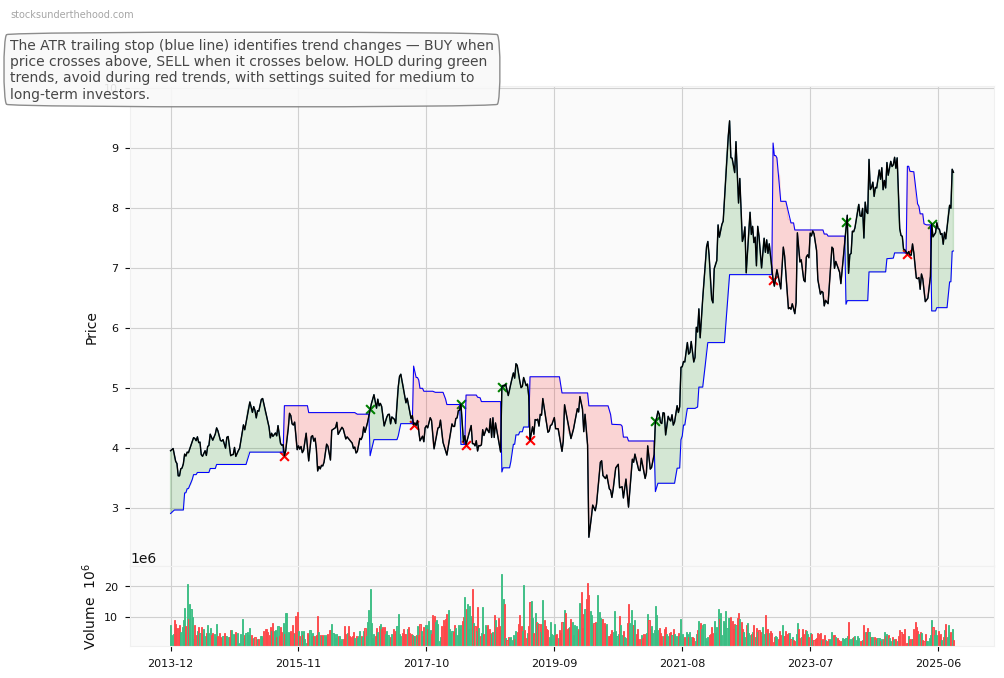
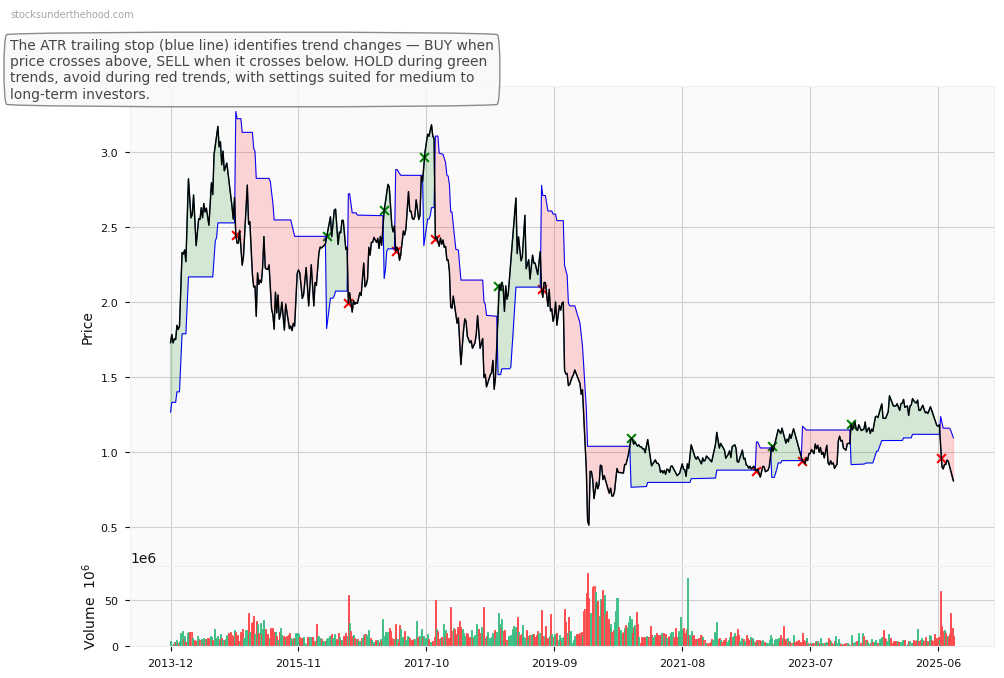
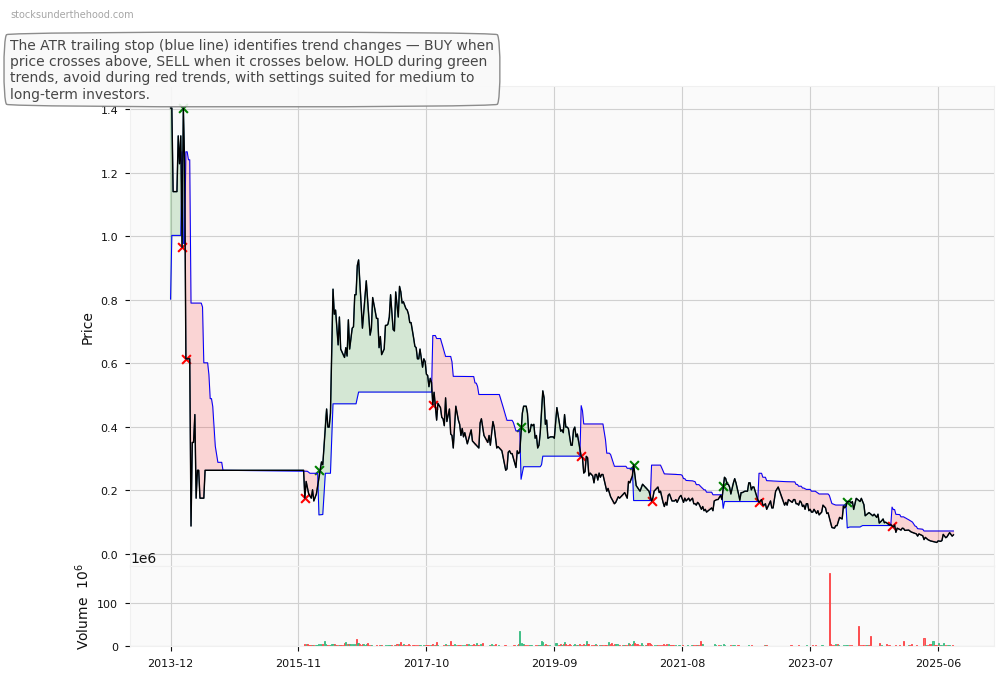
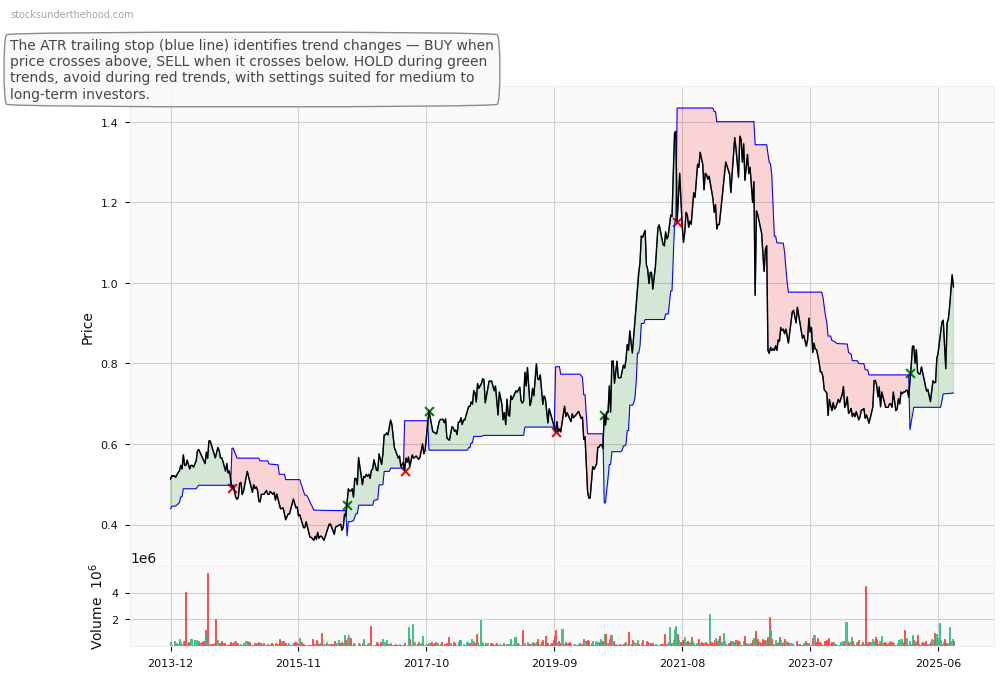
GNG Weekly Price Chart with Average True Range (ATR) Trailing Stop (10-Year View)
Ticker code: GNC
GNC Red Flags & Risk Indicators
❌
⚠️ RED FLAGS: 4 identified
- Low Operating Margin
- Falling Earnings
- More Net Debt Than Equity
- High Relative Valuation
Income Statement
| Revenue 2024 Per Share |
Revenue 2025e Per Share |
Revenue 2026e Per Share |
Revenue 24 to 25e [%] |
Revenue 25e to 26e [%] |
EBITDA 2024 Per Share |
EBITDA 2025e Per Share |
EBITDA 2026e Per Share |
EBITDA 24 to 25e [%] |
EBITDA 25e to 26e [%] |
| 28.35547 |
None |
None |
None |
None |
1.19142 |
1.41042 |
None |
18.4 |
None |
GNC Revenue Per Share (2012–2027)
GNC Earnings before Interest, Tax, Depreciation and Amortisation (EBITDA) Per Share (2012–2027)
✅
GNC Normalised Earnings Per Share (EPS) (2012–2027)
✅✅
Valuation
| Price To Sales |
Price To Book |
PER 2023 |
PER 2024 |
13Y Median PER Low |
PER 2025e |
13Y Median PER High |
PER 2026e |
Last Updated |
| 0.3 |
1.3 |
8.0 |
27.7 |
8.8 |
15.5 |
14.6 |
17.4 |
16/6/24 |
GNC Yearly Price Earnings Ratio (PER) Highs and Lows
❌
GNC Weekly Price Chart with Average True Range (ATR) Trailing Stop (10-Year View)
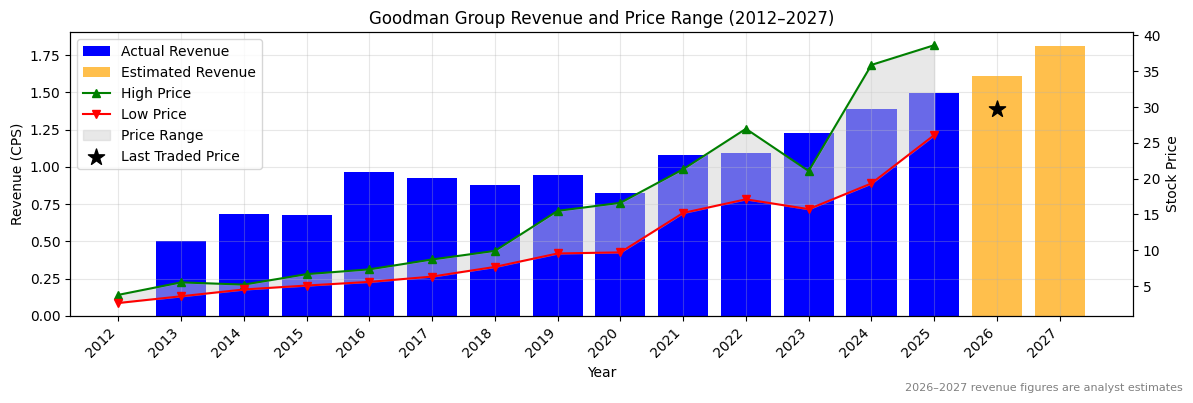
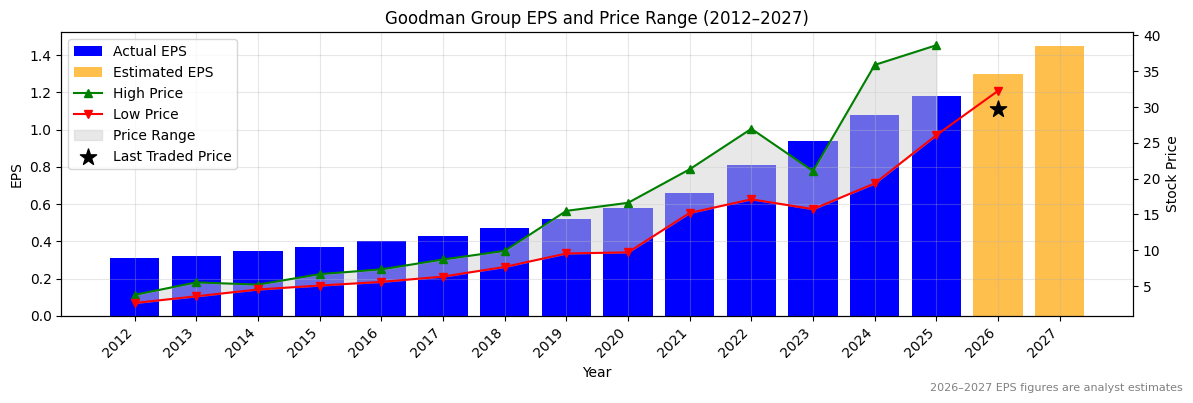
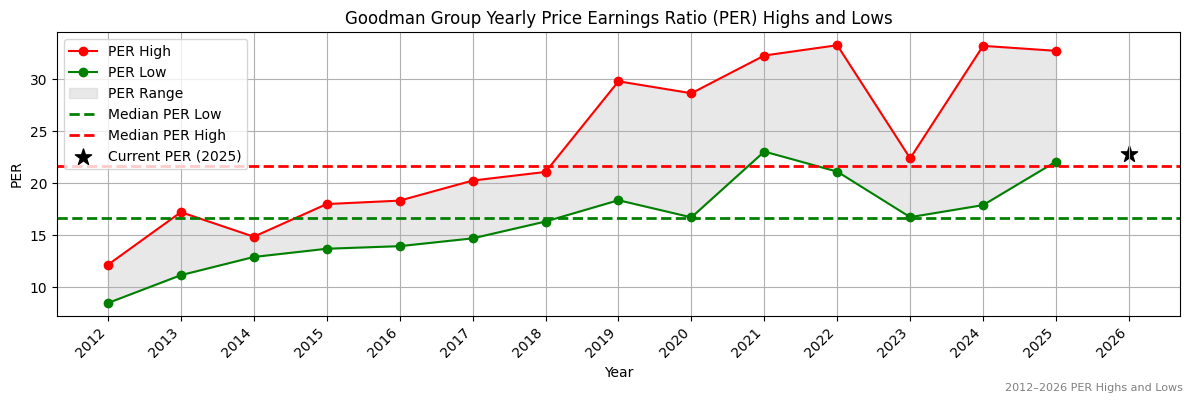
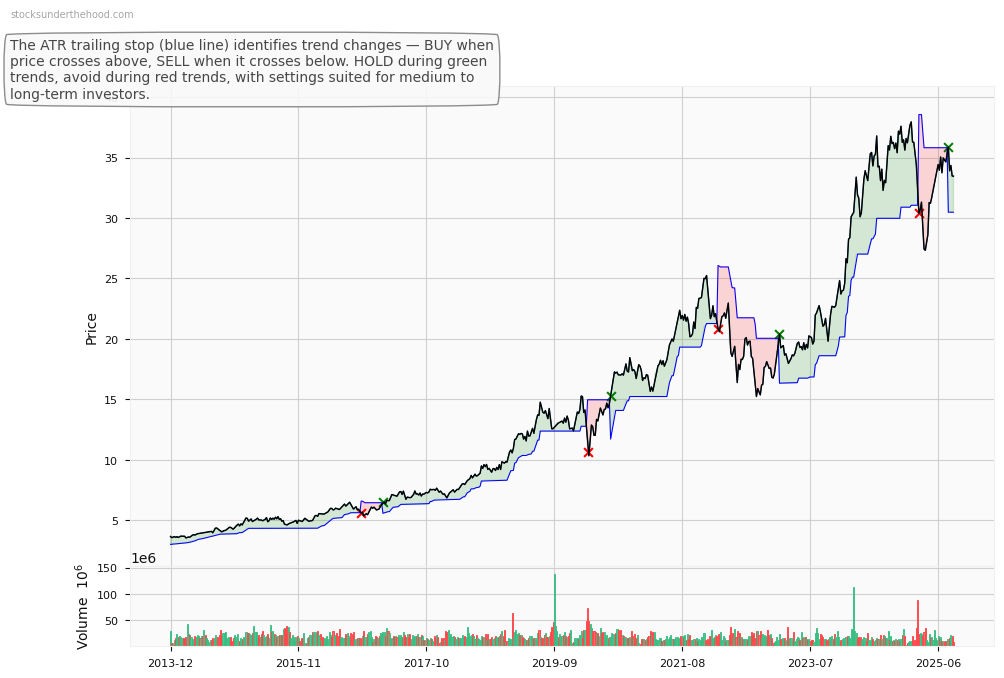
Ticker code: GMG
GMG Red Flags & Risk Indicators
⚠️
⚠️ RED FLAGS: 1 identified
Income Statement
| Revenue 2024 Per Share |
Revenue 2025e Per Share |
Revenue 2026e Per Share |
Revenue 24 to 25e [%] |
Revenue 25e to 26e [%] |
EBITDA 2024 Per Share |
EBITDA 2025e Per Share |
EBITDA 2026e Per Share |
EBITDA 24 to 25e [%] |
EBITDA 25e to 26e [%] |
| 1.387 |
1.49278 |
1.61202 |
7.6 |
8.0 |
1.19369 |
1.21626 |
1.42339 |
1.9 |
17.0 |
GMG Revenue Per Share (2012–2027)
✅
GMG Earnings before Interest, Tax, Depreciation and Amortisation (EBITDA) Per Share (2012–2027)
✅
GMG Normalised Earnings Per Share (EPS) (2012–2027)
✅
Valuation
| Price To Sales |
Price To Book |
PER 2023 |
PER 2024 |
13Y Median PER Low |
PER 2025e |
13Y Median PER High |
PER 2026e |
Last Updated |
| 19.8 |
2.9 |
35.1 |
30.6 |
16.7 |
28.0 |
21.7 |
25.4 |
11/10/25 |
GMG Yearly Price Earnings Ratio (PER) Highs and Lows
❌
GMG Weekly Price Chart with Average True Range (ATR) Trailing Stop (10-Year View)
Ticker code: GMD
GMD Red Flags & Risk Indicators
⚠️
⚠️ RED FLAGS: 2 identified
- Large Share Issuance
- Highly Shorted
Income Statement
| Revenue 2024 Per Share |
Revenue 2025e Per Share |
Revenue 2026e Per Share |
Revenue 24 to 25e [%] |
Revenue 25e to 26e [%] |
EBITDA 2024 Per Share |
EBITDA 2025e Per Share |
EBITDA 2026e Per Share |
EBITDA 24 to 25e [%] |
EBITDA 25e to 26e [%] |
| 0.39092 |
0.79363 |
1.07671 |
103.0 |
35.7 |
0.10189 |
0.40519 |
0.71434 |
297.7 |
76.3 |
GMD Revenue Per Share (2012–2027)
✅✅
GMD Earnings before Interest, Tax, Depreciation and Amortisation (EBITDA) Per Share (2012–2027)
✅✅
GMD Normalised Earnings Per Share (EPS) (2012–2027)
✅✅
Valuation
| Price To Sales |
Price To Book |
PER 2023 |
PER 2024 |
13Y Median PER Low |
PER 2025e |
13Y Median PER High |
PER 2026e |
Last Updated |
| 7.0 |
5.1 |
-21.7 |
282.0 |
12.9 |
31.3 |
27.7 |
20.1 |
4/10/25 |
GMD Yearly Price Earnings Ratio (PER) Highs and Lows
❌
GMD Weekly Price Chart with Average True Range (ATR) Trailing Stop (10-Year View)
Ticker code: GEM
GEM Red Flags & Risk Indicators
⚠️
⚠️ RED FLAGS: 2 identified
- Highly Shorted
- Increasing Shorts
Income Statement
| Revenue 2024 Per Share |
Revenue 2025e Per Share |
Revenue 2026e Per Share |
Revenue 24 to 25e [%] |
Revenue 25e to 26e [%] |
EBITDA 2024 Per Share |
EBITDA 2025e Per Share |
EBITDA 2026e Per Share |
EBITDA 24 to 25e [%] |
EBITDA 25e to 26e [%] |
| 1.26225 |
1.29569 |
1.35847 |
2.6 |
4.8 |
0.27128 |
0.35603 |
0.35858 |
31.2 |
0.7 |
GEM Revenue Per Share (2012–2027)
✅
GEM Earnings before Interest, Tax, Depreciation and Amortisation (EBITDA) Per Share (2012–2027)
✅✅
GEM Normalised Earnings Per Share (EPS) (2012–2027)
✅
Valuation
| Price To Sales |
Price To Book |
PER 2023 |
PER 2024 |
13Y Median PER Low |
PER 2025e |
13Y Median PER High |
PER 2026e |
Last Updated |
| 0.7 |
0.7 |
10.1 |
8.9 |
11.3 |
8.1 |
19.3 |
7.3 |
29/4/25 |
GEM Yearly Price Earnings Ratio (PER) Highs and Lows
✅✅
GEM Weekly Price Chart with Average True Range (ATR) Trailing Stop (10-Year View)
Ticker code: GDG
GDG Red Flags & Risk Indicators
❌
⚠️ RED FLAGS: 3 identified
- Low Operating Margin
- Falling Earnings
- High Relative Valuation
Income Statement
| Revenue 2024 Per Share |
Revenue 2025e Per Share |
Revenue 2026e Per Share |
Revenue 24 to 25e [%] |
Revenue 25e to 26e [%] |
EBITDA 2024 Per Share |
EBITDA 2025e Per Share |
EBITDA 2026e Per Share |
EBITDA 24 to 25e [%] |
EBITDA 25e to 26e [%] |
| 0.17704 |
0.47199 |
0.46435 |
166.6 |
-1.6 |
0.00201 |
0.10036 |
0.16166 |
4899.6 |
61.1 |
GDG Revenue Per Share (2012–2027)
✅✅
GDG Earnings before Interest, Tax, Depreciation and Amortisation (EBITDA) Per Share (2012–2027)
✅✅
GDG Normalised Earnings Per Share (EPS) (2012–2027)
✅✅
Valuation
| Price To Sales |
Price To Book |
PER 2023 |
PER 2024 |
13Y Median PER Low |
PER 2025e |
13Y Median PER High |
PER 2026e |
Last Updated |
| 4.6 |
4.0 |
179.0 |
119.3 |
26.8 |
79.6 |
57.0 |
65.1 |
28/9/25 |
GDG Yearly Price Earnings Ratio (PER) Highs and Lows
❌
GDG Weekly Price Chart with Average True Range (ATR) Trailing Stop (10-Year View)
Ticker code: GAL
GAL Red Flags & Risk Indicators
✅
⚠️ RED FLAGS: 0 identified
No red flags detected.
Income Statement
| Revenue 2024 Per Share |
Revenue 2025e Per Share |
Revenue 2026e Per Share |
Revenue 24 to 25e [%] |
Revenue 25e to 26e [%] |
EBITDA 2024 Per Share |
EBITDA 2025e Per Share |
EBITDA 2026e Per Share |
EBITDA 24 to 25e [%] |
EBITDA 25e to 26e [%] |
| None |
None |
None |
None |
None |
None |
None |
None |
None |
None |
GAL Revenue Per Share (2012–2027)
GAL Earnings before Interest, Tax, Depreciation and Amortisation (EBITDA) Per Share (2012–2027)
GAL Normalised Earnings Per Share (EPS) (2012–2027)
Valuation
| Price To Sales |
Price To Book |
PER 2023 |
PER 2024 |
13Y Median PER Low |
PER 2025e |
13Y Median PER High |
PER 2026e |
Last Updated |
| 78.3 |
0.9 |
None |
None |
None |
None |
None |
None |
None |
GAL Yearly Price Earnings Ratio (PER) Highs and Lows
GAL Weekly Price Chart with Average True Range (ATR) Trailing Stop (10-Year View)
Ticker code: FWD
FWD Red Flags & Risk Indicators
⚠️
⚠️ RED FLAGS: 1 identified
Income Statement
| Revenue 2024 Per Share |
Revenue 2025e Per Share |
Revenue 2026e Per Share |
Revenue 24 to 25e [%] |
Revenue 25e to 26e [%] |
EBITDA 2024 Per Share |
EBITDA 2025e Per Share |
EBITDA 2026e Per Share |
EBITDA 24 to 25e [%] |
EBITDA 25e to 26e [%] |
| 4.45999 |
5.41951 |
5.71391 |
21.5 |
5.4 |
0.26249 |
0.58657 |
0.65888 |
123.5 |
12.3 |
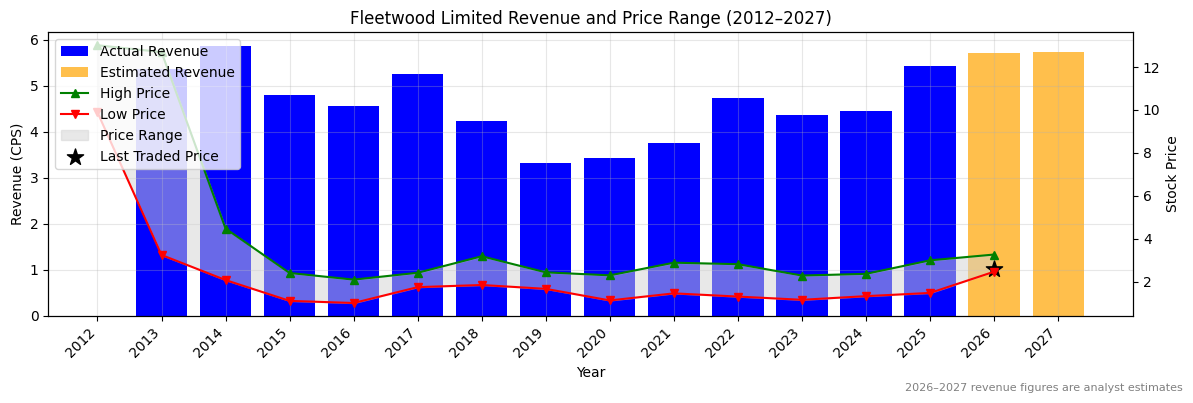
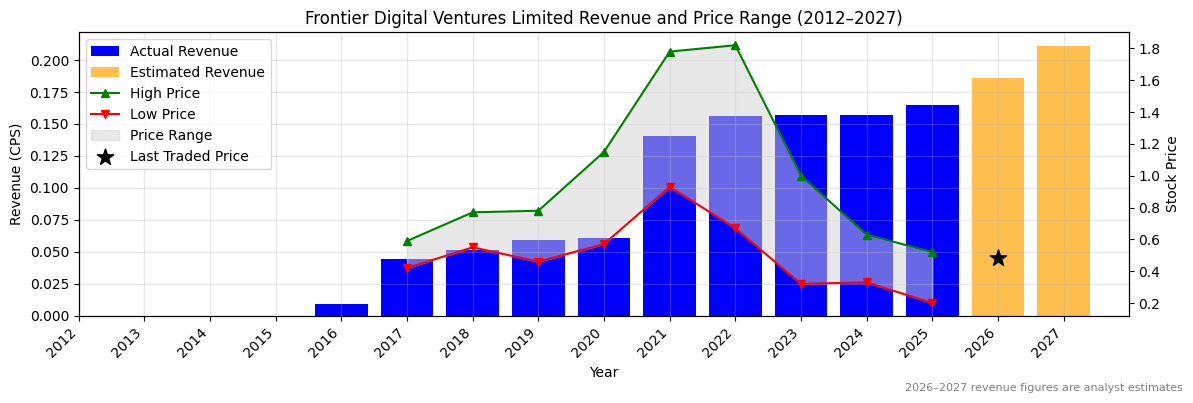
FWD Revenue Per Share (2012–2027)
✅✅
FWD Earnings before Interest, Tax, Depreciation and Amortisation (EBITDA) Per Share (2012–2027)
✅✅
FWD Normalised Earnings Per Share (EPS) (2012–2027)
✅✅
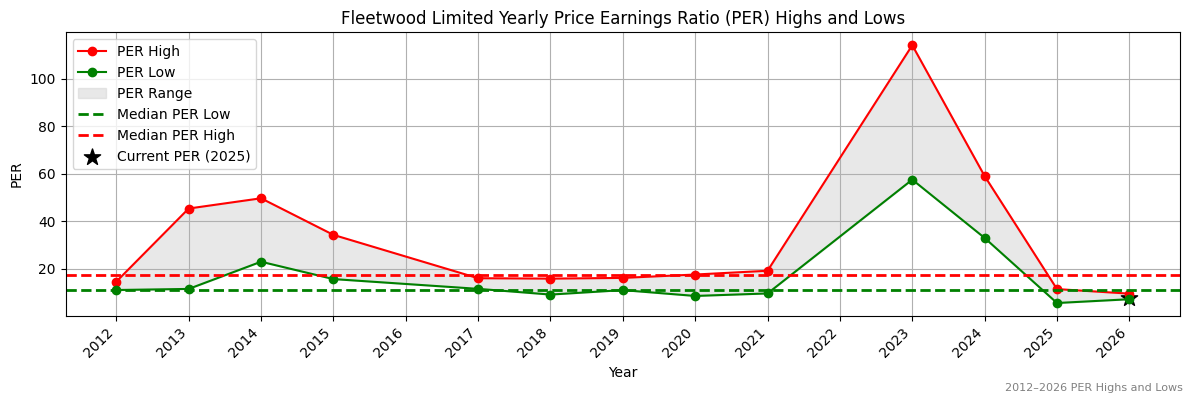
Valuation
| Price To Sales |
Price To Book |
PER 2023 |
PER 2024 |
13Y Median PER Low |
PER 2025e |
13Y Median PER High |
PER 2026e |
Last Updated |
| 0.5 |
1.6 |
147.5 |
73.8 |
11.1 |
11.3 |
17.6 |
8.7 |
4/10/25 |
FWD Yearly Price Earnings Ratio (PER) Highs and Lows
✅
FWD Weekly Price Chart with Average True Range (ATR) Trailing Stop (10-Year View)
Ticker code: FPR
FPR Red Flags & Risk Indicators
✅
⚠️ RED FLAGS: 0 identified
No red flags detected.
Income Statement
| Revenue 2024 Per Share |
Revenue 2025e Per Share |
Revenue 2026e Per Share |
Revenue 24 to 25e [%] |
Revenue 25e to 26e [%] |
EBITDA 2024 Per Share |
EBITDA 2025e Per Share |
EBITDA 2026e Per Share |
EBITDA 24 to 25e [%] |
EBITDA 25e to 26e [%] |
| None |
None |
None |
None |
None |
None |
None |
None |
None |
None |
FPR Revenue Per Share (2012–2027)
FPR Earnings before Interest, Tax, Depreciation and Amortisation (EBITDA) Per Share (2012–2027)
FPR Normalised Earnings Per Share (EPS) (2012–2027)
Valuation
| Price To Sales |
Price To Book |
PER 2023 |
PER 2024 |
13Y Median PER Low |
PER 2025e |
13Y Median PER High |
PER 2026e |
Last Updated |
| 0.8 |
1.1 |
None |
None |
None |
None |
None |
None |
None |
FPR Yearly Price Earnings Ratio (PER) Highs and Lows
FPR Weekly Price Chart with Average True Range (ATR) Trailing Stop (10-Year View)
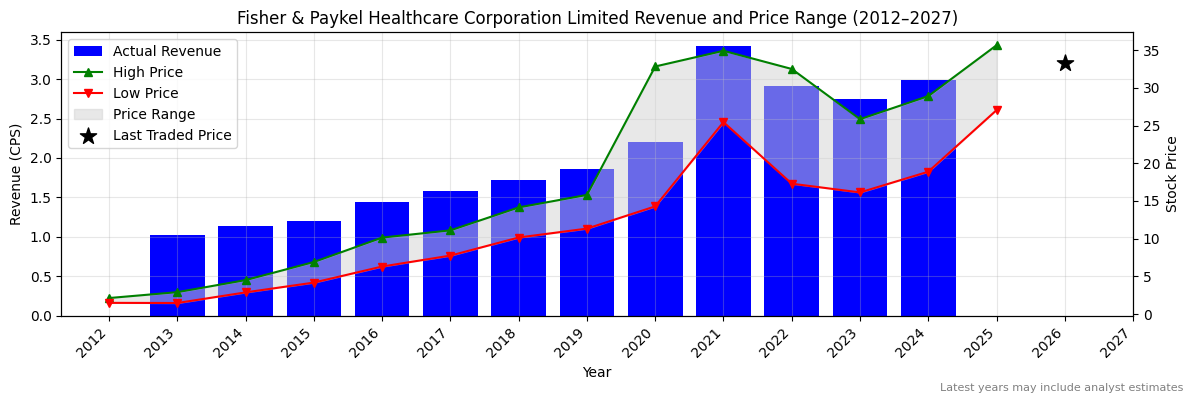
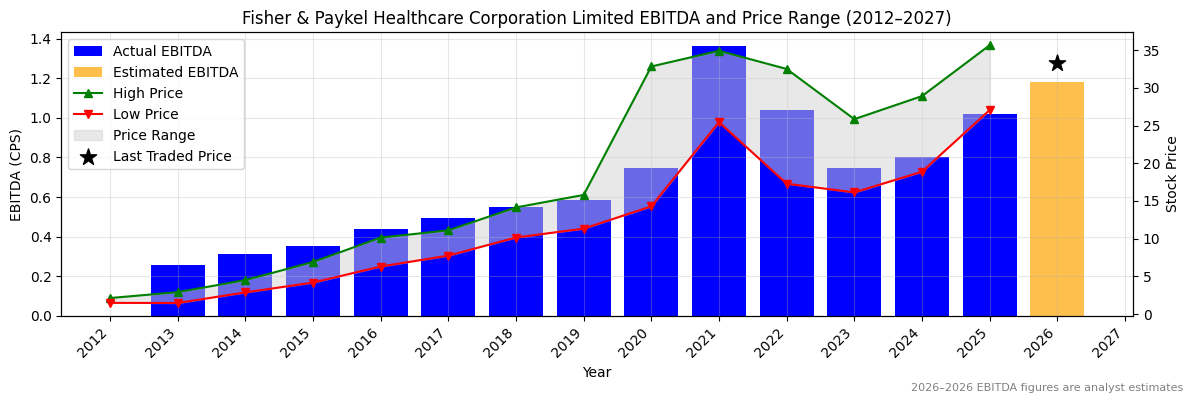
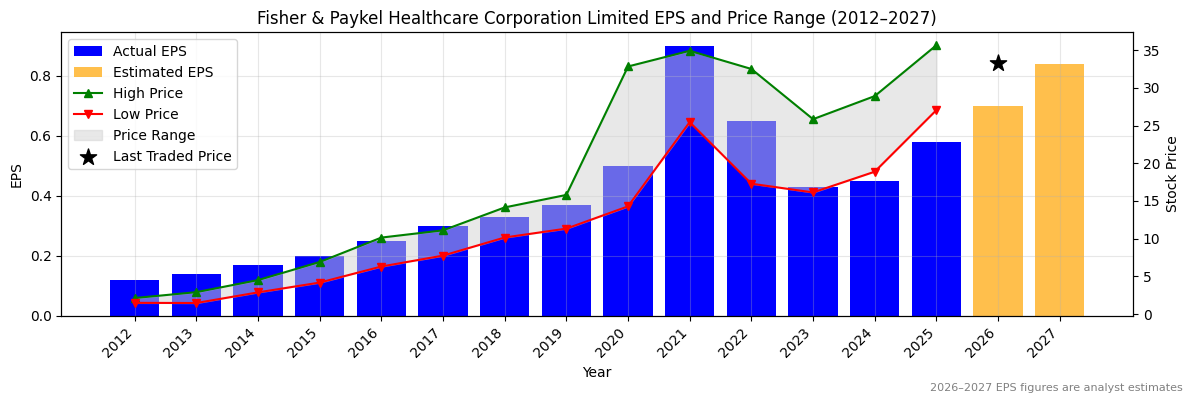
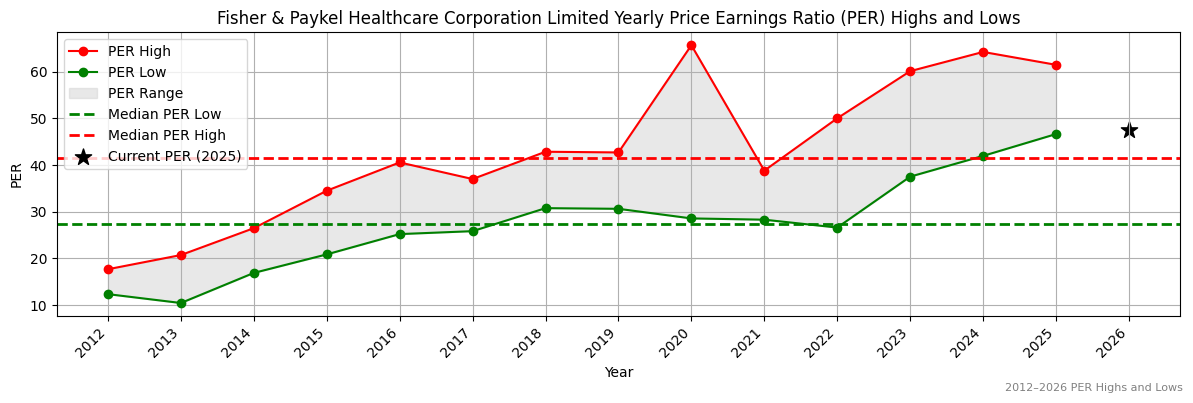
Ticker code: FPH
FPH Red Flags & Risk Indicators
⚠️
⚠️ RED FLAGS: 2 identified
- Falling Earnings
- High Relative Valuation
Income Statement
| Revenue 2024 Per Share |
Revenue 2025e Per Share |
Revenue 2026e Per Share |
Revenue 24 to 25e [%] |
Revenue 25e to 26e [%] |
EBITDA 2024 Per Share |
EBITDA 2025e Per Share |
EBITDA 2026e Per Share |
EBITDA 24 to 25e [%] |
EBITDA 25e to 26e [%] |
| 2.98426 |
None |
None |
None |
None |
0.80086 |
1.01702 |
1.1849 |
27.0 |
16.5 |
FPH Revenue Per Share (2012–2027)
FPH Earnings before Interest, Tax, Depreciation and Amortisation (EBITDA) Per Share (2012–2027)
✅✅
FPH Normalised Earnings Per Share (EPS) (2012–2027)
✅✅
Valuation
| Price To Sales |
Price To Book |
PER 2023 |
PER 2024 |
13Y Median PER Low |
PER 2025e |
13Y Median PER High |
PER 2026e |
Last Updated |
| 9.5 |
10.0 |
75.2 |
71.8 |
27.4 |
55.7 |
41.6 |
46.2 |
24/8/24 |
FPH Yearly Price Earnings Ratio (PER) Highs and Lows
❌
FPH Weekly Price Chart with Average True Range (ATR) Trailing Stop (10-Year View)
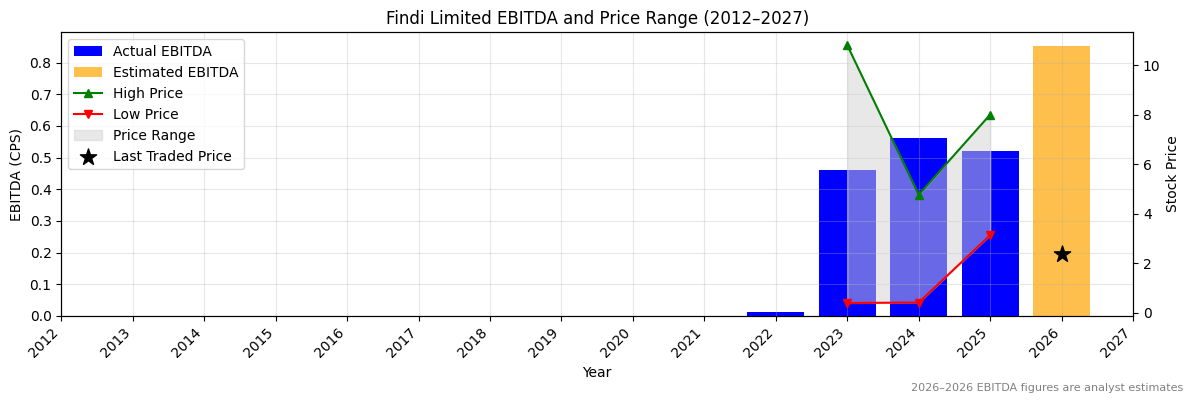
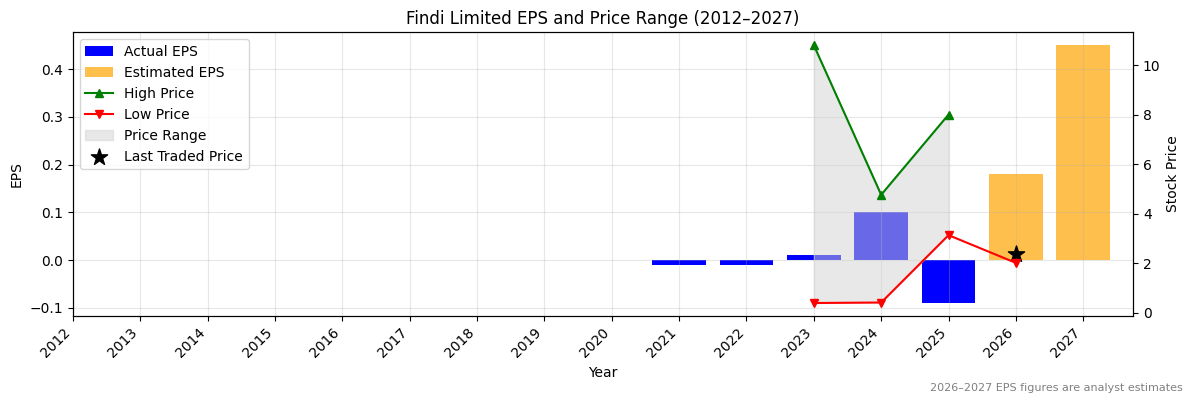
Ticker code: FND
FND Red Flags & Risk Indicators
❌
⚠️ RED FLAGS: 4 identified
- Increasing Shorts
- Falling Earnings
- More Net Debt Than Equity
- Falling EBITDA Margins
Income Statement
| Revenue 2024 Per Share |
Revenue 2025e Per Share |
Revenue 2026e Per Share |
Revenue 24 to 25e [%] |
Revenue 25e to 26e [%] |
EBITDA 2024 Per Share |
EBITDA 2025e Per Share |
EBITDA 2026e Per Share |
EBITDA 24 to 25e [%] |
EBITDA 25e to 26e [%] |
| 1.36066 |
1.35809 |
2.4862 |
-0.2 |
83.1 |
0.56105 |
0.52145 |
0.85273 |
-7.1 |
63.5 |
FND Revenue Per Share (2012–2027)
❌
FND Earnings before Interest, Tax, Depreciation and Amortisation (EBITDA) Per Share (2012–2027)
❌
FND Normalised Earnings Per Share (EPS) (2012–2027)
❌
Valuation
| Price To Sales |
Price To Book |
PER 2023 |
PER 2024 |
13Y Median PER Low |
PER 2025e |
13Y Median PER High |
PER 2026e |
Last Updated |
| 1.9 |
1.8 |
187.0 |
18.7 |
10.4 |
-20.8 |
563.8 |
10.4 |
28/12/24 |
FND Yearly Price Earnings Ratio (PER) Highs and Lows
✅✅
FND Weekly Price Chart with Average True Range (ATR) Trailing Stop (10-Year View)
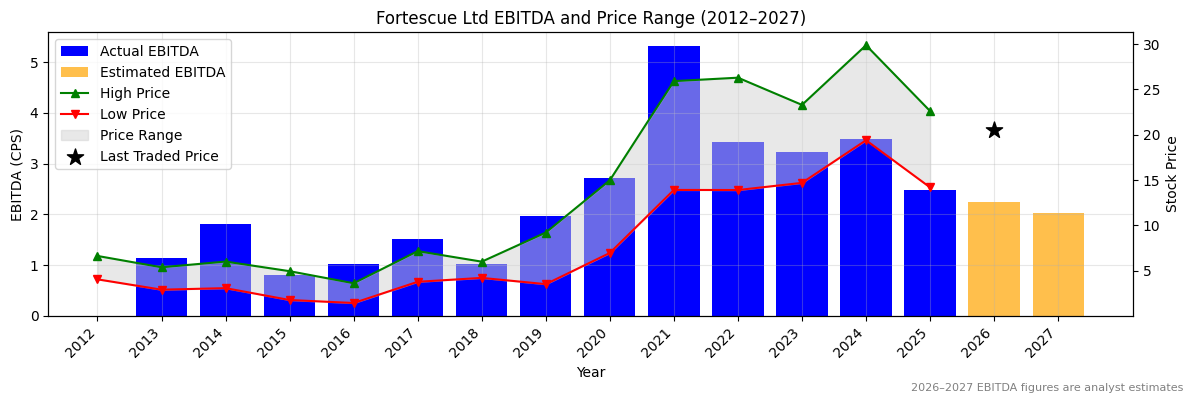
Ticker code: FMG
FMG Red Flags & Risk Indicators
❌
⚠️ RED FLAGS: 4 identified
- Falling Earnings
- Falling Revenues
- High Relative Valuation
- Falling EBITDA Margins
Income Statement
| Revenue 2024 Per Share |
Revenue 2025e Per Share |
Revenue 2026e Per Share |
Revenue 24 to 25e [%] |
Revenue 25e to 26e [%] |
EBITDA 2024 Per Share |
EBITDA 2025e Per Share |
EBITDA 2026e Per Share |
EBITDA 24 to 25e [%] |
EBITDA 25e to 26e [%] |
| 5.91751 |
4.97157 |
4.72017 |
-16.0 |
-5.1 |
3.47775 |
2.57908 |
2.50808 |
-25.8 |
-2.8 |
FMG Revenue Per Share (2012–2027)
❌
FMG Earnings before Interest, Tax, Depreciation and Amortisation (EBITDA) Per Share (2012–2027)
❌
FMG Normalised Earnings Per Share (EPS) (2012–2027)
❌
Valuation
| Price To Sales |
Price To Book |
PER 2023 |
PER 2024 |
13Y Median PER Low |
PER 2025e |
13Y Median PER High |
PER 2026e |
Last Updated |
| 4.2 |
3.3 |
11.8 |
11.6 |
6.3 |
19.4 |
12.1 |
22.9 |
31/10/25 |
FMG Yearly Price Earnings Ratio (PER) Highs and Lows
❌
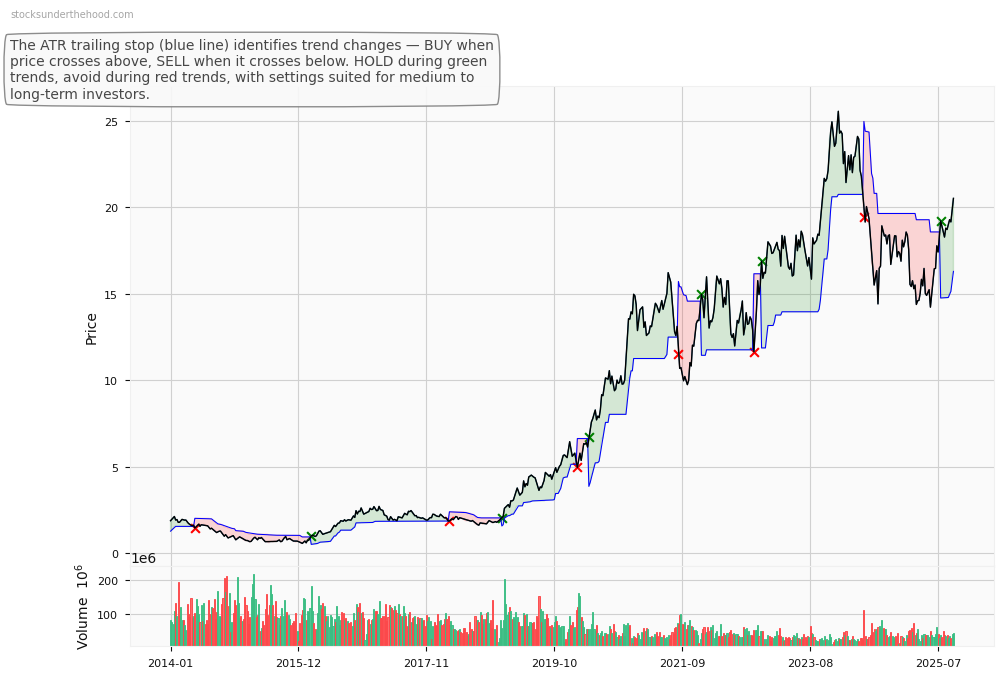
FMG Weekly Price Chart with Average True Range (ATR) Trailing Stop (10-Year View)
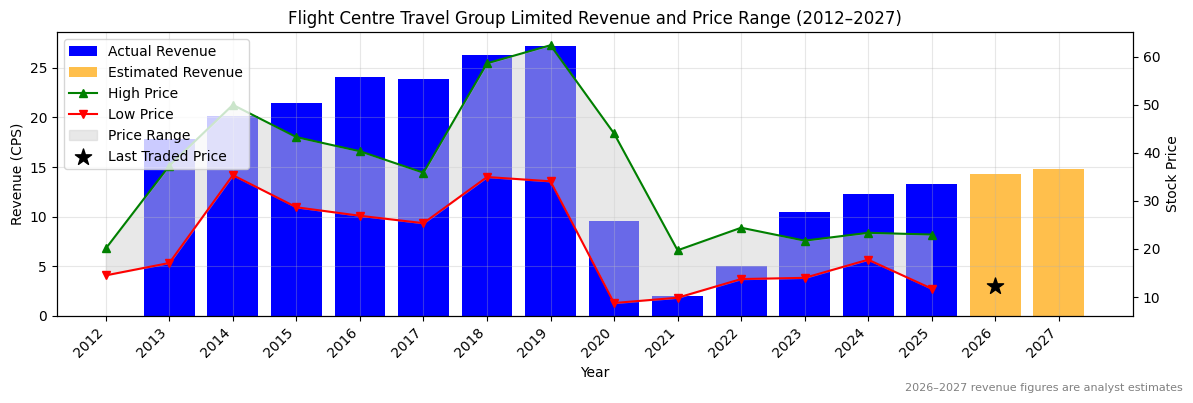
Ticker code: FLT
FLT Red Flags & Risk Indicators
⚠️
⚠️ RED FLAGS: 2 identified
- Low Operating Margin
- Highly Shorted
Income Statement
| Revenue 2024 Per Share |
Revenue 2025e Per Share |
Revenue 2026e Per Share |
Revenue 24 to 25e [%] |
Revenue 25e to 26e [%] |
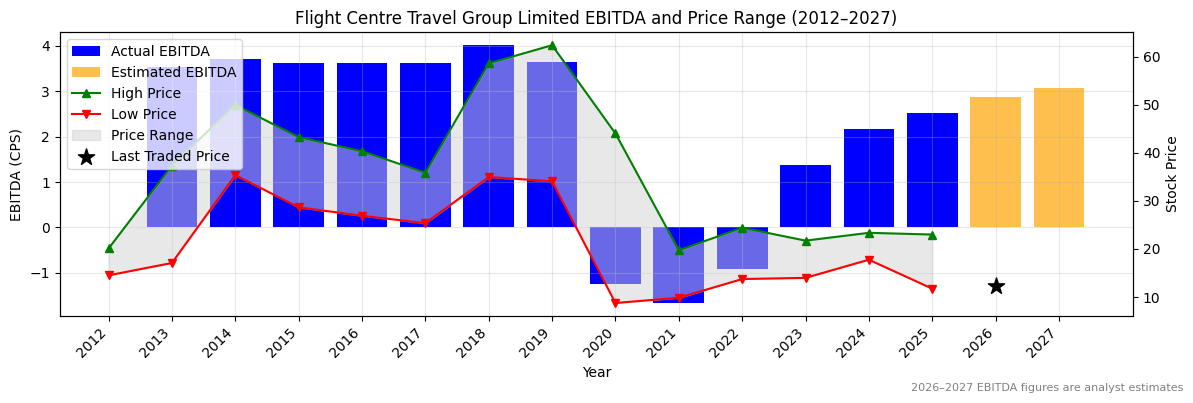
EBITDA 2024 Per Share |
EBITDA 2025e Per Share |
EBITDA 2026e Per Share |
EBITDA 24 to 25e [%] |
EBITDA 25e to 26e [%] |
| 12.27033 |
13.30024 |
14.28871 |
8.4 |
7.4 |
2.16349 |
2.5203 |
2.88156 |
16.5 |
14.3 |
FLT Revenue Per Share (2012–2027)
✅
FLT Earnings before Interest, Tax, Depreciation and Amortisation (EBITDA) Per Share (2012–2027)
✅
FLT Normalised Earnings Per Share (EPS) (2012–2027)
❌
Valuation
| Price To Sales |
Price To Book |
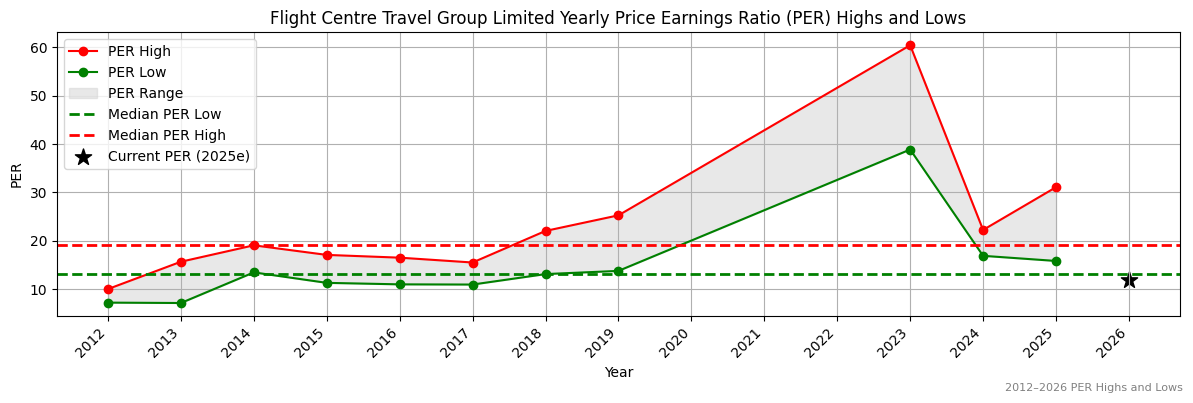
PER 2023 |
PER 2024 |
13Y Median PER Low |
PER 2025e |
13Y Median PER High |
PER 2026e |
Last Updated |
| 0.9 |
2.2 |
34.2 |
11.7 |
13.2 |
16.6 |
19.1 |
12.0 |
19/11/24 |
FLT Yearly Price Earnings Ratio (PER) Highs and Lows
✅
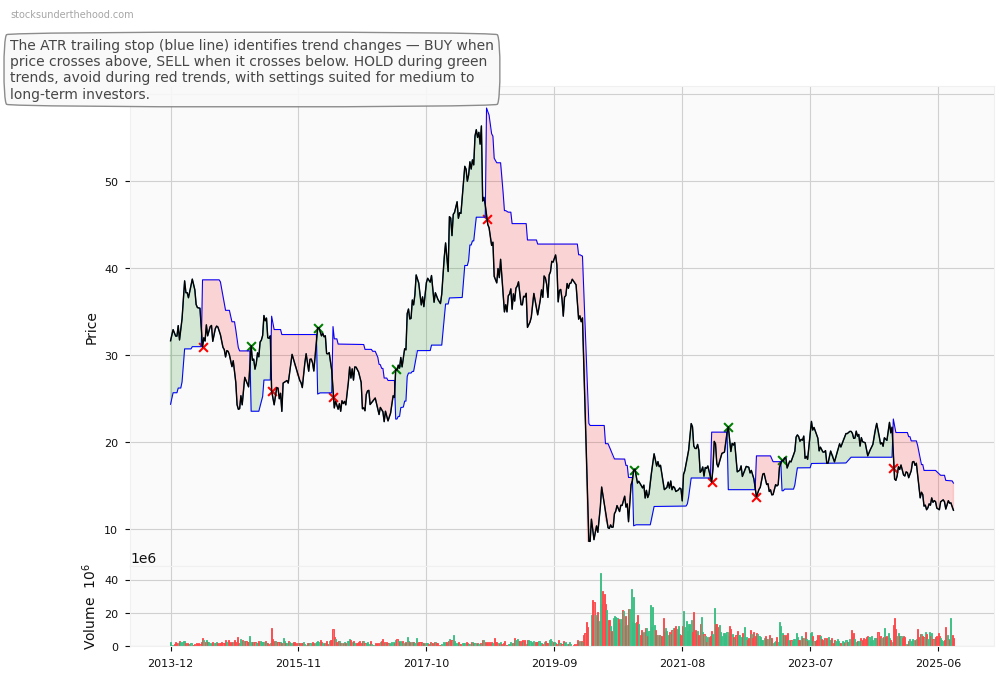
FLT Weekly Price Chart with Average True Range (ATR) Trailing Stop (10-Year View)
Ticker code: FLC
FLC Red Flags & Risk Indicators
❌
⚠️ RED FLAGS: 7 identified
- Negative Operating Cash Flow
- Large Share Issuance
- Low Operating Margin
- Negative Equity
- Falling Earnings
- High Relative Valuation
- Risk Of Capital Raise
Income Statement
| Revenue 2024 Per Share |
Revenue 2025e Per Share |
Revenue 2026e Per Share |
Revenue 24 to 25e [%] |
Revenue 25e to 26e [%] |
EBITDA 2024 Per Share |
EBITDA 2025e Per Share |
EBITDA 2026e Per Share |
EBITDA 24 to 25e [%] |
EBITDA 25e to 26e [%] |
| 0.07443 |
None |
None |
None |
None |
0.00734 |
0.00892 |
None |
21.5 |
None |
FLC Revenue Per Share (2012–2027)
FLC Earnings before Interest, Tax, Depreciation and Amortisation (EBITDA) Per Share (2012–2027)
✅✅
FLC Normalised Earnings Per Share (EPS) (2012–2027)
Valuation
| Price To Sales |
Price To Book |
PER 2023 |
PER 2024 |
13Y Median PER Low |
PER 2025e |
13Y Median PER High |
PER 2026e |
Last Updated |
| 2.1 |
-17.9 |
None |
None |
29.0 |
90.6 |
94.2 |
None |
30/4/24 |
FLC Yearly Price Earnings Ratio (PER) Highs and Lows
✅
FLC Weekly Price Chart with Average True Range (ATR) Trailing Stop (10-Year View)
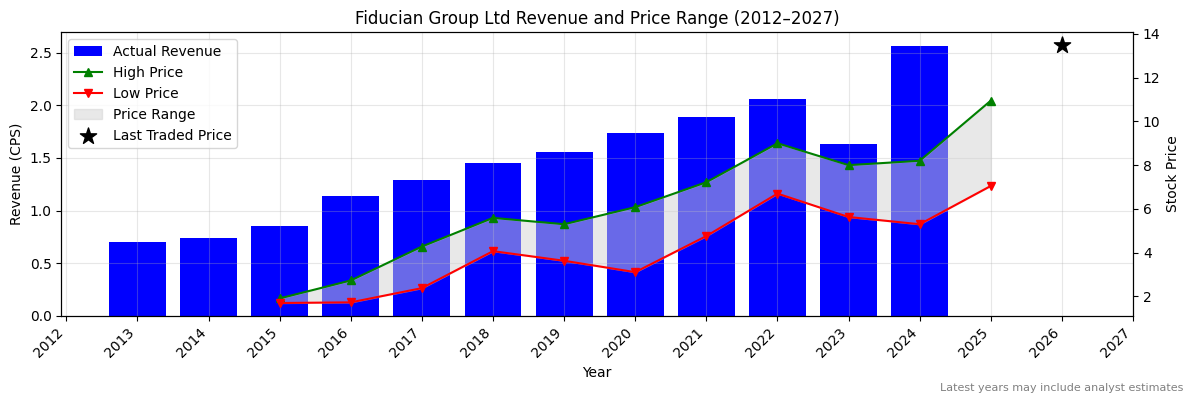
Ticker code: FID
FID Red Flags & Risk Indicators
⚠️
⚠️ RED FLAGS: 2 identified
- Increasing Shorts
- High Relative Valuation
Income Statement
| Revenue 2024 Per Share |
Revenue 2025e Per Share |
Revenue 2026e Per Share |
Revenue 24 to 25e [%] |
Revenue 25e to 26e [%] |
EBITDA 2024 Per Share |
EBITDA 2025e Per Share |
EBITDA 2026e Per Share |
EBITDA 24 to 25e [%] |
EBITDA 25e to 26e [%] |
| 2.56502 |
None |
None |
None |
None |
0.77822 |
None |
None |
None |
None |
FID Revenue Per Share (2012–2027)
FID Earnings before Interest, Tax, Depreciation and Amortisation (EBITDA) Per Share (2012–2027)
FID Normalised Earnings Per Share (EPS) (2012–2027)
❌
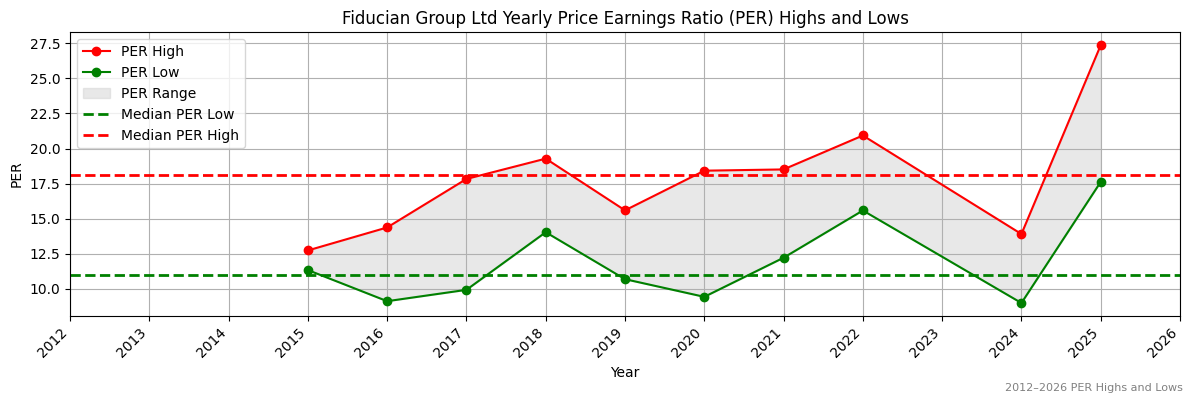
Valuation
| Price To Sales |
Price To Book |
PER 2023 |
PER 2024 |
13Y Median PER Low |
PER 2025e |
13Y Median PER High |
PER 2026e |
Last Updated |
| 4.3 |
6.4 |
None |
20.6 |
11.0 |
30.4 |
18.1 |
None |
11/10/25 |
FID Yearly Price Earnings Ratio (PER) Highs and Lows
❌
FID Weekly Price Chart with Average True Range (ATR) Trailing Stop (10-Year View)
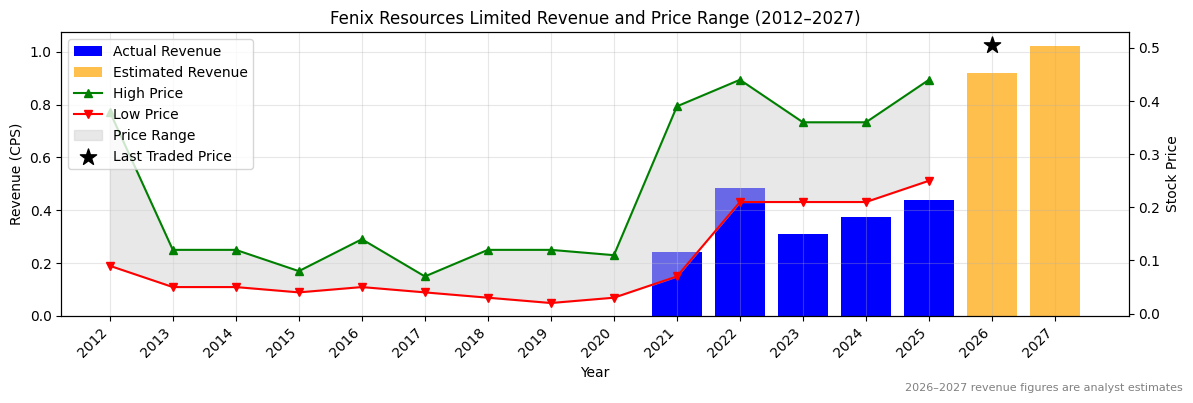
Ticker code: FEX
FEX Red Flags & Risk Indicators
❌
⚠️ RED FLAGS: 3 identified
- Increasing Shorts
- Falling Earnings
- Falling EBITDA Margins
Income Statement
| Revenue 2024 Per Share |
Revenue 2025e Per Share |
Revenue 2026e Per Share |
Revenue 24 to 25e [%] |
Revenue 25e to 26e [%] |
EBITDA 2024 Per Share |
EBITDA 2025e Per Share |
EBITDA 2026e Per Share |
EBITDA 24 to 25e [%] |
EBITDA 25e to 26e [%] |
| 0.37317 |
0.44033 |
0.91944 |
18.0 |
108.8 |
0.10501 |
0.07564 |
0.1941 |
-28.0 |
156.6 |
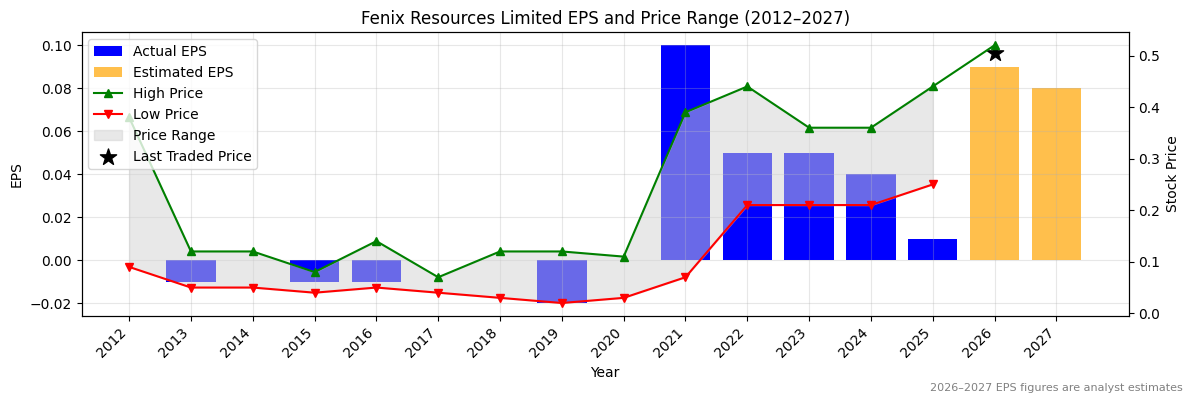
FEX Revenue Per Share (2012–2027)
✅
FEX Earnings before Interest, Tax, Depreciation and Amortisation (EBITDA) Per Share (2012–2027)
❌
FEX Normalised Earnings Per Share (EPS) (2012–2027)
❌
Valuation
| Price To Sales |
Price To Book |
PER 2023 |
PER 2024 |
13Y Median PER Low |
PER 2025e |
13Y Median PER High |
PER 2026e |
Last Updated |
| 1.2 |
2.2 |
10.5 |
13.1 |
4.2 |
52.5 |
8.0 |
5.8 |
11/10/25 |
FEX Yearly Price Earnings Ratio (PER) Highs and Lows
❌
FEX Weekly Price Chart with Average True Range (ATR) Trailing Stop (10-Year View)
Ticker code: FDV
FDV Red Flags & Risk Indicators
❌
⚠️ RED FLAGS: 3 identified
- Low Operating Margin
- Increasing Shorts
- Falling Revenues
Income Statement
| Revenue 2024 Per Share |
Revenue 2025e Per Share |
Revenue 2026e Per Share |
Revenue 24 to 25e [%] |
Revenue 25e to 26e [%] |
EBITDA 2024 Per Share |
EBITDA 2025e Per Share |
EBITDA 2026e Per Share |
EBITDA 24 to 25e [%] |
EBITDA 25e to 26e [%] |
| 0.15702 |
0.16482 |
0.18601 |
5.0 |
12.9 |
0.00413 |
0.01476 |
0.02318 |
257.5 |
57.0 |
FDV Revenue Per Share (2012–2027)
✅
FDV Earnings before Interest, Tax, Depreciation and Amortisation (EBITDA) Per Share (2012–2027)
✅✅
FDV Normalised Earnings Per Share (EPS) (2012–2027)
✅✅
Valuation
| Price To Sales |
Price To Book |
PER 2023 |
PER 2024 |
13Y Median PER Low |
PER 2025e |
13Y Median PER High |
PER 2026e |
Last Updated |
| 3.2 |
1.6 |
-24.3 |
-48.5 |
20.0 |
48.5 |
52.0 |
24.3 |
4/10/25 |
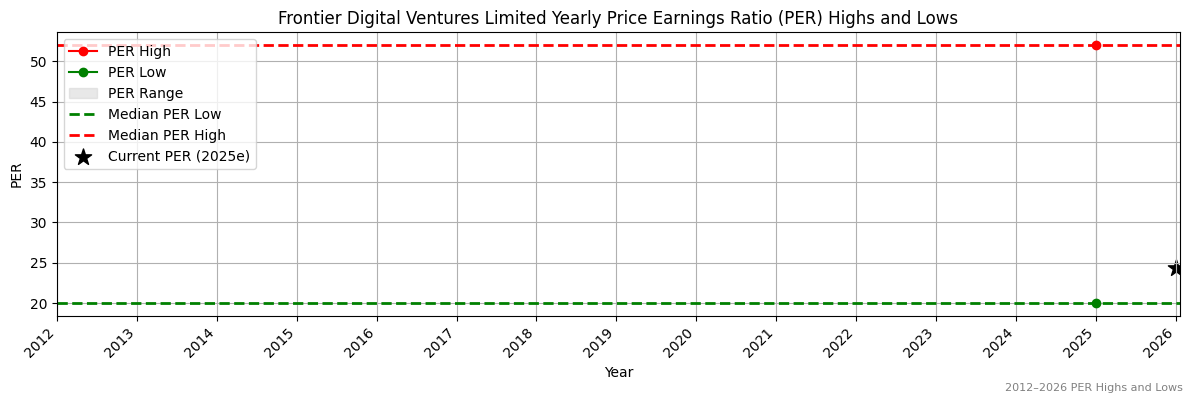
FDV Yearly Price Earnings Ratio (PER) Highs and Lows
✅
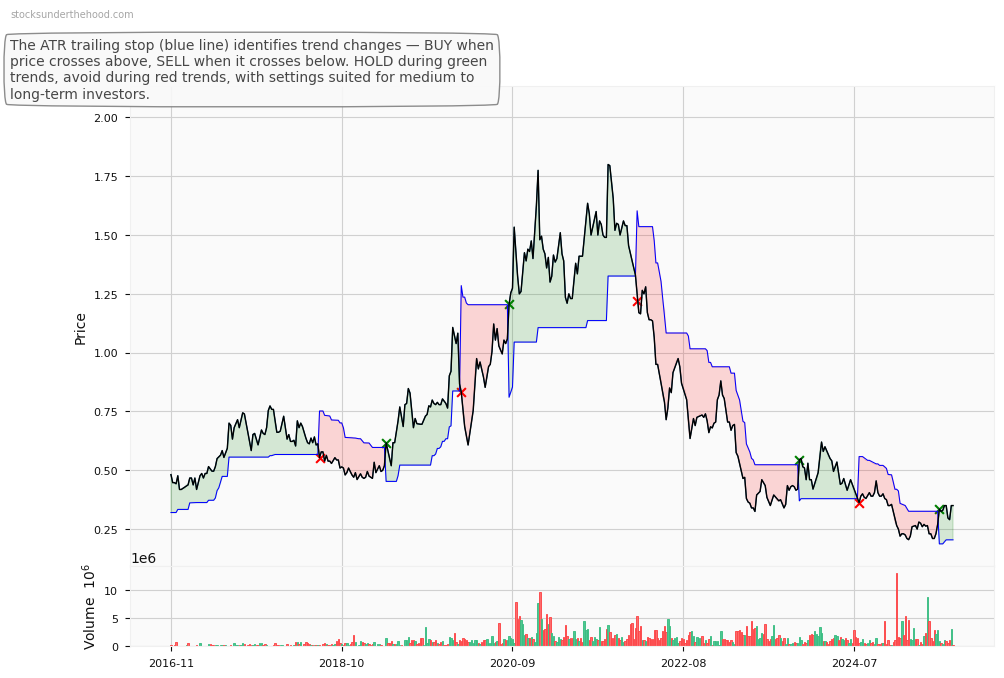
FDV Weekly Price Chart with Average True Range (ATR) Trailing Stop (10-Year View)
Ticker code: FCL
FCL Red Flags & Risk Indicators
⚠️
⚠️ RED FLAGS: 1 identified
- High Price to Book vs ROE
Income Statement
| Revenue 2024 Per Share |
Revenue 2025e Per Share |
Revenue 2026e Per Share |
Revenue 24 to 25e [%] |
Revenue 25e to 26e [%] |
EBITDA 2024 Per Share |
EBITDA 2025e Per Share |
EBITDA 2026e Per Share |
EBITDA 24 to 25e [%] |
EBITDA 25e to 26e [%] |
| 0.39377 |
0.41547 |
0.43913 |
5.5 |
5.7 |
0.05983 |
0.0866 |
0.09998 |
44.8 |
15.4 |
FCL Revenue Per Share (2012–2027)
✅
FCL Earnings before Interest, Tax, Depreciation and Amortisation (EBITDA) Per Share (2012–2027)
✅✅
FCL Normalised Earnings Per Share (EPS) (2012–2027)
✅✅
Valuation
| Price To Sales |
Price To Book |
PER 2023 |
PER 2024 |
13Y Median PER Low |
PER 2025e |
13Y Median PER High |
PER 2026e |
Last Updated |
| 7.3 |
6.4 |
None |
-96.7 |
232.0 |
None |
364.5 |
290.0 |
4/10/25 |
FCL Yearly Price Earnings Ratio (PER) Highs and Lows
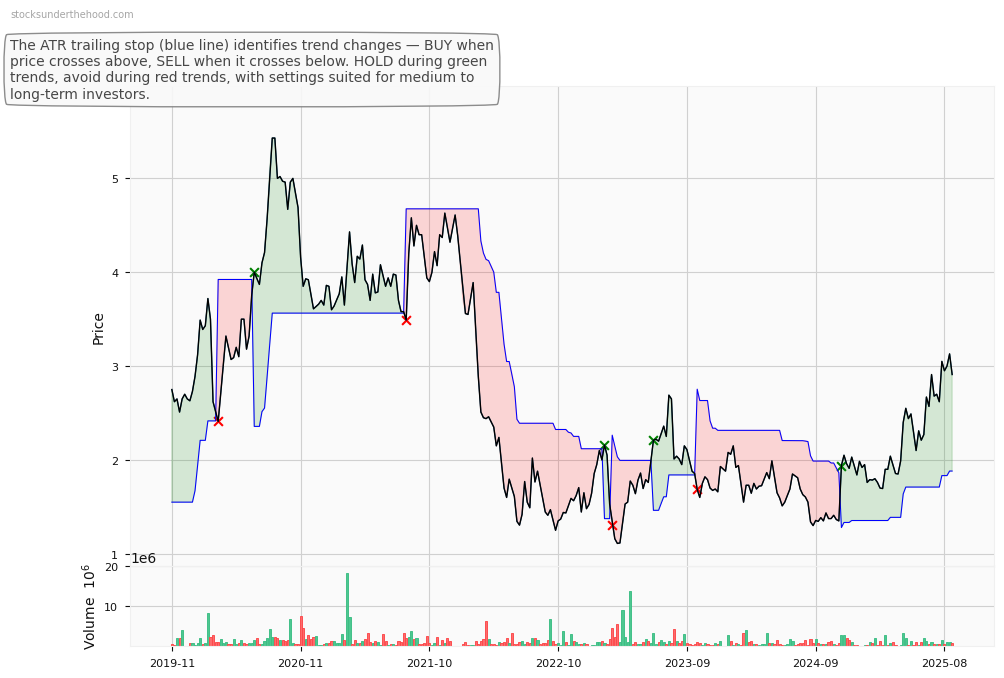
FCL Weekly Price Chart with Average True Range (ATR) Trailing Stop (10-Year View)
Ticker code: FBU
FBU Red Flags & Risk Indicators
✅
⚠️ RED FLAGS: 0 identified
No red flags detected.
Income Statement
| Revenue 2024 Per Share |
Revenue 2025e Per Share |
Revenue 2026e Per Share |
Revenue 24 to 25e [%] |
Revenue 25e to 26e [%] |
EBITDA 2024 Per Share |
EBITDA 2025e Per Share |
EBITDA 2026e Per Share |
EBITDA 24 to 25e [%] |
EBITDA 25e to 26e [%] |
| None |
None |
None |
None |
None |
None |
None |
None |
None |
None |
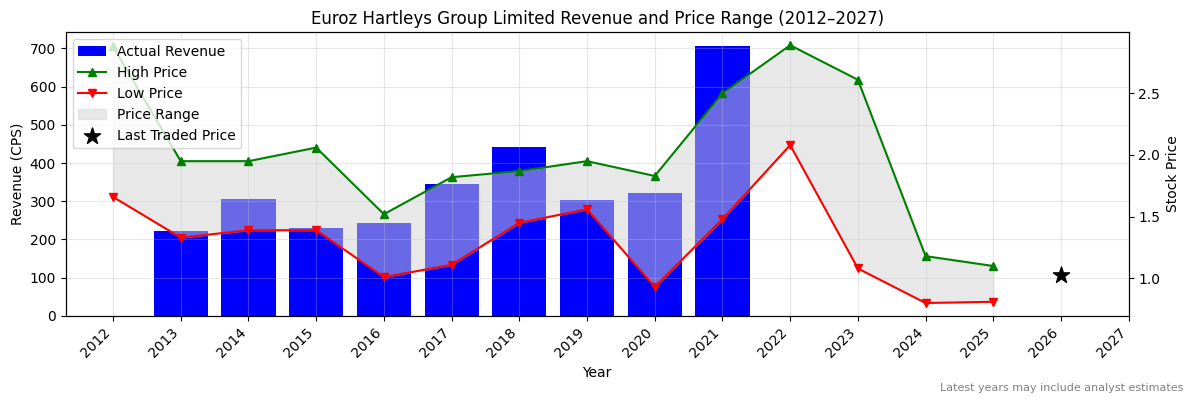
FBU Revenue Per Share (2012–2027)
FBU Earnings before Interest, Tax, Depreciation and Amortisation (EBITDA) Per Share (2012–2027)
FBU Normalised Earnings Per Share (EPS) (2012–2027)
Valuation
| Price To Sales |
Price To Book |
PER 2023 |
PER 2024 |
13Y Median PER Low |
PER 2025e |
13Y Median PER High |
PER 2026e |
Last Updated |
| 0.4 |
0.9 |
None |
None |
None |
None |
None |
None |
None |
FBU Yearly Price Earnings Ratio (PER) Highs and Lows
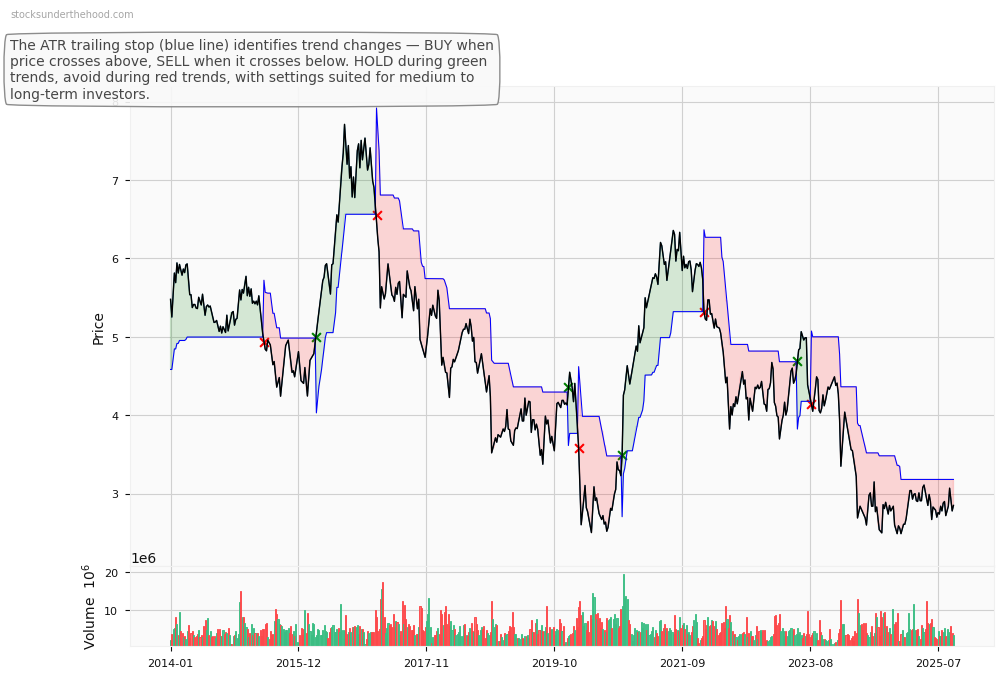
FBU Weekly Price Chart with Average True Range (ATR) Trailing Stop (10-Year View)
Ticker code: EZL
EZL Red Flags & Risk Indicators
⚠️
⚠️ RED FLAGS: 2 identified
- Falling Earnings
- High Relative Valuation
Income Statement
| Revenue 2024 Per Share |
Revenue 2025e Per Share |
Revenue 2026e Per Share |
Revenue 24 to 25e [%] |
Revenue 25e to 26e [%] |
EBITDA 2024 Per Share |
EBITDA 2025e Per Share |
EBITDA 2026e Per Share |
EBITDA 24 to 25e [%] |
EBITDA 25e to 26e [%] |
| 0.5782 |
None |
None |
None |
None |
None |
None |
None |
None |
None |
EZL Revenue Per Share (2012–2027)
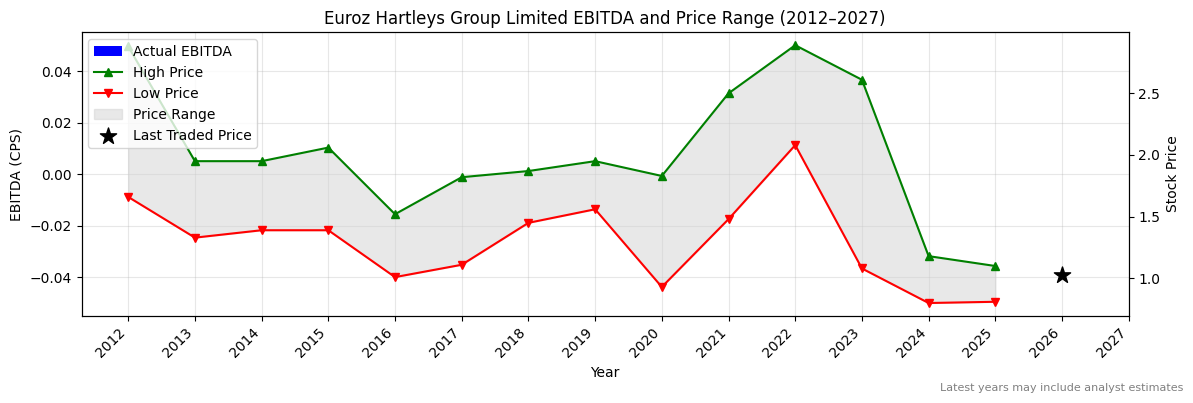
EZL Earnings before Interest, Tax, Depreciation and Amortisation (EBITDA) Per Share (2012–2027)
EZL Normalised Earnings Per Share (EPS) (2012–2027)
Valuation
| Price To Sales |
Price To Book |
PER 2023 |
PER 2024 |
13Y Median PER Low |
PER 2025e |
13Y Median PER High |
PER 2026e |
Last Updated |
| 1.6 |
1.4 |
None |
None |
9.3 |
None |
15.2 |
None |
1/2/24 |
EZL Yearly Price Earnings Ratio (PER) Highs and Lows
EZL Weekly Price Chart with Average True Range (ATR) Trailing Stop (10-Year View)