Ticker code: CKF
CKF Red Flags & Risk Indicators
❌
⚠️ RED FLAGS: 4 identified
- Increasing Shorts
- Falling Earnings
- More Net Debt Than Equity
- Falling EBITDA Margins
Income Statement
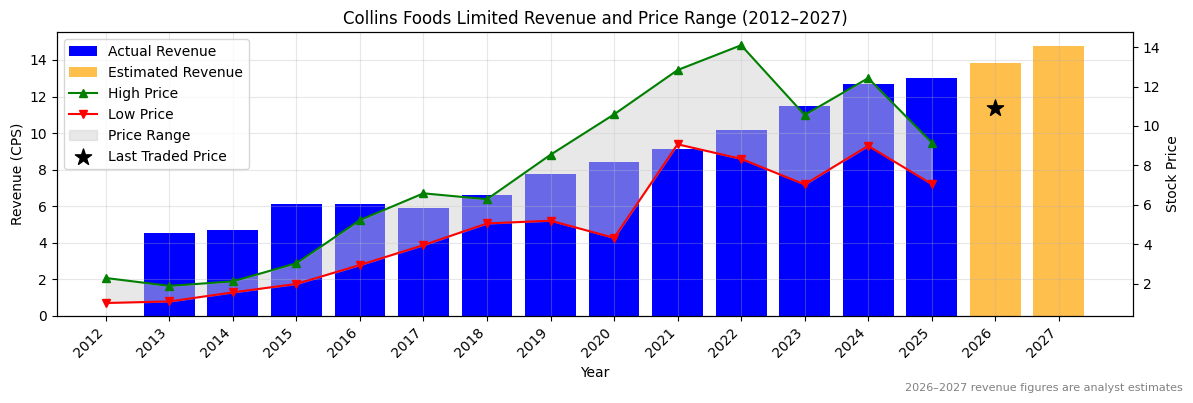
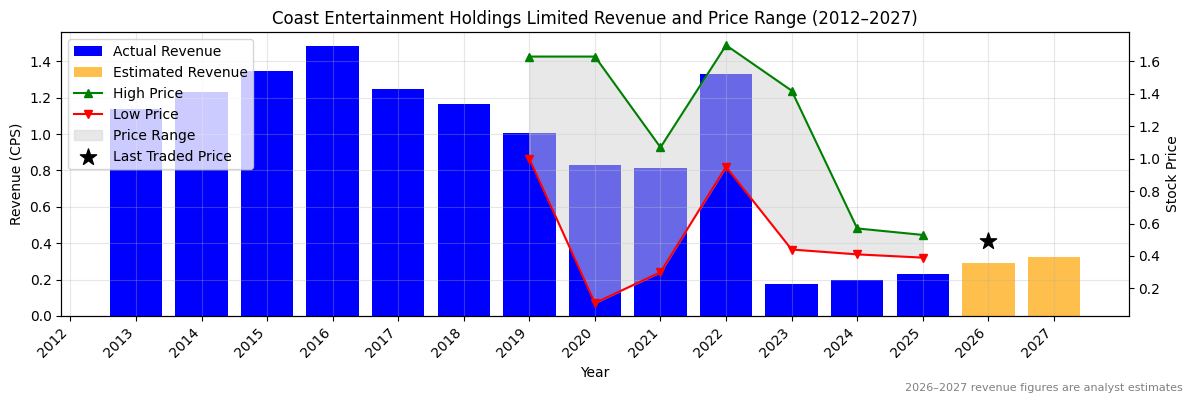
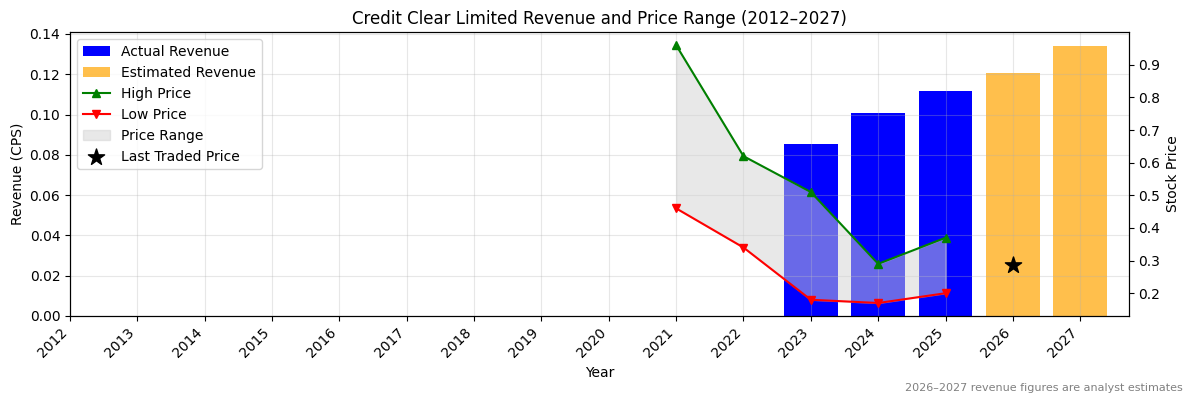
| Revenue 2024 Per Share |
Revenue 2025e Per Share |
Revenue 2026e Per Share |
Revenue 24 to 25e [%] |
Revenue 25e to 26e [%] |
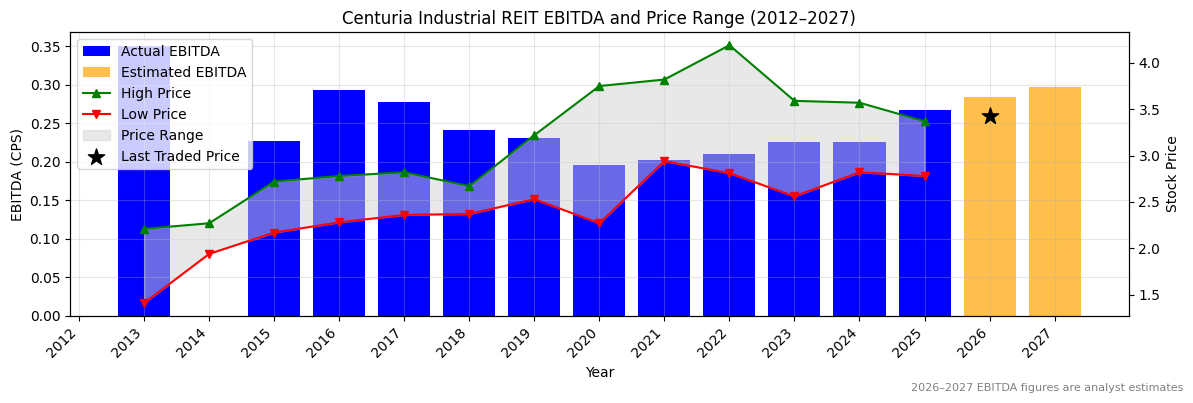
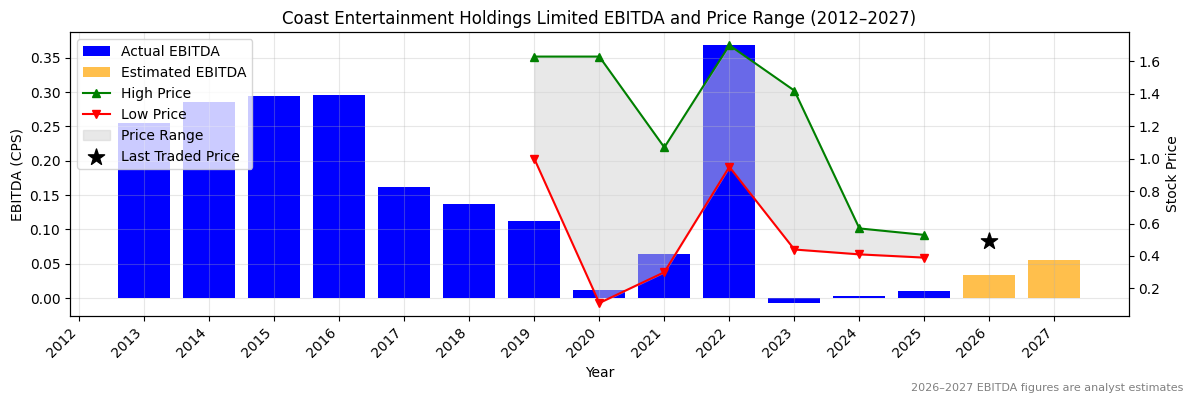
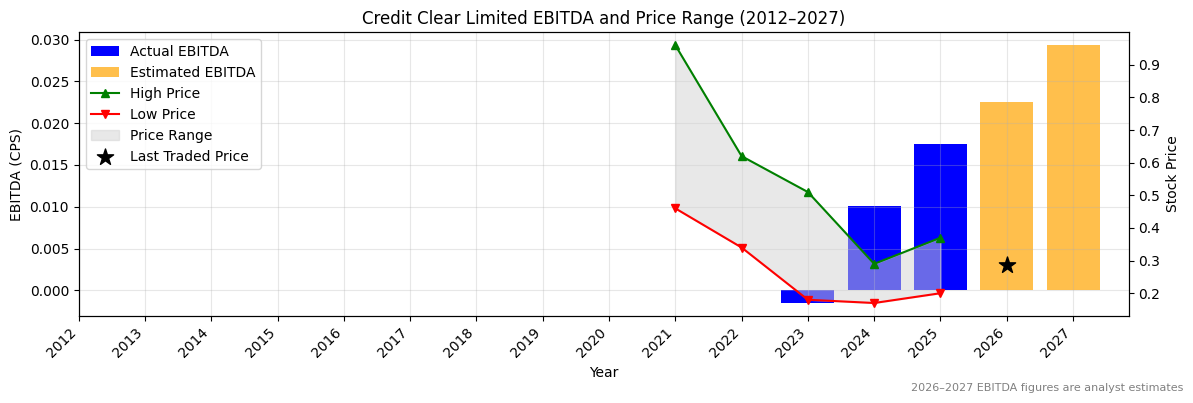
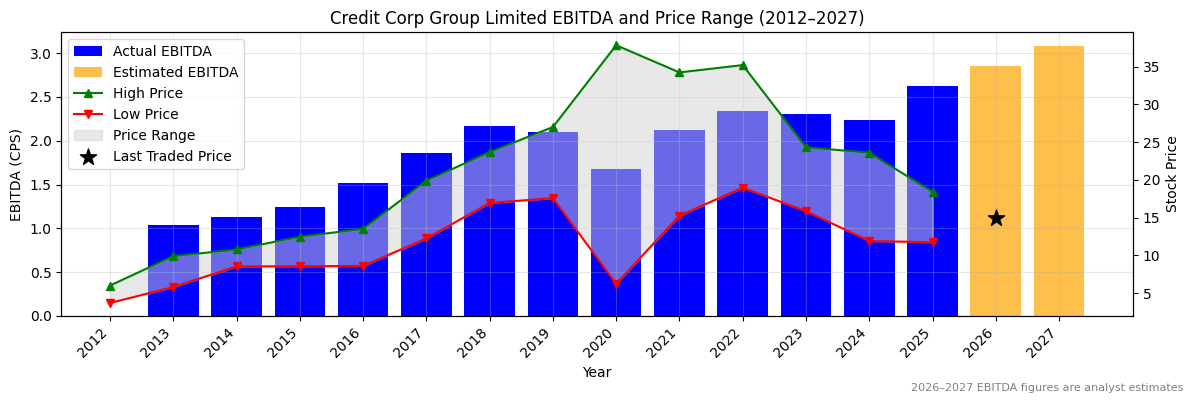
EBITDA 2024 Per Share |
EBITDA 2025e Per Share |
EBITDA 2026e Per Share |
EBITDA 24 to 25e [%] |
EBITDA 25e to 26e [%] |
| 12.66058 |
13.01692 |
13.82359 |
2.8 |
6.2 |
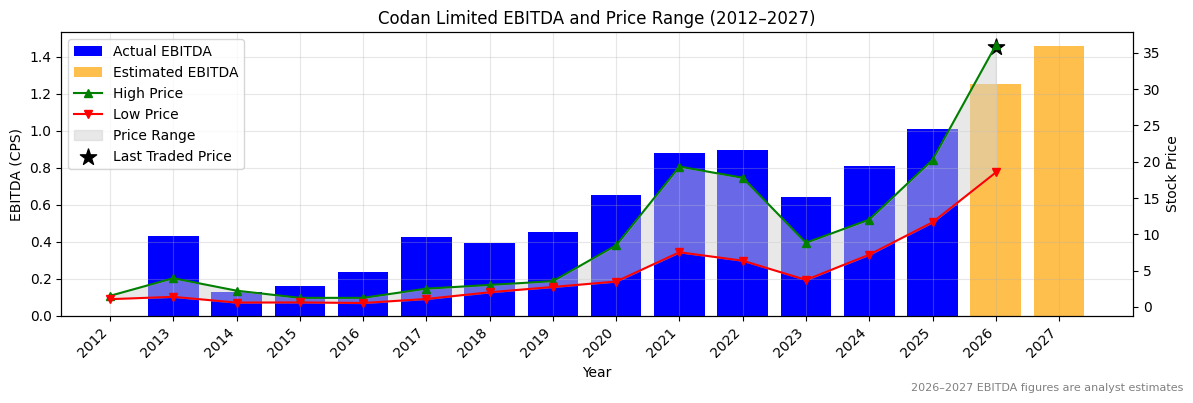
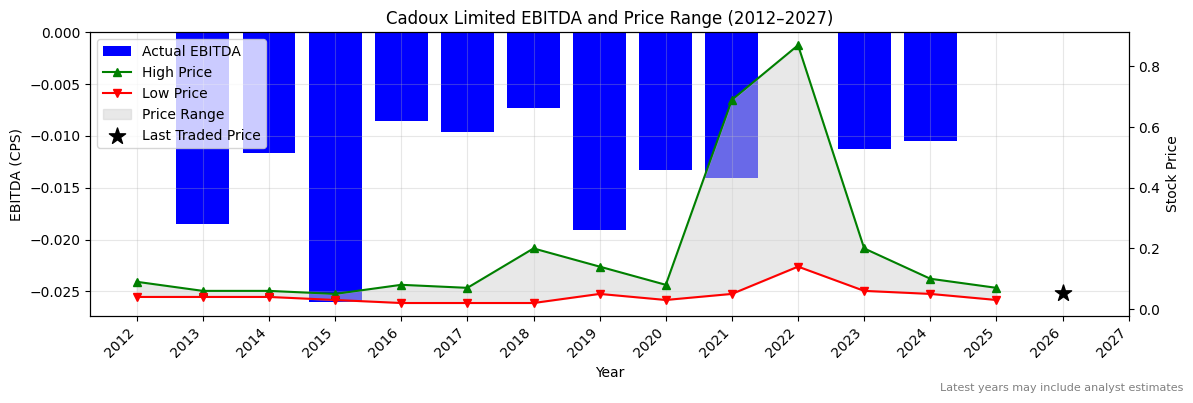
1.95366 |
1.8881 |
2.1316 |
-3.4 |
12.9 |
CKF Revenue Per Share (2012–2027)
✅
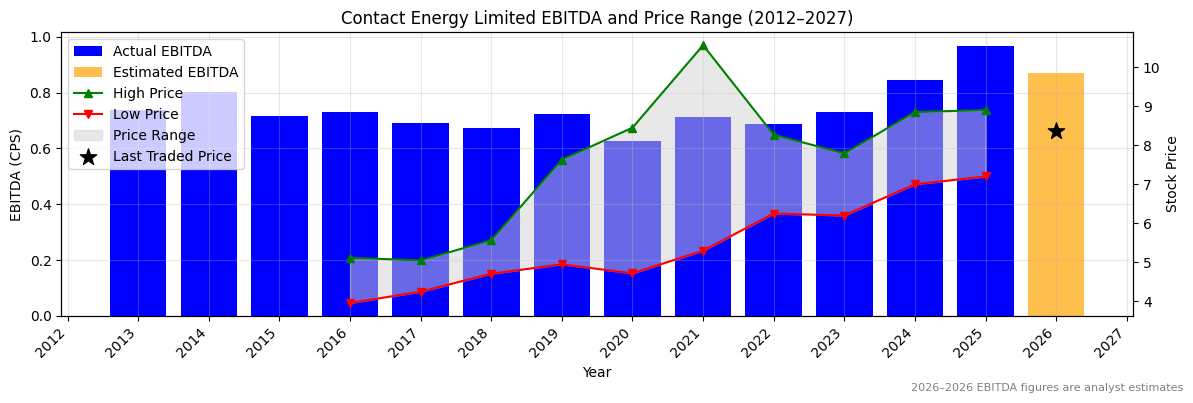
CKF Earnings before Interest, Tax, Depreciation and Amortisation (EBITDA) Per Share (2012–2027)
❌
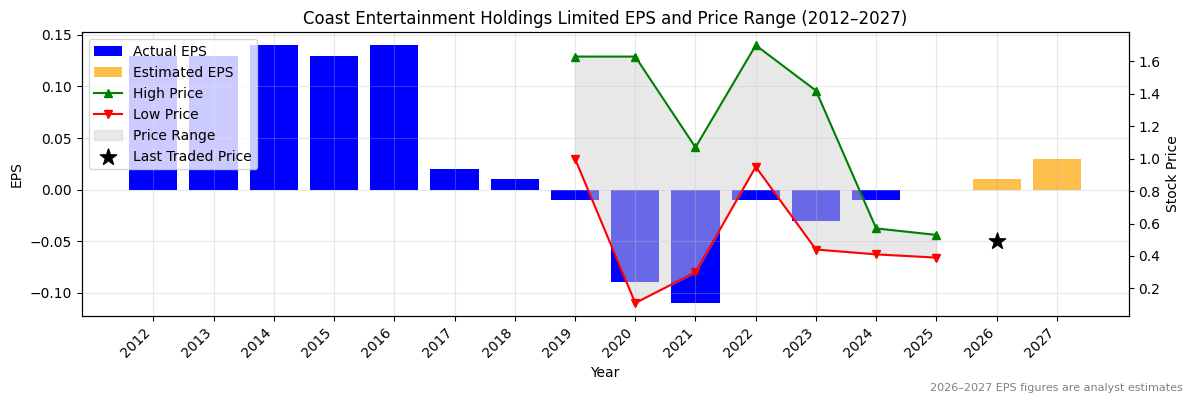
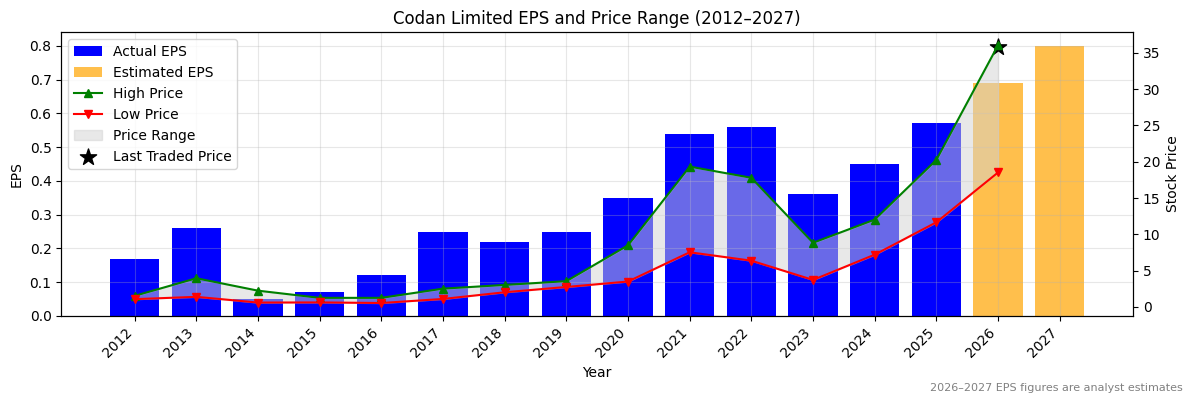
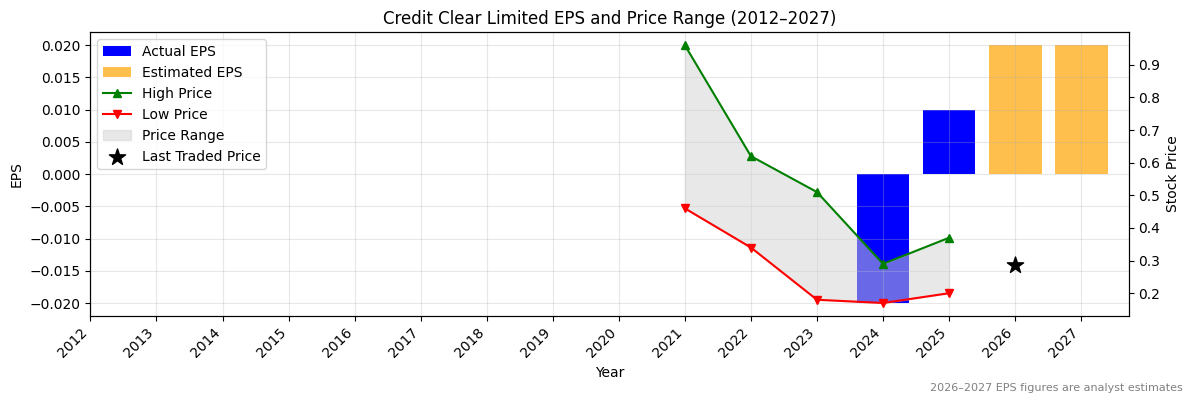
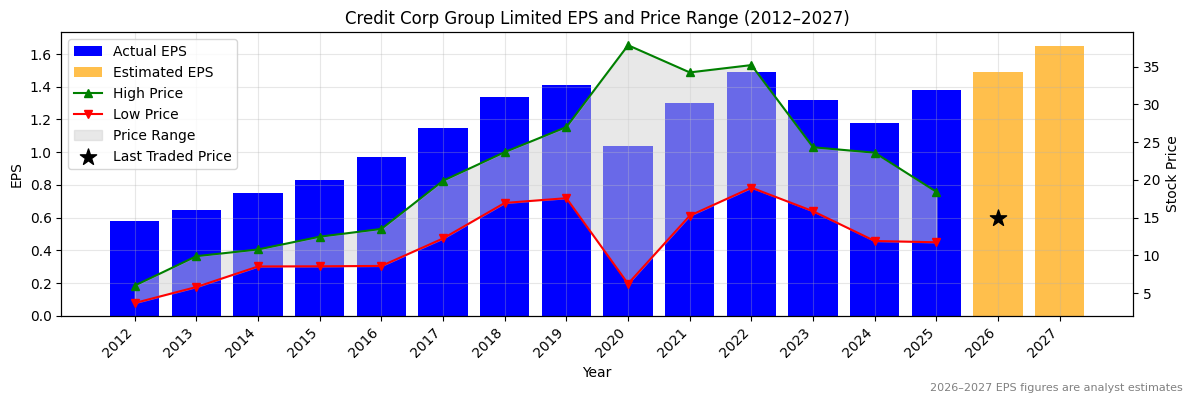
CKF Normalised Earnings Per Share (EPS) (2012–2027)
❌
Valuation
| Price To Sales |
Price To Book |
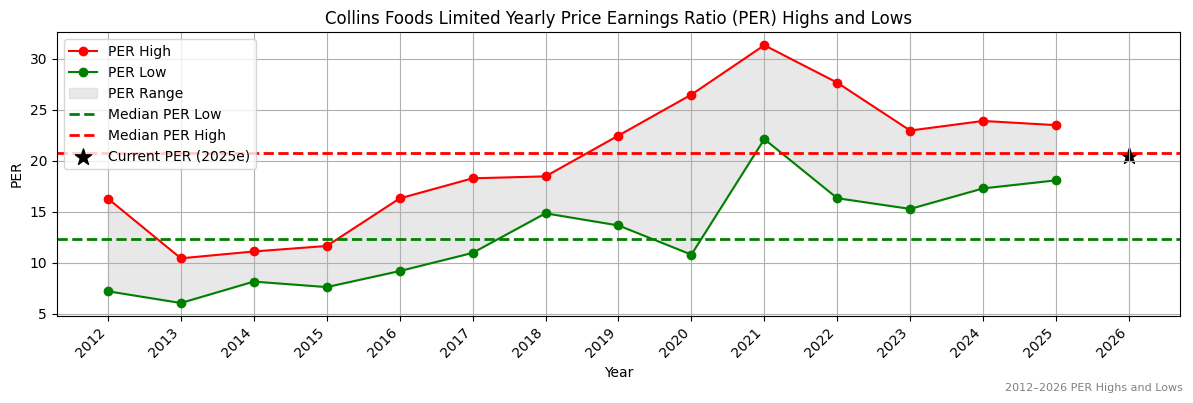
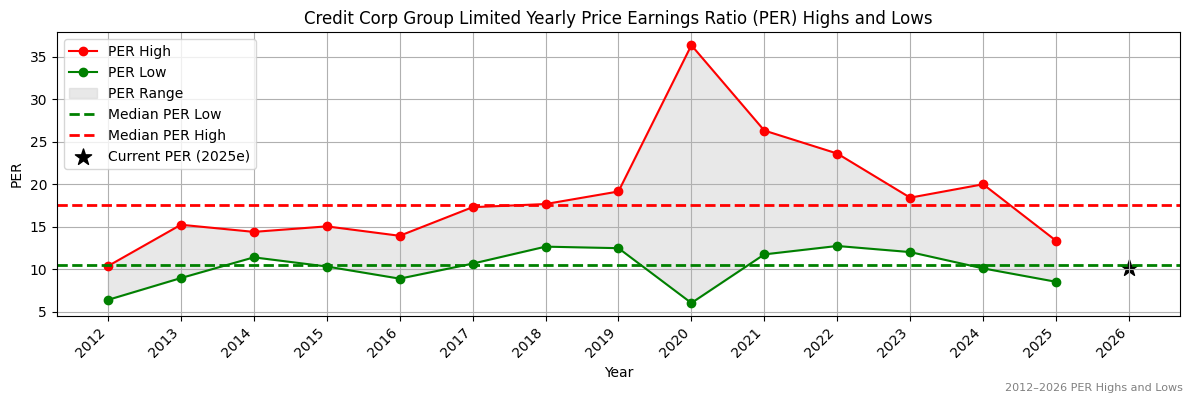
PER 2023 |
PER 2024 |
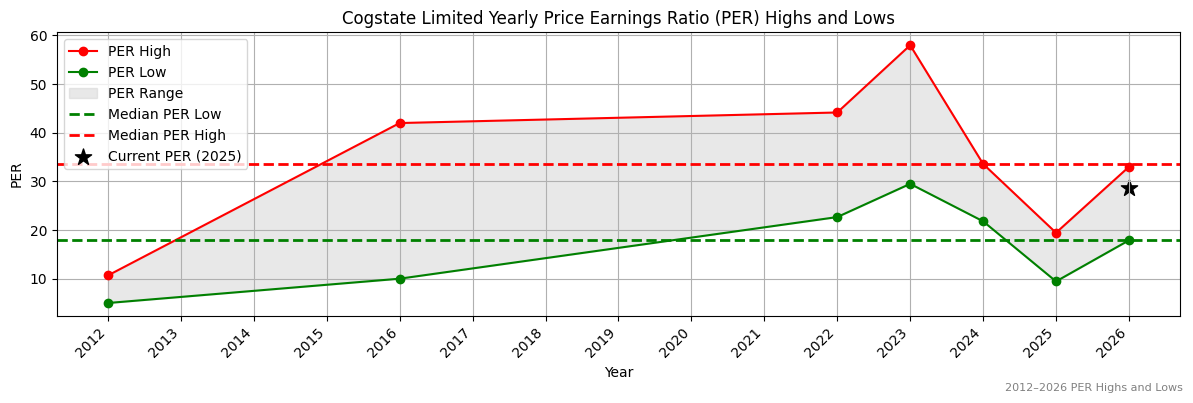
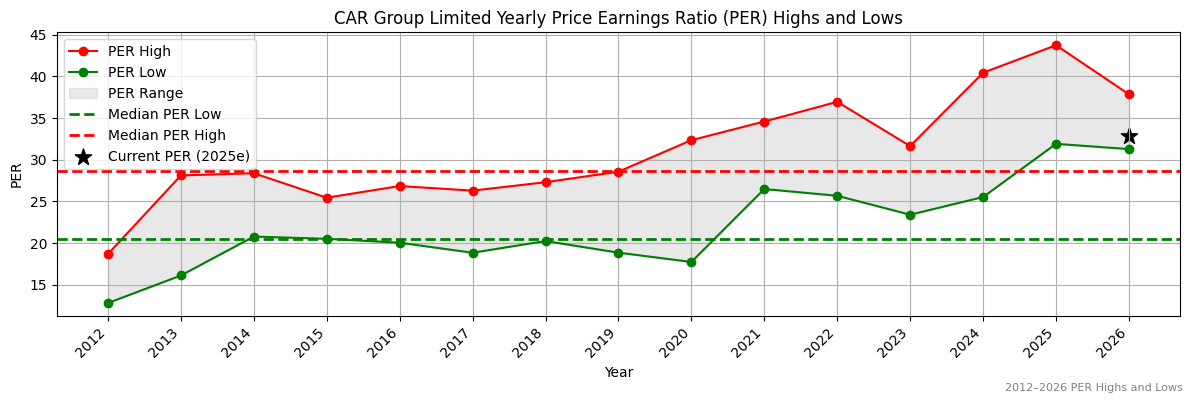
13Y Median PER Low |
PER 2025e |
13Y Median PER High |
PER 2026e |
Last Updated |
| 0.8 |
3.1 |
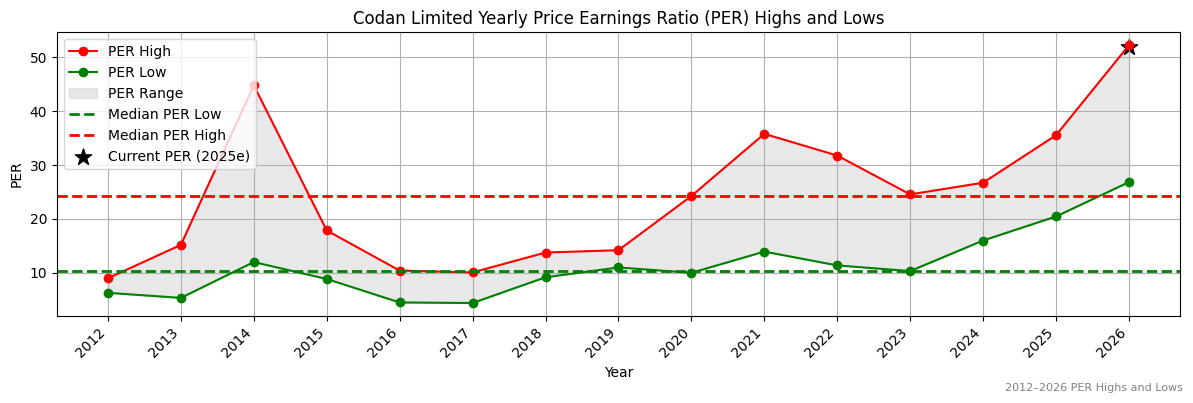
23.3 |
20.6 |
12.3 |
27.4 |
21.1 |
20.2 |
6/3/25 |
CKF Yearly Price Earnings Ratio (PER) Highs and Lows
❌
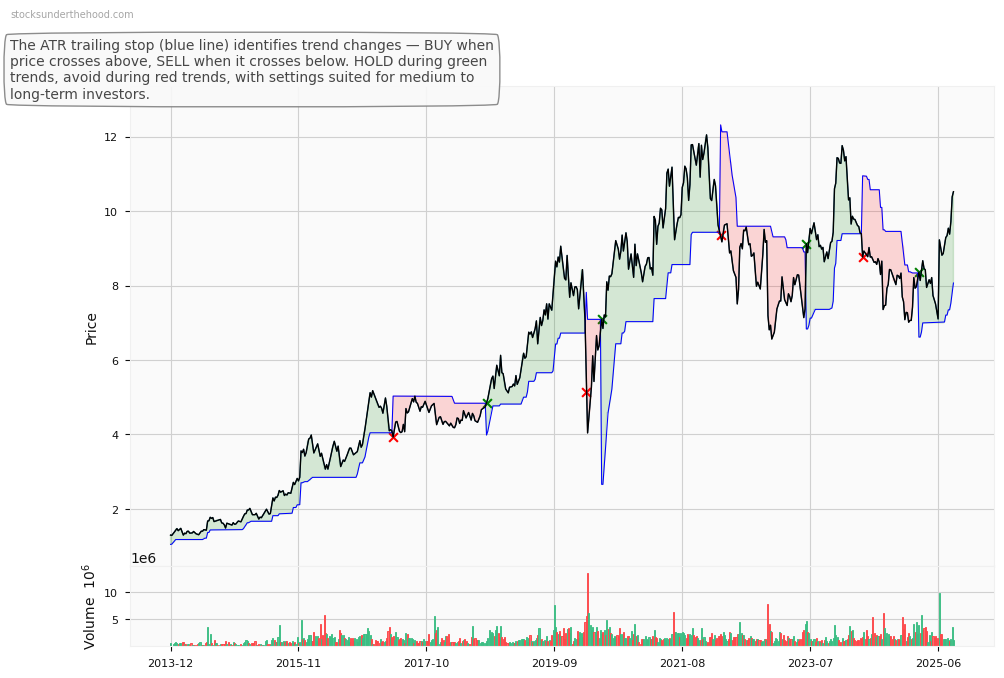
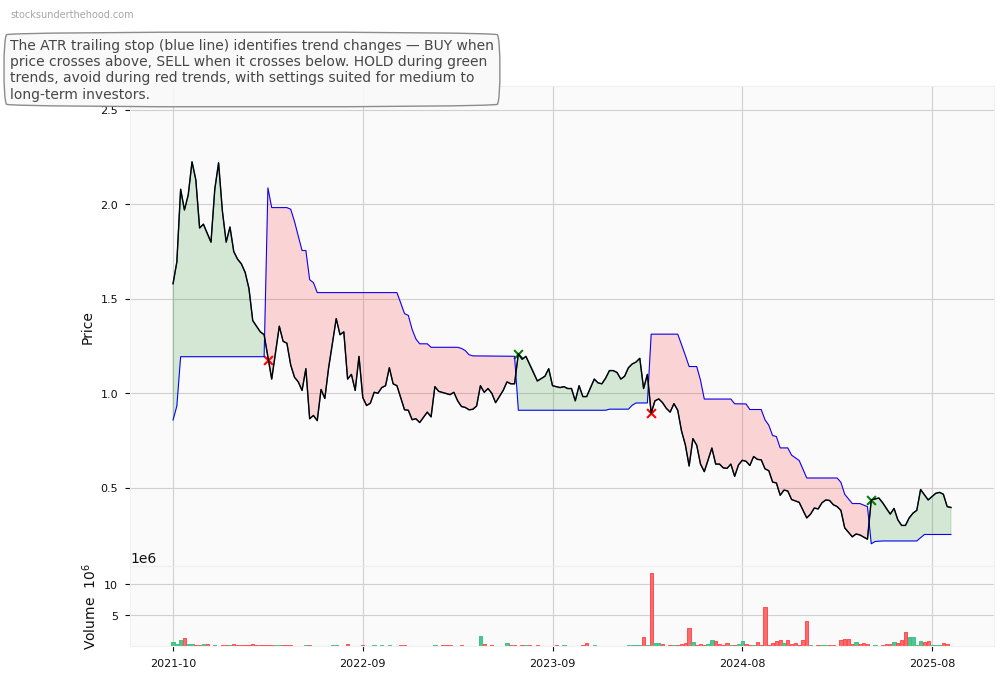
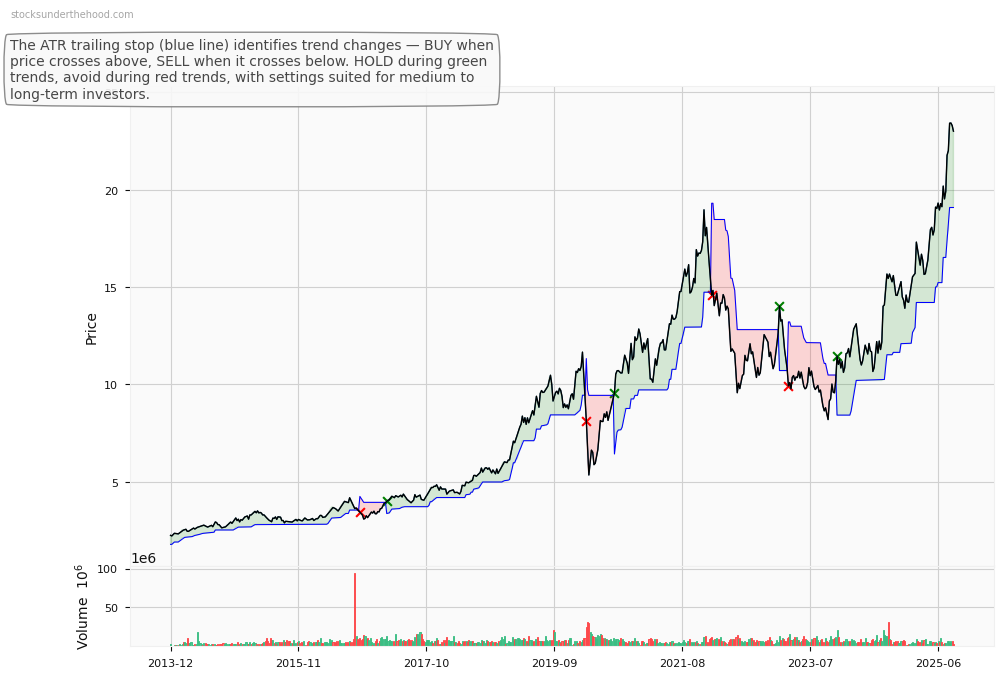
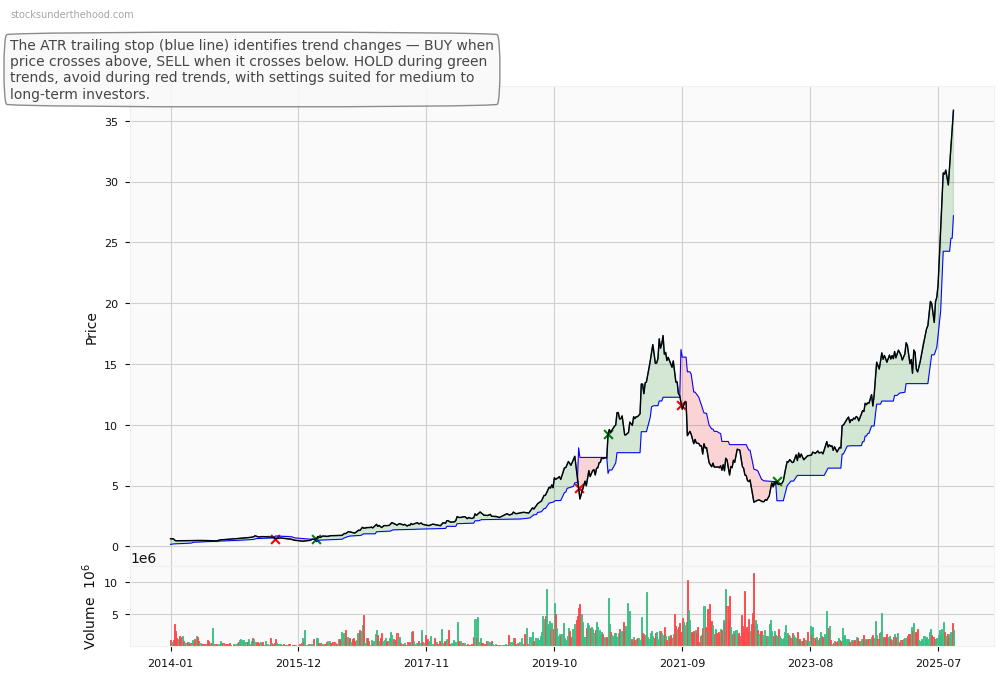
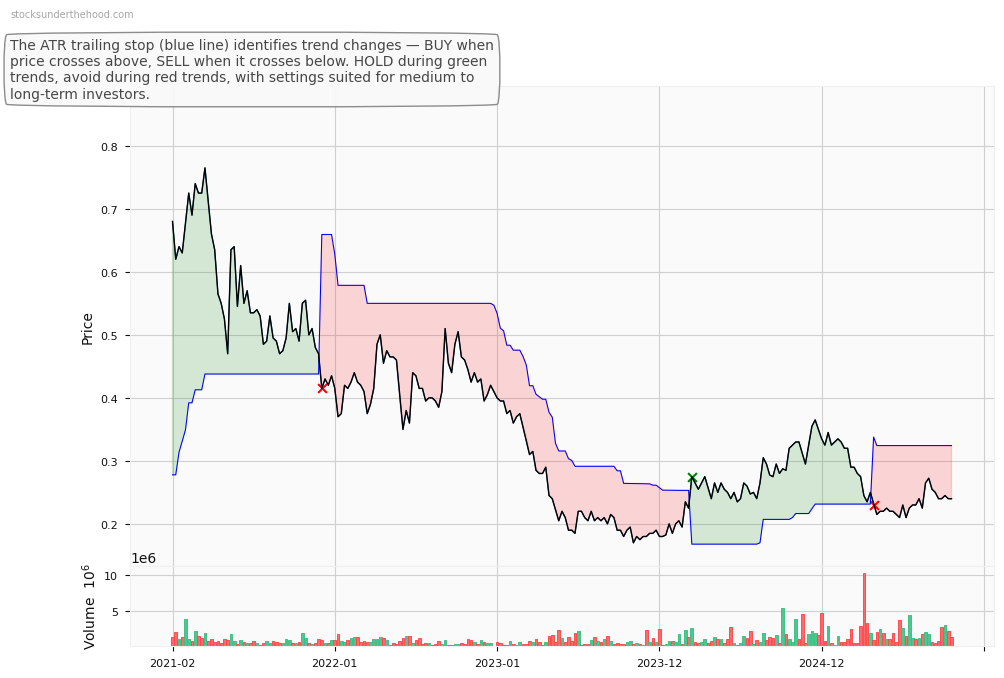
CKF Weekly Price Chart with Average True Range (ATR) Trailing Stop (10-Year View)
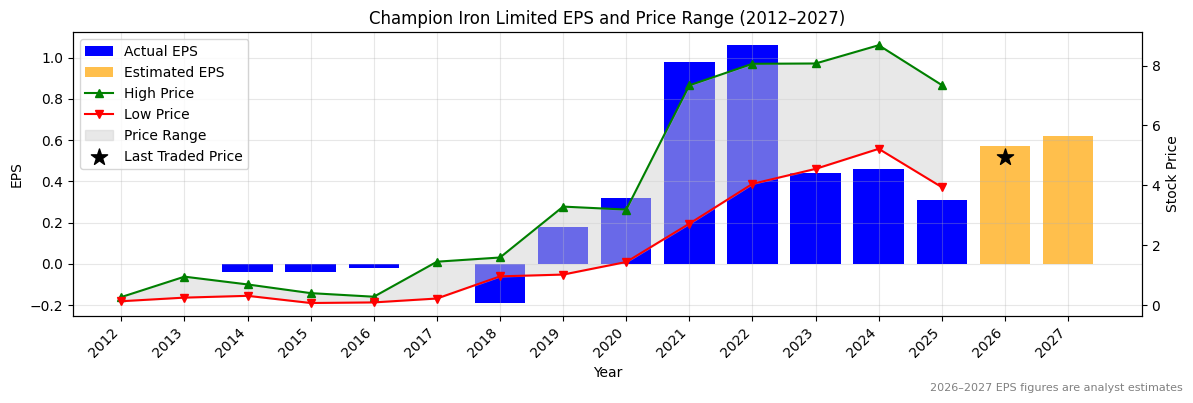
Ticker code: CIP
CIP Red Flags & Risk Indicators
❌
⚠️ RED FLAGS: 3 identified
- Increasing Shorts
- Falling Earnings
- High Relative Valuation
Income Statement
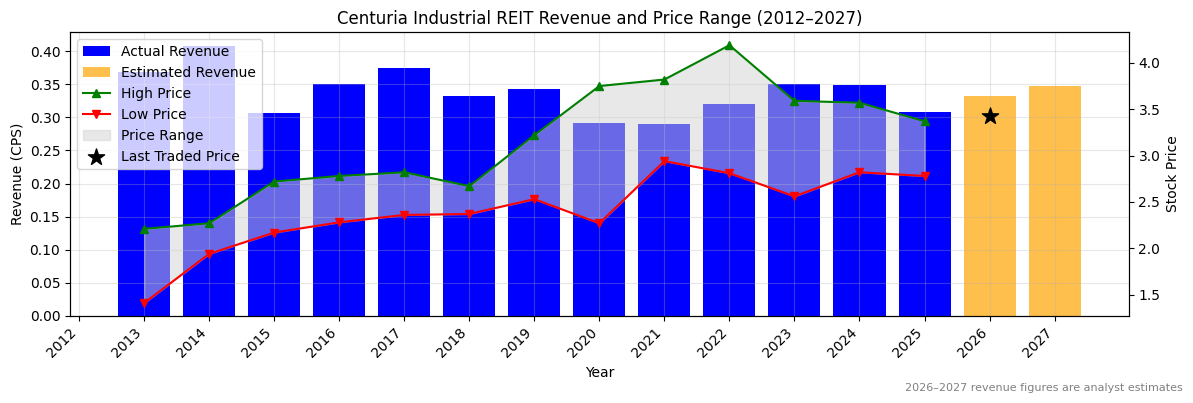
| Revenue 2024 Per Share |
Revenue 2025e Per Share |
Revenue 2026e Per Share |
Revenue 24 to 25e [%] |
Revenue 25e to 26e [%] |
EBITDA 2024 Per Share |
EBITDA 2025e Per Share |
EBITDA 2026e Per Share |
EBITDA 24 to 25e [%] |
EBITDA 25e to 26e [%] |
| 0.34831 |
0.30742 |
0.33044 |
-11.7 |
7.5 |
0.22615 |
0.26707 |
0.28309 |
18.1 |
6.0 |
CIP Revenue Per Share (2012–2027)
❌
CIP Earnings before Interest, Tax, Depreciation and Amortisation (EBITDA) Per Share (2012–2027)
✅
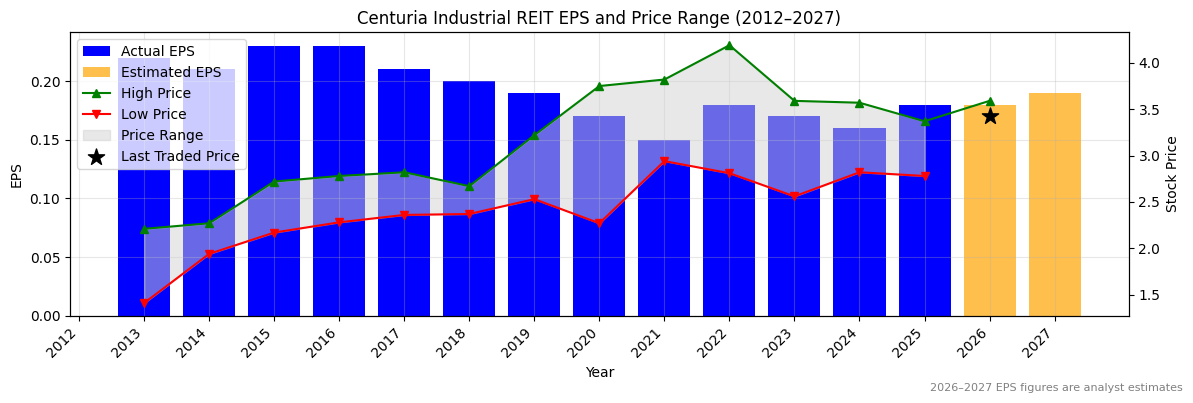
CIP Normalised Earnings Per Share (EPS) (2012–2027)
✅
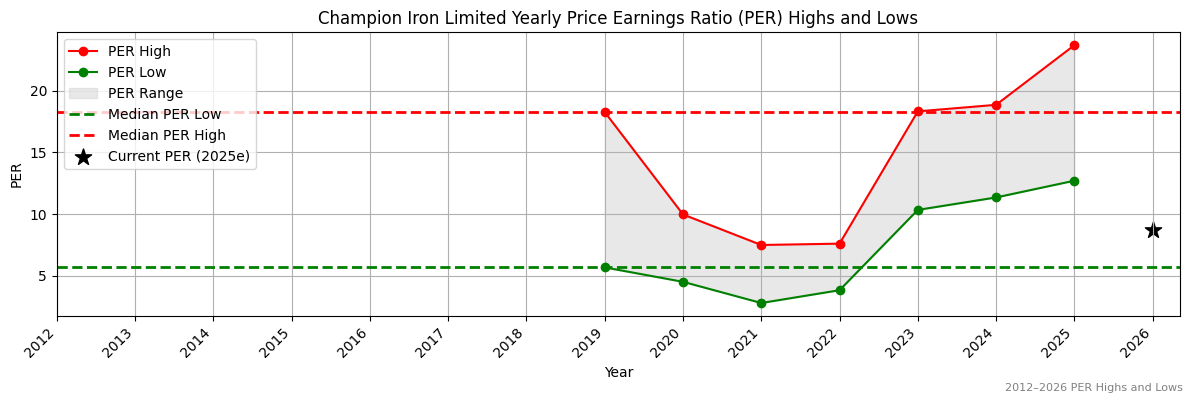
Valuation
| Price To Sales |
Price To Book |
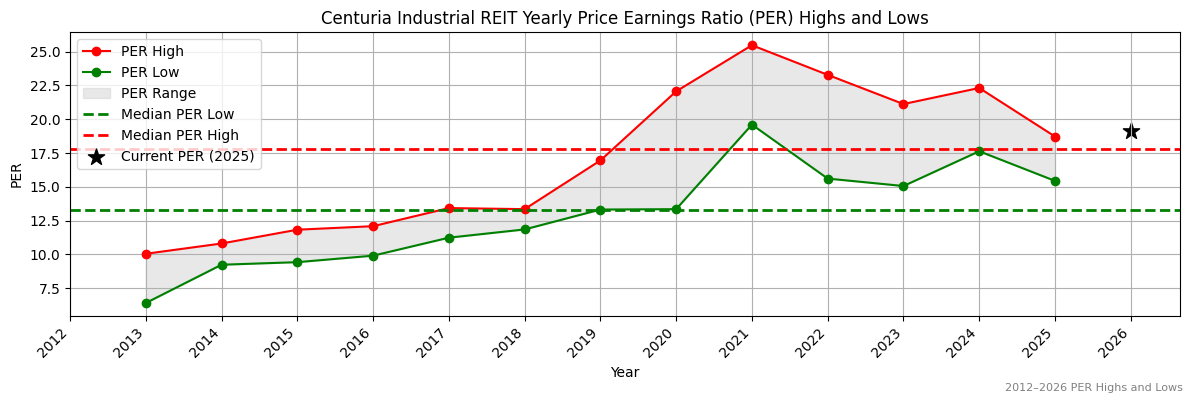
PER 2023 |
PER 2024 |
13Y Median PER Low |
PER 2025e |
13Y Median PER High |
PER 2026e |
Last Updated |
| 9.3 |
0.9 |
20.8 |
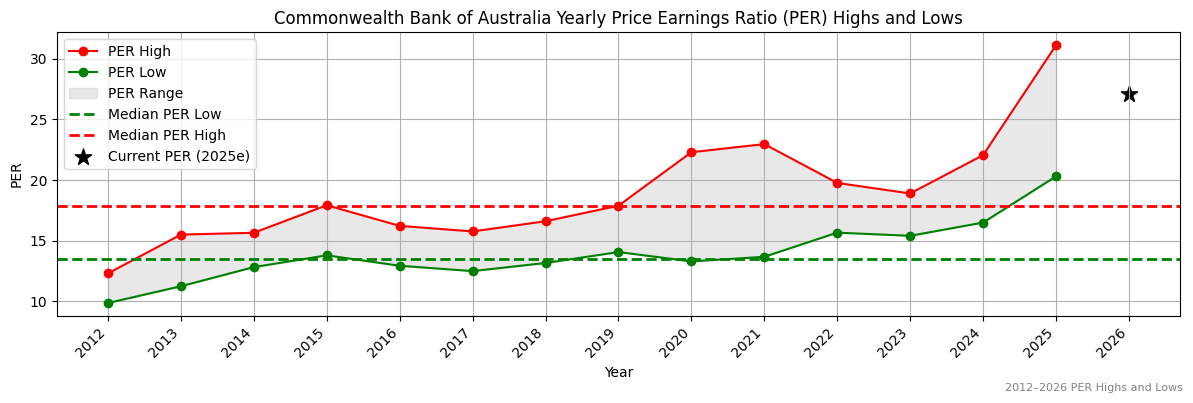
22.1 |
13.3 |
19.7 |
17.8 |
19.7 |
3/8/25 |
CIP Yearly Price Earnings Ratio (PER) Highs and Lows
❌
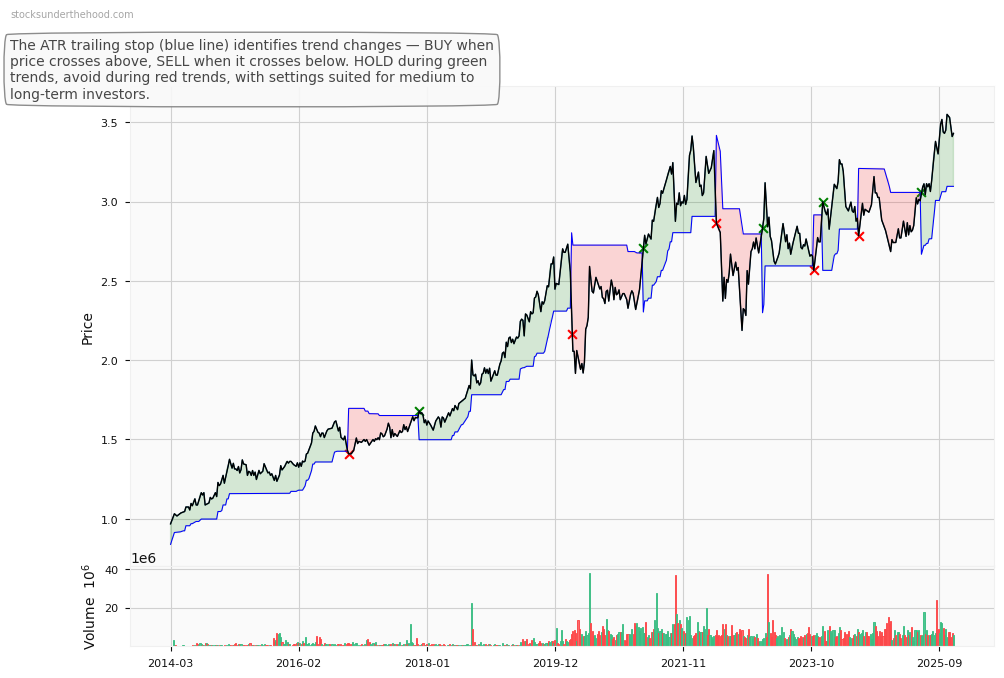
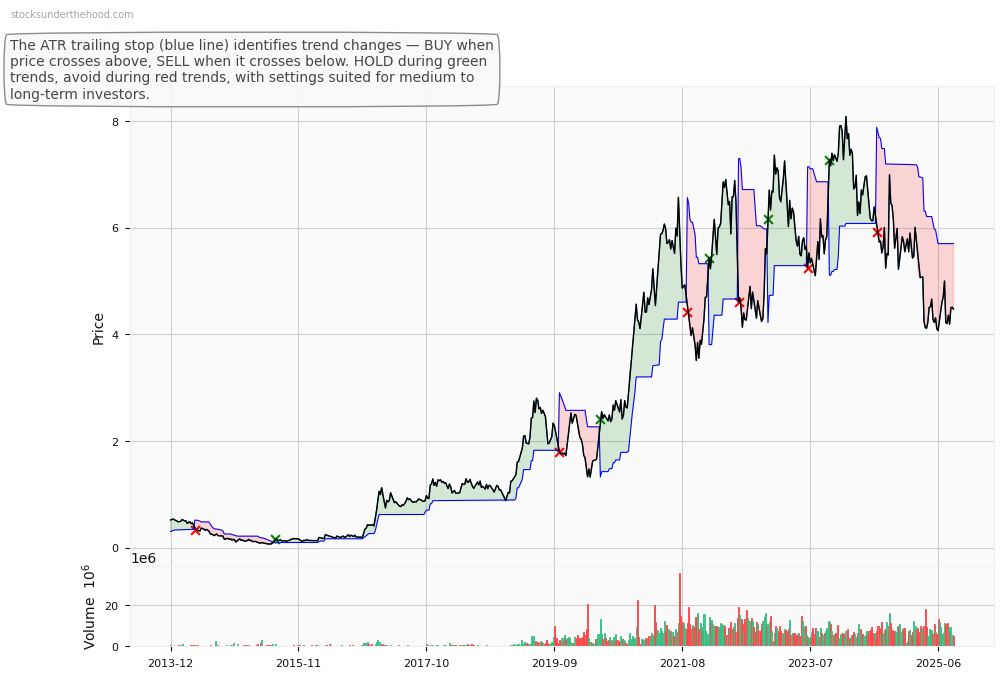
CIP Weekly Price Chart with Average True Range (ATR) Trailing Stop (10-Year View)
Ticker code: CIA
CIA Red Flags & Risk Indicators
⚠️
⚠️ RED FLAGS: 2 identified
- Highly Shorted
- Falling Earnings
Income Statement
| Revenue 2024 Per Share |
Revenue 2025e Per Share |
Revenue 2026e Per Share |
Revenue 24 to 25e [%] |
Revenue 25e to 26e [%] |
EBITDA 2024 Per Share |
EBITDA 2025e Per Share |
EBITDA 2026e Per Share |
EBITDA 24 to 25e [%] |
EBITDA 25e to 26e [%] |
| 2.94094 |
3.09971 |
3.50869 |
5.4 |
13.2 |
1.11136 |
1.49859 |
None |
34.8 |
None |
CIA Revenue Per Share (2012–2027)
✅
CIA Earnings before Interest, Tax, Depreciation and Amortisation (EBITDA) Per Share (2012–2027)
✅✅
CIA Normalised Earnings Per Share (EPS) (2012–2027)
❌
Valuation
| Price To Sales |
Price To Book |
PER 2023 |
PER 2024 |
13Y Median PER Low |
PER 2025e |
13Y Median PER High |
PER 2026e |
Last Updated |
| 1.9 |
2.0 |
12.6 |
12.0 |
5.7 |
17.9 |
18.3 |
9.7 |
4/3/24 |
CIA Yearly Price Earnings Ratio (PER) Highs and Lows
✅
CIA Weekly Price Chart with Average True Range (ATR) Trailing Stop (10-Year View)
Ticker code: CHN
CHN Red Flags & Risk Indicators
❌
⚠️ RED FLAGS: 4 identified
- Negative Operating Cash Flow
- Increasing Shorts
- Zero Revenue
- High Price to Book vs ROE
Income Statement
| Revenue 2024 Per Share |
Revenue 2025e Per Share |
Revenue 2026e Per Share |
Revenue 24 to 25e [%] |
Revenue 25e to 26e [%] |
EBITDA 2024 Per Share |
EBITDA 2025e Per Share |
EBITDA 2026e Per Share |
EBITDA 24 to 25e [%] |
EBITDA 25e to 26e [%] |
| None |
None |
None |
None |
None |
-0.05499 |
-0.05431 |
None |
1.2 |
None |
CHN Revenue Per Share (2012–2027)
CHN Earnings before Interest, Tax, Depreciation and Amortisation (EBITDA) Per Share (2012–2027)
✅
CHN Normalised Earnings Per Share (EPS) (2012–2027)
✅✅
Valuation
| Price To Sales |
Price To Book |
PER 2023 |
PER 2024 |
13Y Median PER Low |
PER 2025e |
13Y Median PER High |
PER 2026e |
Last Updated |
| None |
6.1 |
-11.9 |
-20.2 |
None |
-50.5 |
None |
-50.5 |
3/9/23 |
CHN Yearly Price Earnings Ratio (PER) Highs and Lows
CHN Weekly Price Chart with Average True Range (ATR) Trailing Stop (10-Year View)
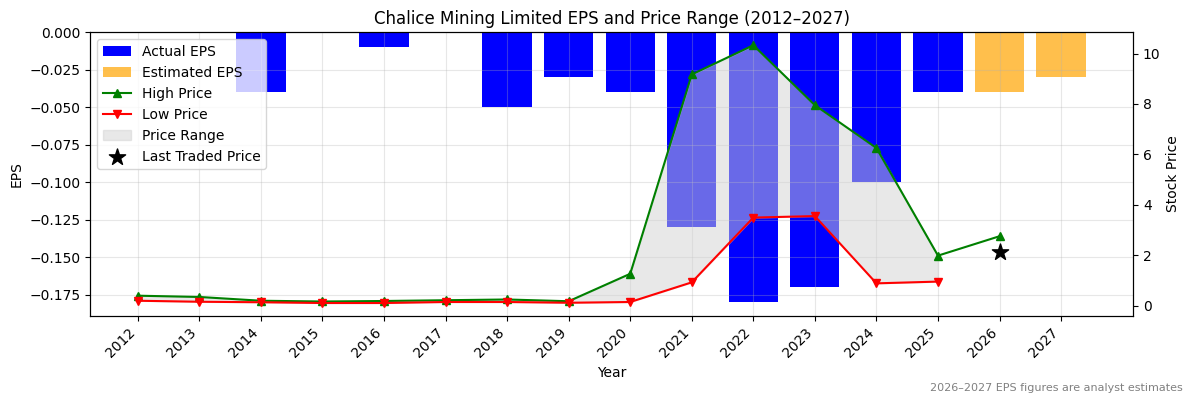
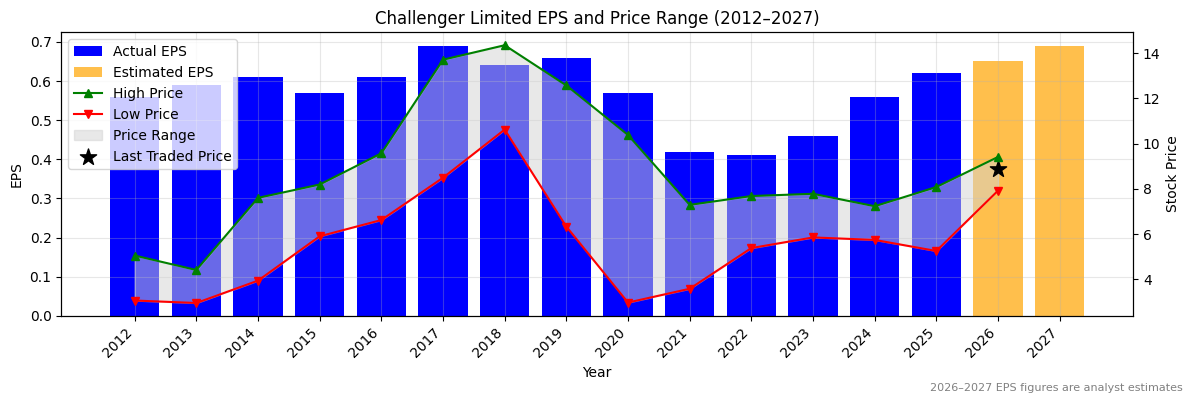
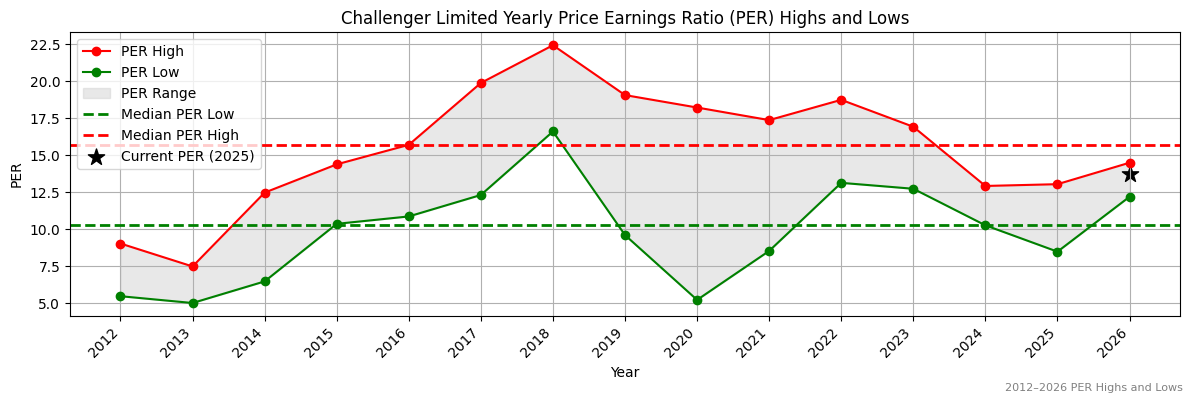
Ticker code: CHL
CHL Red Flags & Risk Indicators
⚠️
⚠️ RED FLAGS: 1 identified
Income Statement
| Revenue 2024 Per Share |
Revenue 2025e Per Share |
Revenue 2026e Per Share |
Revenue 24 to 25e [%] |
Revenue 25e to 26e [%] |
EBITDA 2024 Per Share |
EBITDA 2025e Per Share |
EBITDA 2026e Per Share |
EBITDA 24 to 25e [%] |
EBITDA 25e to 26e [%] |
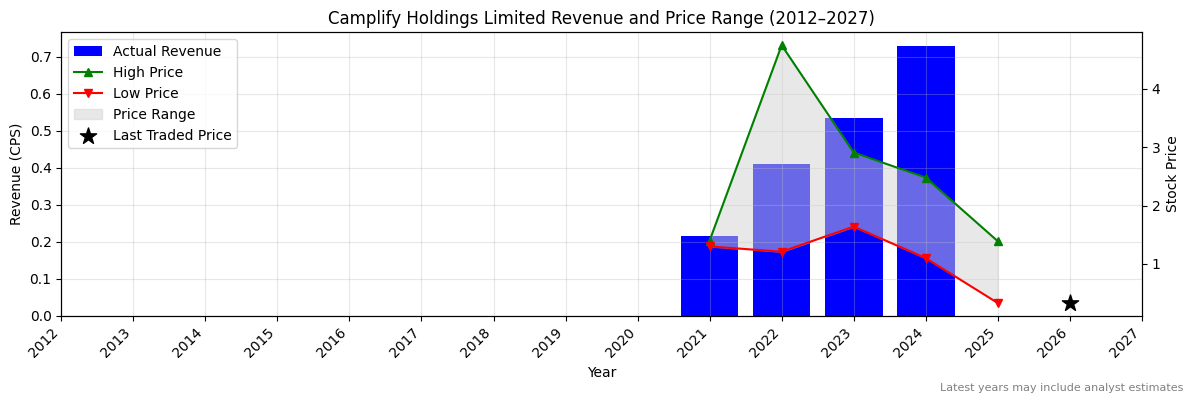
| 0.73007 |
None |
None |
None |
None |
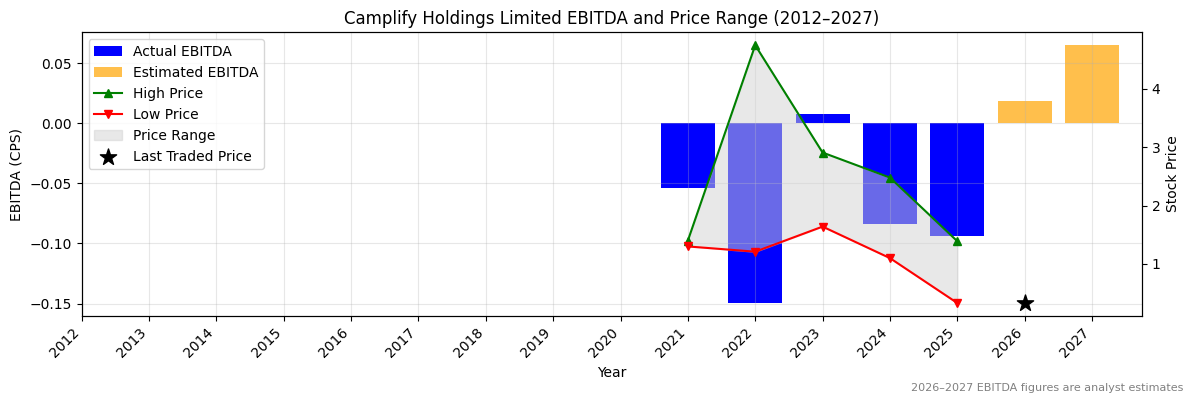
-0.08406 |
-0.09385 |
0.01839 |
-11.6 |
119.6 |
CHL Revenue Per Share (2012–2027)
CHL Earnings before Interest, Tax, Depreciation and Amortisation (EBITDA) Per Share (2012–2027)
❌
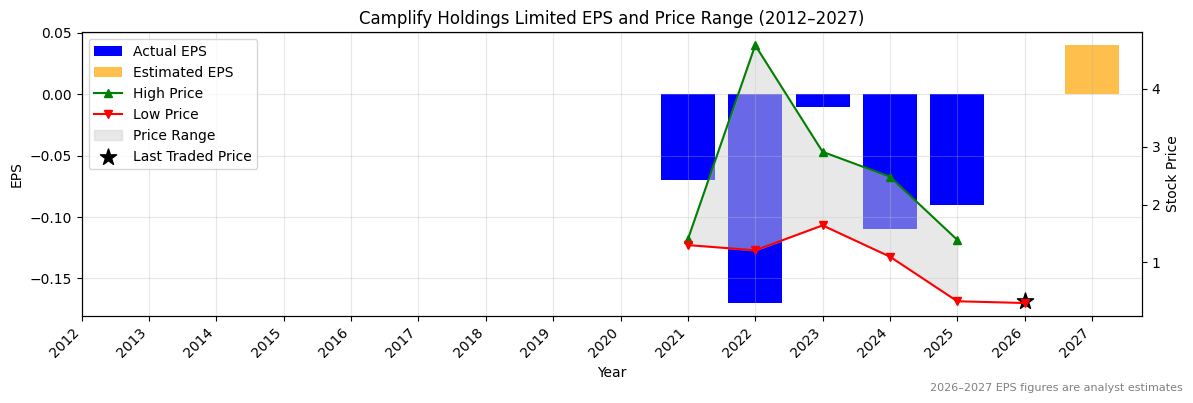
CHL Normalised Earnings Per Share (EPS) (2012–2027)
✅
Valuation
| Price To Sales |
Price To Book |
PER 2023 |
PER 2024 |
13Y Median PER Low |
PER 2025e |
13Y Median PER High |
PER 2026e |
Last Updated |
| 0.6 |
0.6 |
-37.5 |
-3.4 |
None |
-4.2 |
None |
None |
7/9/24 |
CHL Yearly Price Earnings Ratio (PER) Highs and Lows
CHL Weekly Price Chart with Average True Range (ATR) Trailing Stop (10-Year View)
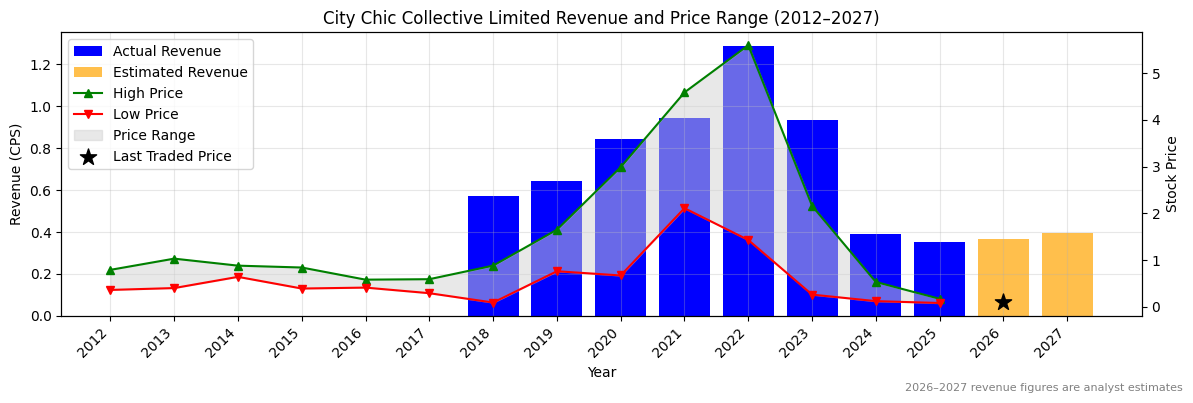
Ticker code: CHC
CHC Red Flags & Risk Indicators
❌
⚠️ RED FLAGS: 3 identified
- Falling Earnings
- High Relative Valuation
- Falling EBITDA Margins
Income Statement
| Revenue 2024 Per Share |
Revenue 2025e Per Share |
Revenue 2026e Per Share |
Revenue 24 to 25e [%] |
Revenue 25e to 26e [%] |
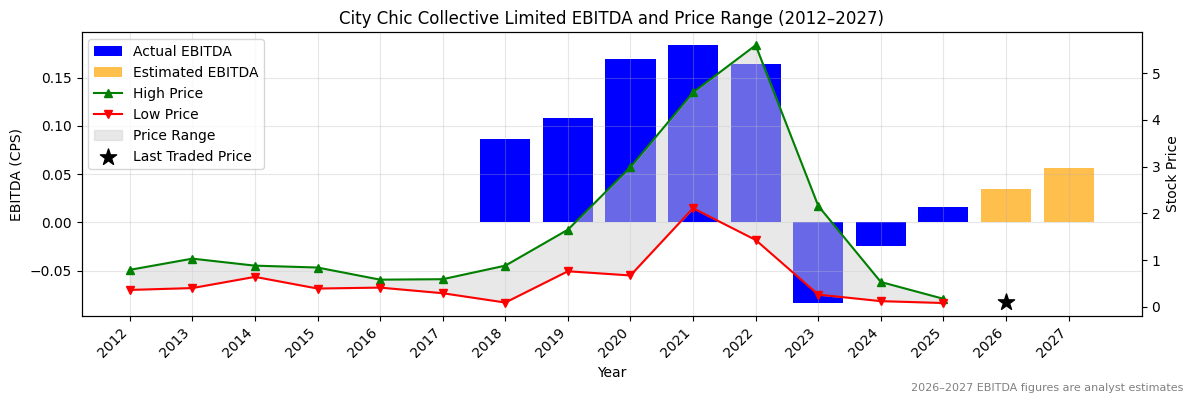
EBITDA 2024 Per Share |
EBITDA 2025e Per Share |
EBITDA 2026e Per Share |
EBITDA 24 to 25e [%] |
EBITDA 25e to 26e [%] |
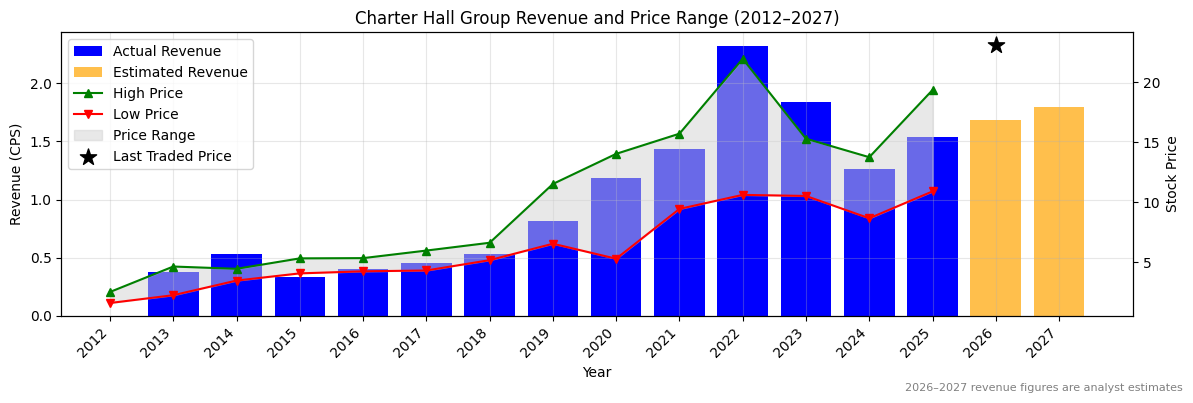
| 1.26385 |
1.53419 |
1.68079 |
21.4 |
9.6 |
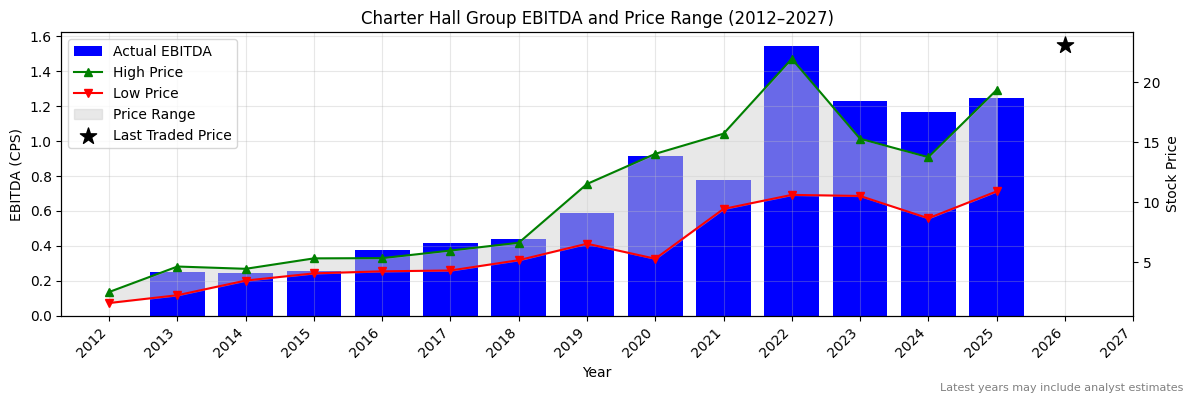
1.16493 |
1.2451 |
None |
6.9 |
None |
CHC Revenue Per Share (2012–2027)
✅✅
CHC Earnings before Interest, Tax, Depreciation and Amortisation (EBITDA) Per Share (2012–2027)
✅
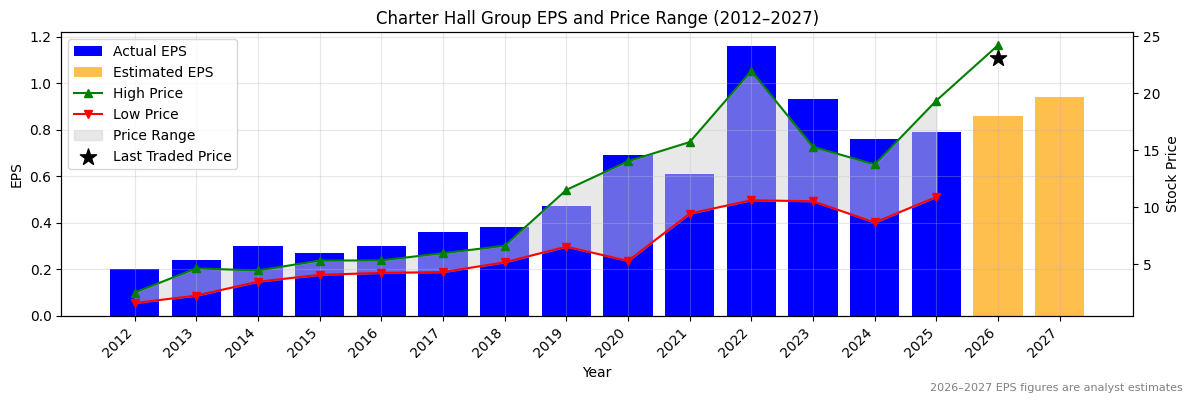
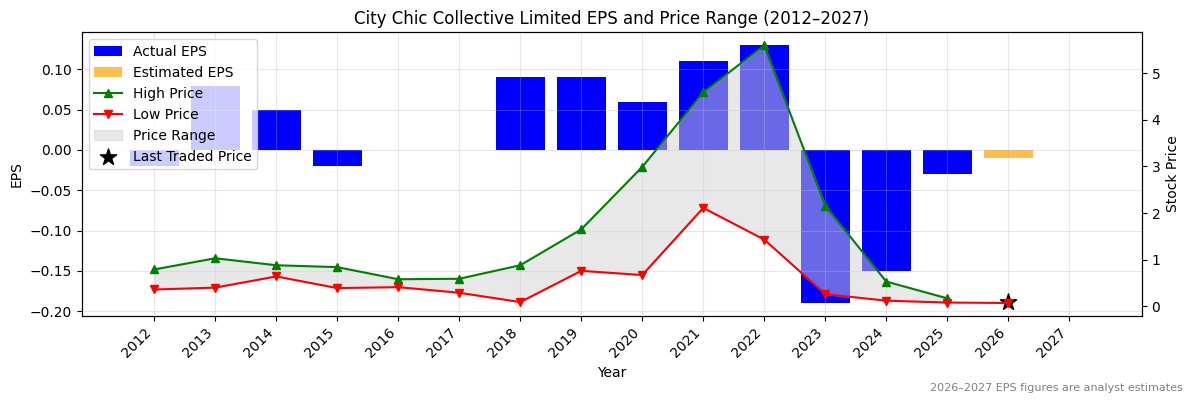
CHC Normalised Earnings Per Share (EPS) (2012–2027)
✅
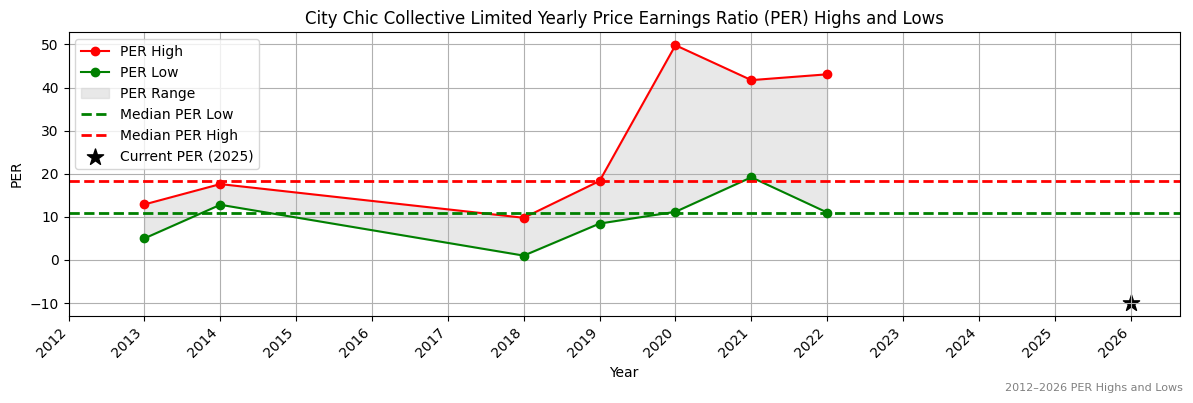
Valuation
| Price To Sales |
Price To Book |
PER 2023 |
PER 2024 |
13Y Median PER Low |
PER 2025e |
13Y Median PER High |
PER 2026e |
Last Updated |
| 15.4 |
3.9 |
24.1 |
29.5 |
11.8 |
28.4 |
18.9 |
26.1 |
28/11/23 |
CHC Yearly Price Earnings Ratio (PER) Highs and Lows
❌
CHC Weekly Price Chart with Average True Range (ATR) Trailing Stop (10-Year View)
Ticker code: CGS
CGS Red Flags & Risk Indicators
✅
⚠️ RED FLAGS: 0 identified
No red flags detected.
Income Statement
| Revenue 2024 Per Share |
Revenue 2025e Per Share |
Revenue 2026e Per Share |
Revenue 24 to 25e [%] |
Revenue 25e to 26e [%] |
EBITDA 2024 Per Share |
EBITDA 2025e Per Share |
EBITDA 2026e Per Share |
EBITDA 24 to 25e [%] |
EBITDA 25e to 26e [%] |
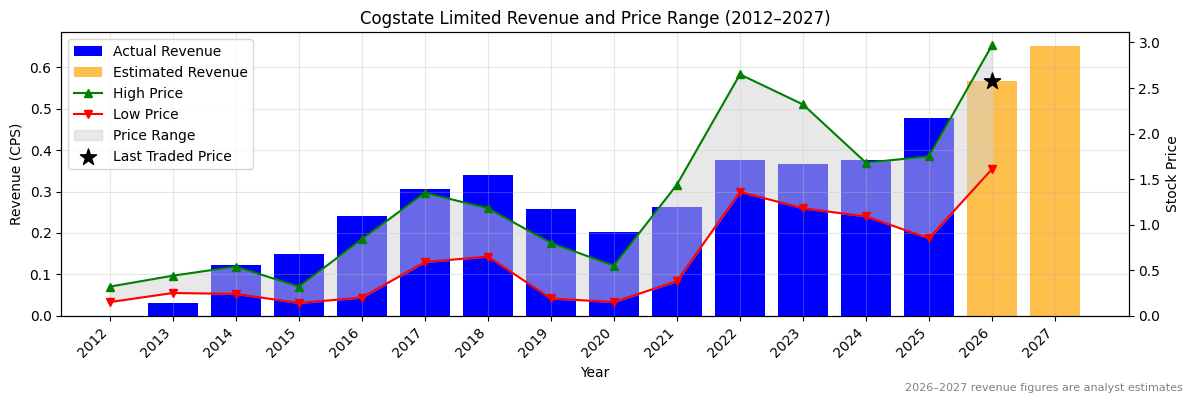
| 0.37664 |
0.4784 |
0.56656 |
27.0 |
18.4 |
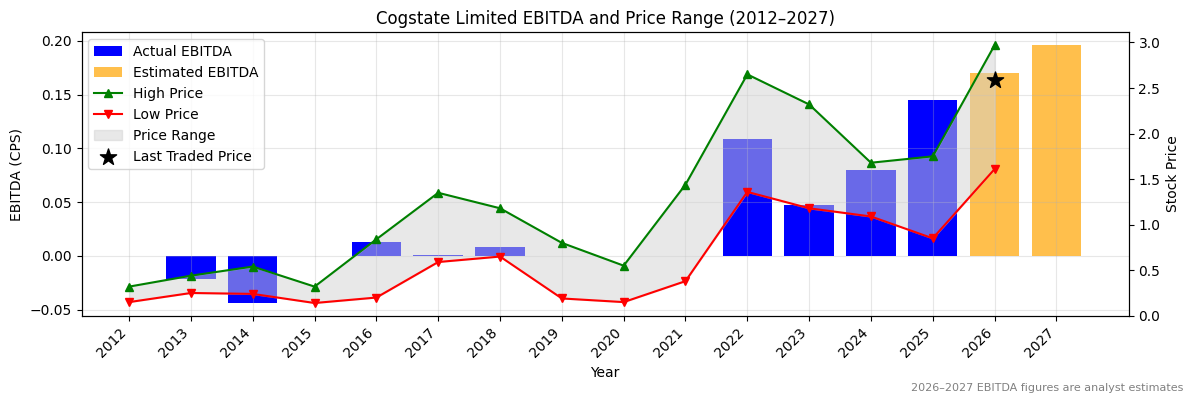
0.08033 |
0.14539 |
0.17029 |
81.0 |
17.1 |
CGS Revenue Per Share (2012–2027)
✅✅
CGS Earnings before Interest, Tax, Depreciation and Amortisation (EBITDA) Per Share (2012–2027)
✅✅
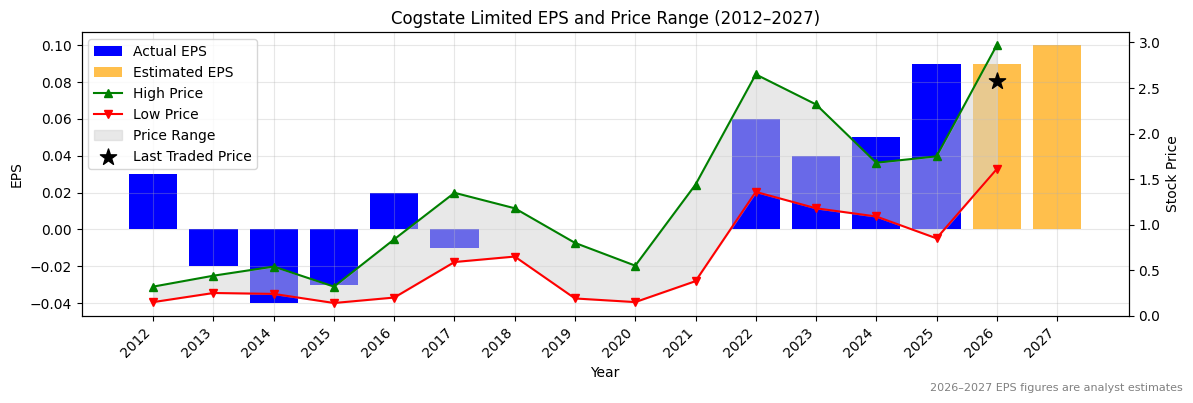
CGS Normalised Earnings Per Share (EPS) (2012–2027)
✅✅
Valuation
| Price To Sales |
Price To Book |
PER 2023 |
PER 2024 |
13Y Median PER Low |
PER 2025e |
13Y Median PER High |
PER 2026e |
Last Updated |
| 8.9 |
9.7 |
68.8 |
55.0 |
17.9 |
30.6 |
33.6 |
30.6 |
16/10/25 |
CGS Yearly Price Earnings Ratio (PER) Highs and Lows
✅
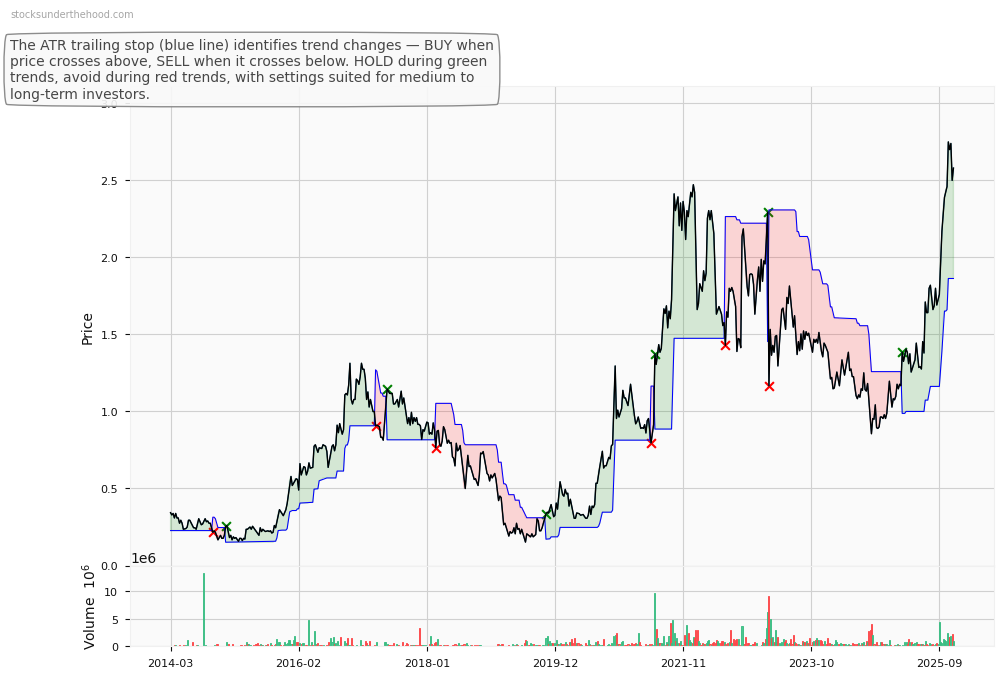
CGS Weekly Price Chart with Average True Range (ATR) Trailing Stop (10-Year View)
Ticker code: CGF
CGF Red Flags & Risk Indicators
⚠️
⚠️ RED FLAGS: 2 identified
- Increasing Shorts
- Falling Revenues
Income Statement
| Revenue 2024 Per Share |
Revenue 2025e Per Share |
Revenue 2026e Per Share |
Revenue 24 to 25e [%] |
Revenue 25e to 26e [%] |
EBITDA 2024 Per Share |
EBITDA 2025e Per Share |
EBITDA 2026e Per Share |
EBITDA 24 to 25e [%] |
EBITDA 25e to 26e [%] |
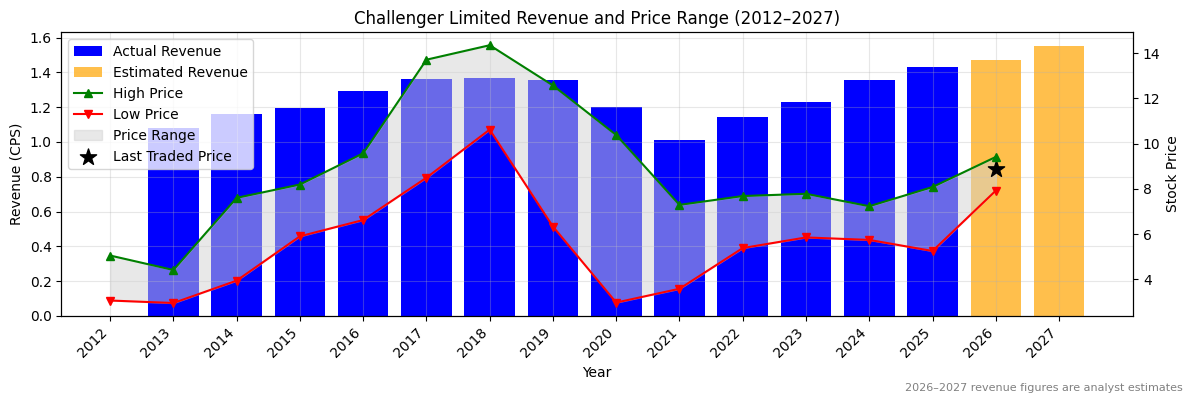
| 1.35567 |
1.42834 |
1.46987 |
5.4 |
2.9 |
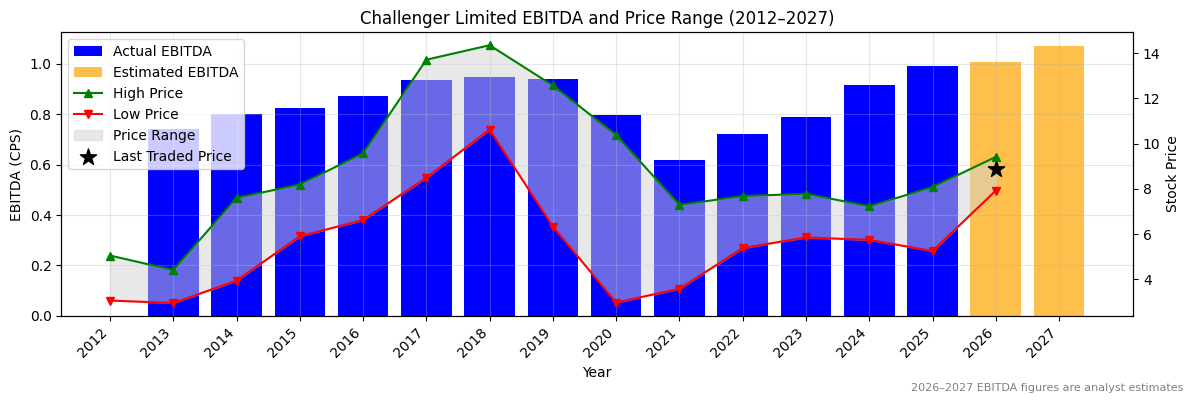
0.91719 |
0.99052 |
1.00541 |
8.0 |
1.5 |
CGF Revenue Per Share (2012–2027)
✅
CGF Earnings before Interest, Tax, Depreciation and Amortisation (EBITDA) Per Share (2012–2027)
✅
CGF Normalised Earnings Per Share (EPS) (2012–2027)
✅
Valuation
| Price To Sales |
Price To Book |
PER 2023 |
PER 2024 |
13Y Median PER Low |
PER 2025e |
13Y Median PER High |
PER 2026e |
Last Updated |
| 2.2 |
1.7 |
20.2 |
16.6 |
10.3 |
15.0 |
15.7 |
14.3 |
8/9/25 |
CGF Yearly Price Earnings Ratio (PER) Highs and Lows
✅
CGF Weekly Price Chart with Average True Range (ATR) Trailing Stop (10-Year View)
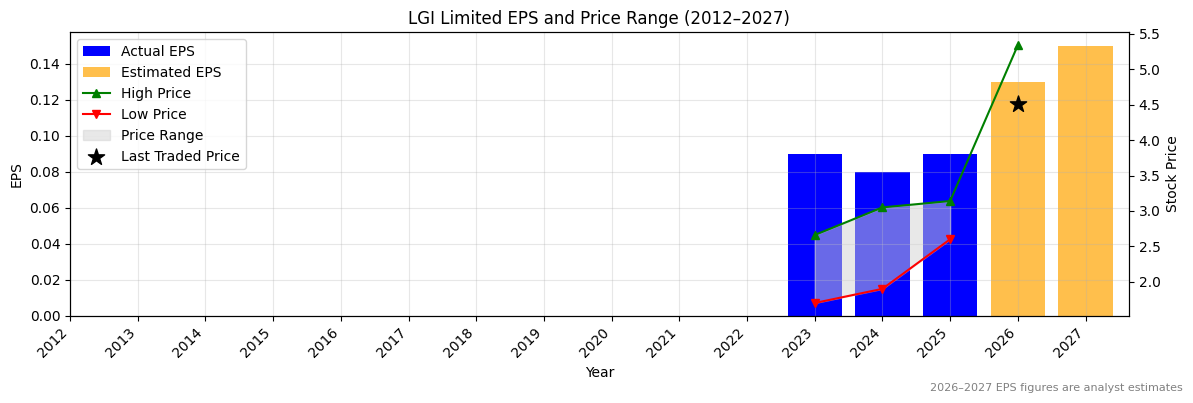
Ticker code: LGI
LGI Red Flags & Risk Indicators
⚠️
⚠️ RED FLAGS: 1 identified
Income Statement
| Revenue 2024 Per Share |
Revenue 2025e Per Share |
Revenue 2026e Per Share |
Revenue 24 to 25e [%] |
Revenue 25e to 26e [%] |
EBITDA 2024 Per Share |
EBITDA 2025e Per Share |
EBITDA 2026e Per Share |
EBITDA 24 to 25e [%] |
EBITDA 25e to 26e [%] |
| 0.37556 |
0.4148 |
0.43694 |
10.4 |
5.3 |
0.17228 |
0.19561 |
0.21842 |
13.5 |
11.7 |
LGI Revenue Per Share (2012–2027)
✅
LGI Earnings before Interest, Tax, Depreciation and Amortisation (EBITDA) Per Share (2012–2027)
✅
LGI Normalised Earnings Per Share (EPS) (2012–2027)
✅
Valuation
| Price To Sales |
Price To Book |
PER 2023 |
PER 2024 |
13Y Median PER Low |
PER 2025e |
13Y Median PER High |
PER 2026e |
Last Updated |
| 12.4 |
6.8 |
49.4 |
55.6 |
23.8 |
49.4 |
36.5 |
34.2 |
26/10/25 |
LGI Yearly Price Earnings Ratio (PER) Highs and Lows
❌
LGI Weekly Price Chart with Average True Range (ATR) Trailing Stop (10-Year View)
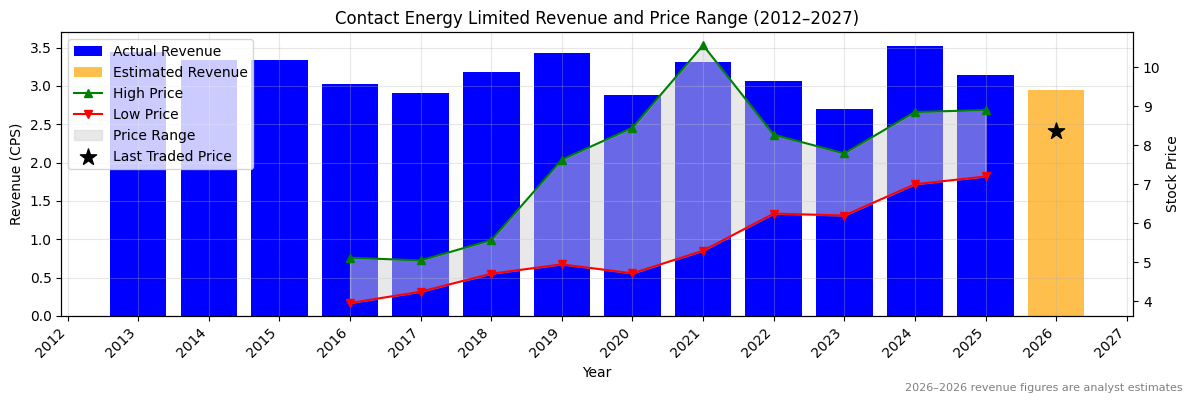
Ticker code: CEN
CEN Red Flags & Risk Indicators
⚠️
⚠️ RED FLAGS: 2 identified
- Falling Earnings
- High Relative Valuation
Income Statement
| Revenue 2024 Per Share |
Revenue 2025e Per Share |
Revenue 2026e Per Share |
Revenue 24 to 25e [%] |
Revenue 25e to 26e [%] |
EBITDA 2024 Per Share |
EBITDA 2025e Per Share |
EBITDA 2026e Per Share |
EBITDA 24 to 25e [%] |
EBITDA 25e to 26e [%] |
| 3.5221 |
3.1393 |
2.9474 |
-10.9 |
-6.1 |
0.84373 |
0.9673 |
0.87033 |
14.6 |
-10.0 |
CEN Revenue Per Share (2012–2027)
❌
CEN Earnings before Interest, Tax, Depreciation and Amortisation (EBITDA) Per Share (2012–2027)
✅
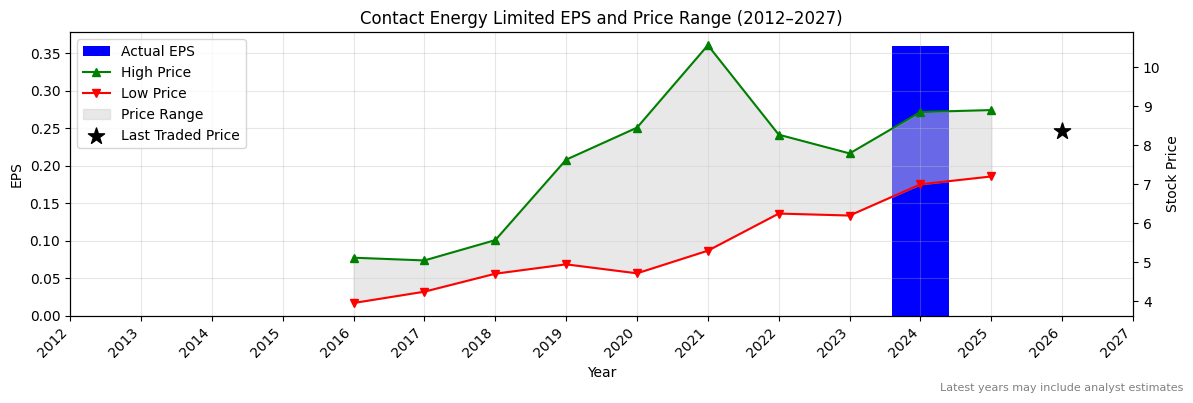
CEN Normalised Earnings Per Share (EPS) (2012–2027)
Valuation
| Price To Sales |
Price To Book |
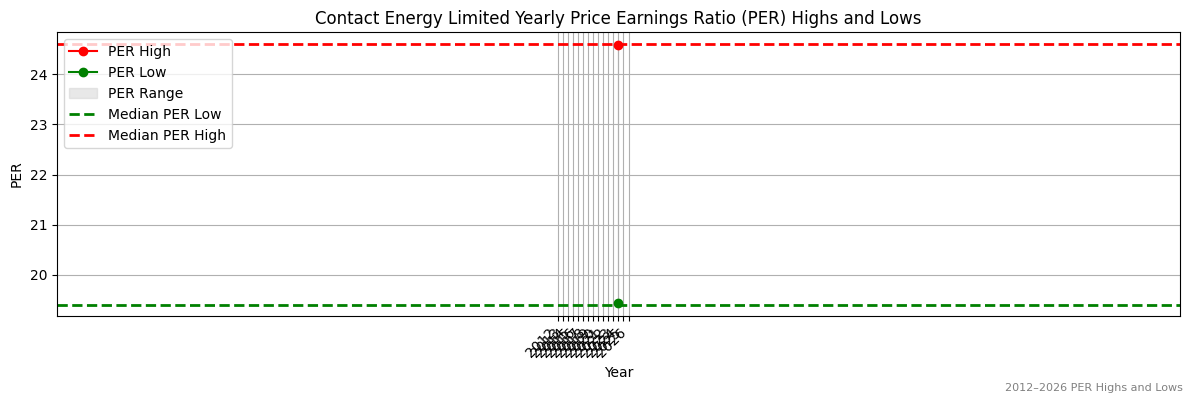
PER 2023 |
PER 2024 |
13Y Median PER Low |
PER 2025e |
13Y Median PER High |
PER 2026e |
Last Updated |
| 2.4 |
2.5 |
None |
22.9 |
18.9 |
None |
23.9 |
None |
29/7/24 |
CEN Yearly Price Earnings Ratio (PER) Highs and Lows
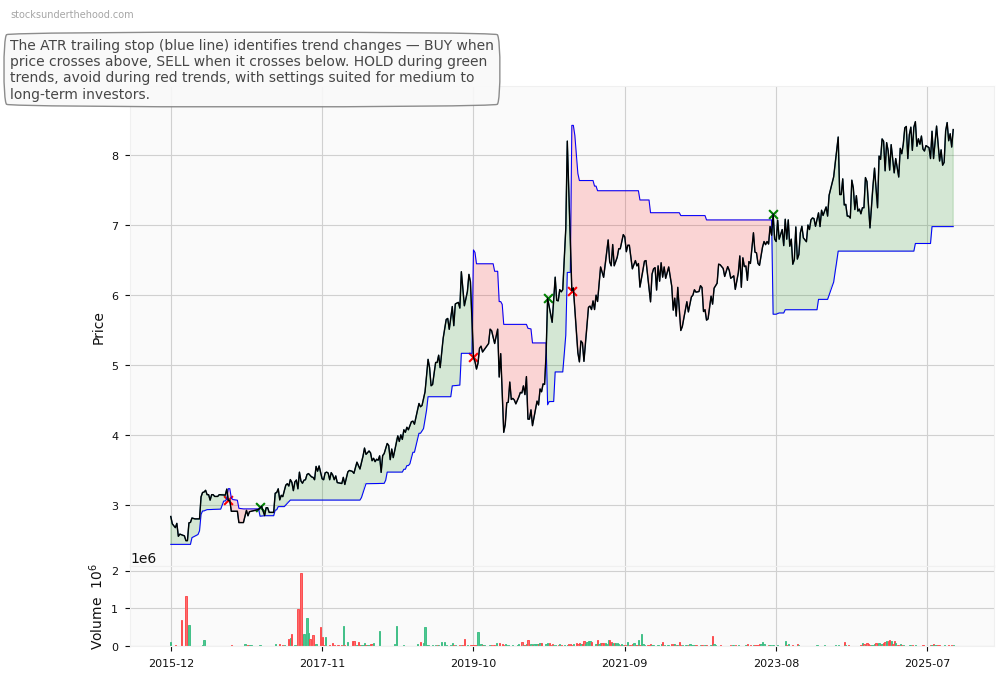
CEN Weekly Price Chart with Average True Range (ATR) Trailing Stop (10-Year View)
Ticker code: CEH
CEH Red Flags & Risk Indicators
⚠️
⚠️ RED FLAGS: 2 identified
- Increasing Shorts
- Falling Earnings
Income Statement
| Revenue 2024 Per Share |
Revenue 2025e Per Share |
Revenue 2026e Per Share |
Revenue 24 to 25e [%] |
Revenue 25e to 26e [%] |
EBITDA 2024 Per Share |
EBITDA 2025e Per Share |
EBITDA 2026e Per Share |
EBITDA 24 to 25e [%] |
EBITDA 25e to 26e [%] |
| 0.19728 |
0.22992 |
0.28837 |
16.5 |
25.4 |
0.00249 |
0.01034 |
0.03371 |
314.5 |
226.1 |
CEH Revenue Per Share (2012–2027)
✅
CEH Earnings before Interest, Tax, Depreciation and Amortisation (EBITDA) Per Share (2012–2027)
✅✅
CEH Normalised Earnings Per Share (EPS) (2012–2027)
✅✅
Valuation
| Price To Sales |
Price To Book |
PER 2023 |
PER 2024 |
13Y Median PER Low |
PER 2025e |
13Y Median PER High |
PER 2026e |
Last Updated |
| 1.8 |
0.8 |
-15.0 |
-45.0 |
None |
None |
None |
45.0 |
4/10/25 |
CEH Yearly Price Earnings Ratio (PER) Highs and Lows
CEH Weekly Price Chart with Average True Range (ATR) Trailing Stop (10-Year View)
Ticker code: CDA
CDA Red Flags & Risk Indicators
⚠️
⚠️ RED FLAGS: 2 identified
- Increasing Shorts
- High Relative Valuation
Income Statement
| Revenue 2024 Per Share |
Revenue 2025e Per Share |
Revenue 2026e Per Share |
Revenue 24 to 25e [%] |
Revenue 25e to 26e [%] |
EBITDA 2024 Per Share |
EBITDA 2025e Per Share |
EBITDA 2026e Per Share |
EBITDA 24 to 25e [%] |
EBITDA 25e to 26e [%] |
| 3.03591 |
3.71853 |
4.31289 |
22.5 |
16.0 |
0.81074 |
1.01315 |
1.25467 |
25.0 |
23.8 |
CDA Revenue Per Share (2012–2027)
✅✅
CDA Earnings before Interest, Tax, Depreciation and Amortisation (EBITDA) Per Share (2012–2027)
✅✅
CDA Normalised Earnings Per Share (EPS) (2012–2027)
✅✅
Valuation
| Price To Sales |
Price To Book |
PER 2023 |
PER 2024 |
13Y Median PER Low |
PER 2025e |
13Y Median PER High |
PER 2026e |
Last Updated |
| 9.8 |
12.6 |
100.7 |
80.6 |
10.3 |
63.6 |
24.3 |
52.5 |
11/10/25 |
CDA Yearly Price Earnings Ratio (PER) Highs and Lows
❌
CDA Weekly Price Chart with Average True Range (ATR) Trailing Stop (10-Year View)
Ticker code: CCX
CCX Red Flags & Risk Indicators
❌
⚠️ RED FLAGS: 4 identified
- Negative Operating Cash Flow
- Low Operating Margin
- Increasing Shorts
- Risk Of Capital Raise
Income Statement
| Revenue 2024 Per Share |
Revenue 2025e Per Share |
Revenue 2026e Per Share |
Revenue 24 to 25e [%] |
Revenue 25e to 26e [%] |
EBITDA 2024 Per Share |
EBITDA 2025e Per Share |
EBITDA 2026e Per Share |
EBITDA 24 to 25e [%] |
EBITDA 25e to 26e [%] |
| 0.39123 |
0.3509 |
0.36423 |
-10.3 |
3.8 |
-0.02497 |
0.01644 |
0.03436 |
165.8 |
109.0 |
CCX Revenue Per Share (2012–2027)
❌
CCX Earnings before Interest, Tax, Depreciation and Amortisation (EBITDA) Per Share (2012–2027)
✅✅
CCX Normalised Earnings Per Share (EPS) (2012–2027)
✅✅
Valuation
| Price To Sales |
Price To Book |
PER 2023 |
PER 2024 |
13Y Median PER Low |
PER 2025e |
13Y Median PER High |
PER 2026e |
Last Updated |
| 0.2 |
0.9 |
-0.4 |
-0.5 |
11.0 |
-2.7 |
18.3 |
-8.2 |
11/10/25 |
CCX Yearly Price Earnings Ratio (PER) Highs and Lows
✅✅
CCX Weekly Price Chart with Average True Range (ATR) Trailing Stop (10-Year View)
Ticker code: CCR
CCR Red Flags & Risk Indicators
⚠️
⚠️ RED FLAGS: 1 identified
Income Statement
| Revenue 2024 Per Share |
Revenue 2025e Per Share |
Revenue 2026e Per Share |
Revenue 24 to 25e [%] |
Revenue 25e to 26e [%] |
EBITDA 2024 Per Share |
EBITDA 2025e Per Share |
EBITDA 2026e Per Share |
EBITDA 24 to 25e [%] |
EBITDA 25e to 26e [%] |
| 0.10061 |
0.11144 |
0.10684 |
10.8 |
-4.1 |
0.01013 |
0.01757 |
0.02001 |
73.4 |
13.9 |
CCR Revenue Per Share (2012–2027)
✅
CCR Earnings before Interest, Tax, Depreciation and Amortisation (EBITDA) Per Share (2012–2027)
✅✅
CCR Normalised Earnings Per Share (EPS) (2012–2027)
✅✅
Valuation
| Price To Sales |
Price To Book |
PER 2023 |
PER 2024 |
13Y Median PER Low |
PER 2025e |
13Y Median PER High |
PER 2026e |
Last Updated |
| 3.0 |
1.9 |
None |
-14.5 |
20.0 |
29.0 |
37.0 |
14.5 |
11/10/25 |
CCR Yearly Price Earnings Ratio (PER) Highs and Lows
✅
CCR Weekly Price Chart with Average True Range (ATR) Trailing Stop (10-Year View)
Ticker code: CCP
CCP Red Flags & Risk Indicators
⚠️
⚠️ RED FLAGS: 2 identified
- Low Operating Margin
- Falling Earnings
Income Statement
| Revenue 2024 Per Share |
Revenue 2025e Per Share |
Revenue 2026e Per Share |
Revenue 24 to 25e [%] |
Revenue 25e to 26e [%] |
EBITDA 2024 Per Share |
EBITDA 2025e Per Share |
EBITDA 2026e Per Share |
EBITDA 24 to 25e [%] |
EBITDA 25e to 26e [%] |
| 6.99662 |
8.03394 |
8.4574 |
14.8 |
5.3 |
2.23138 |
2.62979 |
2.84734 |
17.9 |
8.3 |
CCP Revenue Per Share (2012–2027)
✅
CCP Earnings before Interest, Tax, Depreciation and Amortisation (EBITDA) Per Share (2012–2027)
✅
CCP Normalised Earnings Per Share (EPS) (2012–2027)
✅
Valuation
| Price To Sales |
Price To Book |
PER 2023 |
PER 2024 |
13Y Median PER Low |
PER 2025e |
13Y Median PER High |
PER 2026e |
Last Updated |
| 2.2 |
1.1 |
11.2 |
12.5 |
10.5 |
10.7 |
17.5 |
9.9 |
5/5/25 |
CCP Yearly Price Earnings Ratio (PER) Highs and Lows
✅
CCP Weekly Price Chart with Average True Range (ATR) Trailing Stop (10-Year View)
Ticker code: CCM
CCM Red Flags & Risk Indicators
⚠️
⚠️ RED FLAGS: 2 identified
- Zero Revenue
- Falling Earnings
Income Statement
| Revenue 2024 Per Share |
Revenue 2025e Per Share |
Revenue 2026e Per Share |
Revenue 24 to 25e [%] |
Revenue 25e to 26e [%] |
EBITDA 2024 Per Share |
EBITDA 2025e Per Share |
EBITDA 2026e Per Share |
EBITDA 24 to 25e [%] |
EBITDA 25e to 26e [%] |
| None |
None |
None |
None |
None |
-0.01049 |
None |
None |
None |
None |
CCM Revenue Per Share (2012–2027)
CCM Earnings before Interest, Tax, Depreciation and Amortisation (EBITDA) Per Share (2012–2027)
CCM Normalised Earnings Per Share (EPS) (2012–2027)
❌
Valuation
| Price To Sales |
Price To Book |
PER 2023 |
PER 2024 |
13Y Median PER Low |
PER 2025e |
13Y Median PER High |
PER 2026e |
Last Updated |
| 313.7 |
3.7 |
None |
-6.0 |
2.5 |
-6.0 |
None |
6.0 |
29/4/23 |
CCM Yearly Price Earnings Ratio (PER) Highs and Lows
CCM Weekly Price Chart with Average True Range (ATR) Trailing Stop (10-Year View)
Ticker code: CBA
CBA Red Flags & Risk Indicators
⚠️
⚠️ RED FLAGS: 2 identified
- Low Operating Margin
- High Relative Valuation
Income Statement
| Revenue 2024 Per Share |
Revenue 2025e Per Share |
Revenue 2026e Per Share |
Revenue 24 to 25e [%] |
Revenue 25e to 26e [%] |
EBITDA 2024 Per Share |
EBITDA 2025e Per Share |
EBITDA 2026e Per Share |
EBITDA 24 to 25e [%] |
EBITDA 25e to 26e [%] |
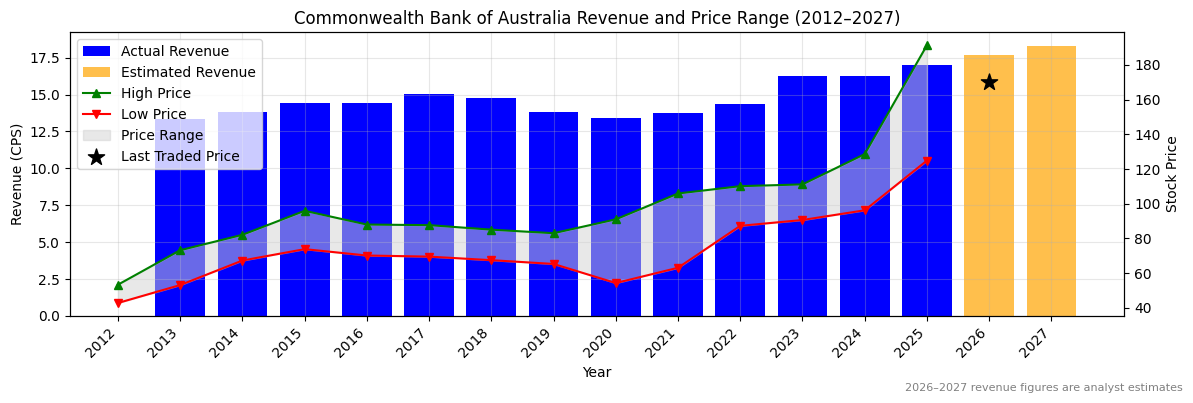
| 16.23685 |
16.98354 |
17.66962 |
4.6 |
4.0 |
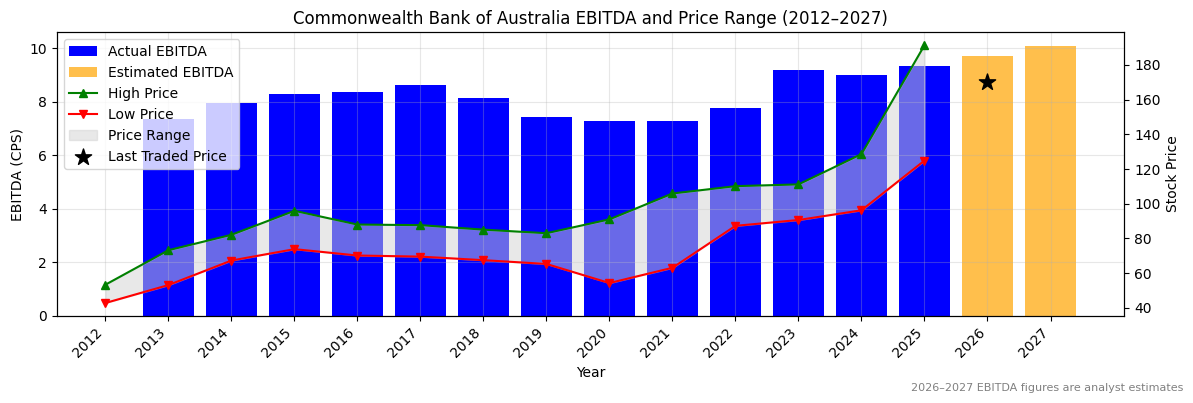
8.9896 |
9.32028 |
9.70738 |
3.7 |
4.2 |
CBA Revenue Per Share (2012–2027)
✅
CBA Earnings before Interest, Tax, Depreciation and Amortisation (EBITDA) Per Share (2012–2027)
✅
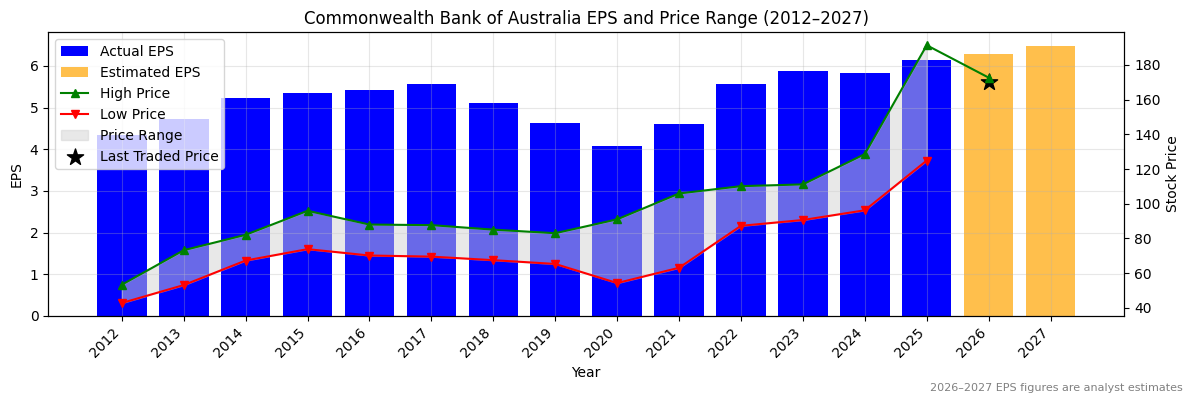
CBA Normalised Earnings Per Share (EPS) (2012–2027)
✅
Valuation
| Price To Sales |
Price To Book |
PER 2023 |
PER 2024 |
13Y Median PER Low |
PER 2025e |
13Y Median PER High |
PER 2026e |
Last Updated |
| 10.4 |
3.6 |
29.2 |
29.4 |
13.5 |
27.9 |
17.9 |
27.3 |
2/8/25 |
CBA Yearly Price Earnings Ratio (PER) Highs and Lows
❌
CBA Weekly Price Chart with Average True Range (ATR) Trailing Stop (10-Year View)
Ticker code: ASX:CAT
ASX:CAT Red Flags & Risk Indicators
⚠️
⚠️ RED FLAGS: 2 identified
- Falling Revenues
- High Price to Book vs ROE
Income Statement
| Revenue 2024 Per Share |
Revenue 2025e Per Share |
Revenue 2026e Per Share |
Revenue 24 to 25e [%] |
Revenue 25e to 26e [%] |
EBITDA 2024 Per Share |
EBITDA 2025e Per Share |
EBITDA 2026e Per Share |
EBITDA 24 to 25e [%] |
EBITDA 25e to 26e [%] |
| 0.5785 |
0.64179 |
0.72603 |
10.9 |
13.1 |
0.05423 |
0.09976 |
0.15023 |
83.9 |
50.6 |
ASX:CAT Revenue Per Share (2012–2027)
✅
ASX:CAT Earnings before Interest, Tax, Depreciation and Amortisation (EBITDA) Per Share (2012–2027)
✅✅
ASX:CAT Normalised Earnings Per Share (EPS) (2012–2027)
✅✅
Valuation
| Price To Sales |
Price To Book |
PER 2023 |
PER 2024 |
13Y Median PER Low |
PER 2025e |
13Y Median PER High |
PER 2026e |
Last Updated |
| 14.8 |
19.5 |
-50.7 |
-152.0 |
58.3 |
202.7 |
208.3 |
-304.0 |
17/8/25 |
ASX:CAT Yearly Price Earnings Ratio (PER) Highs and Lows
✅
ASX:CAT Weekly Price Chart with Average True Range (ATR) Trailing Stop (10-Year View)
Ticker code: CAR
CAR Red Flags & Risk Indicators
⚠️
⚠️ RED FLAGS: 2 identified
- Increasing Shorts
- High Relative Valuation
Income Statement
| Revenue 2024 Per Share |
Revenue 2025e Per Share |
Revenue 2026e Per Share |
Revenue 24 to 25e [%] |
Revenue 25e to 26e [%] |
EBITDA 2024 Per Share |
EBITDA 2025e Per Share |
EBITDA 2026e Per Share |
EBITDA 24 to 25e [%] |
EBITDA 25e to 26e [%] |
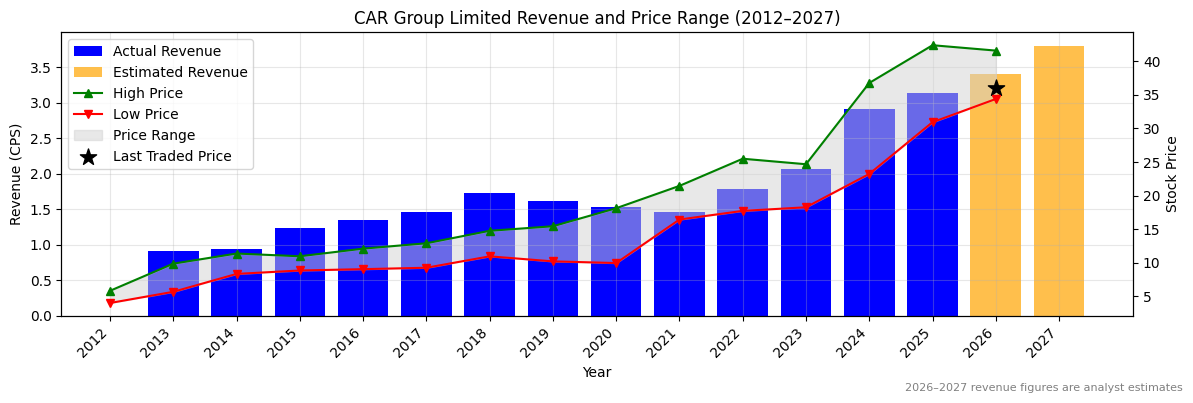
| 2.91357 |
3.13855 |
3.41107 |
7.7 |
8.7 |
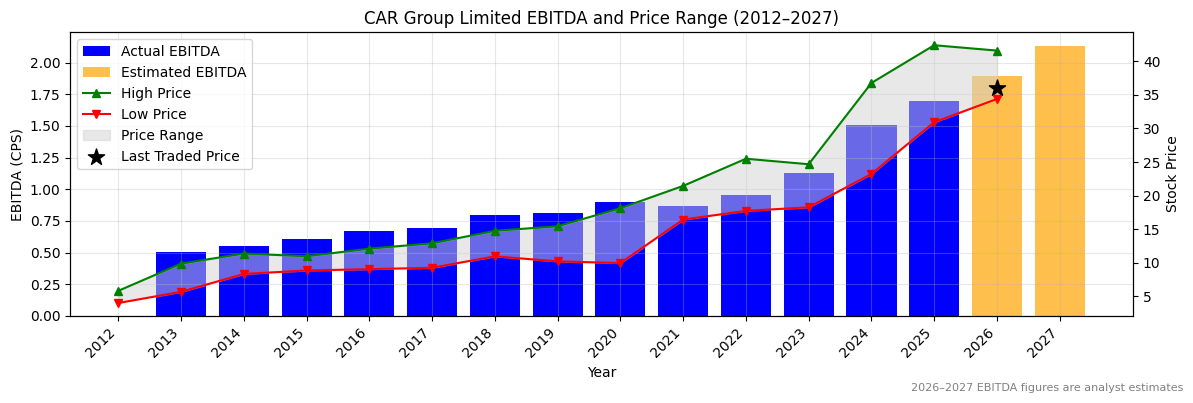
1.50583 |
1.69622 |
1.89526 |
12.6 |
11.7 |
CAR Revenue Per Share (2012–2027)
✅
CAR Earnings before Interest, Tax, Depreciation and Amortisation (EBITDA) Per Share (2012–2027)
✅
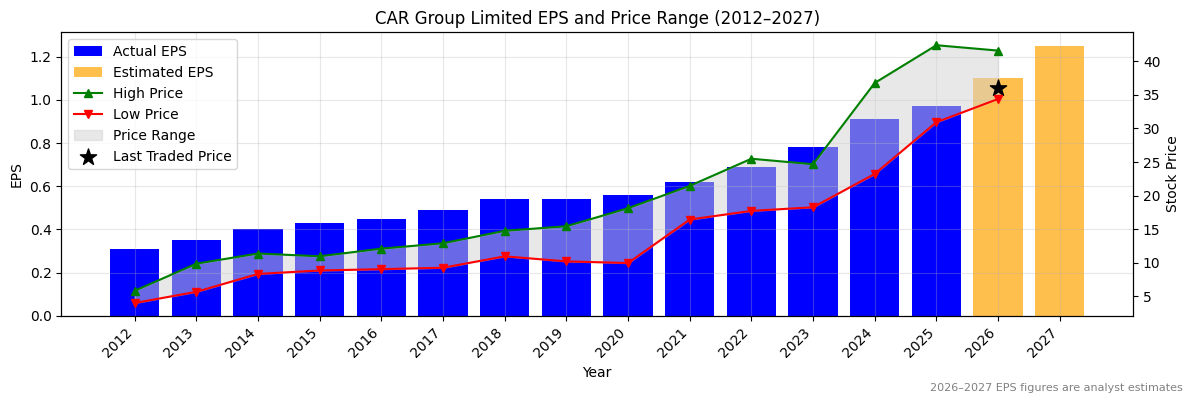
CAR Normalised Earnings Per Share (EPS) (2012–2027)
✅
Valuation
| Price To Sales |
Price To Book |
PER 2023 |
PER 2024 |
13Y Median PER Low |
PER 2025e |
13Y Median PER High |
PER 2026e |
Last Updated |
| 11.4 |
4.5 |
45.8 |
39.2 |
20.5 |
36.8 |
28.6 |
32.5 |
26/10/25 |
CAR Yearly Price Earnings Ratio (PER) Highs and Lows
❌
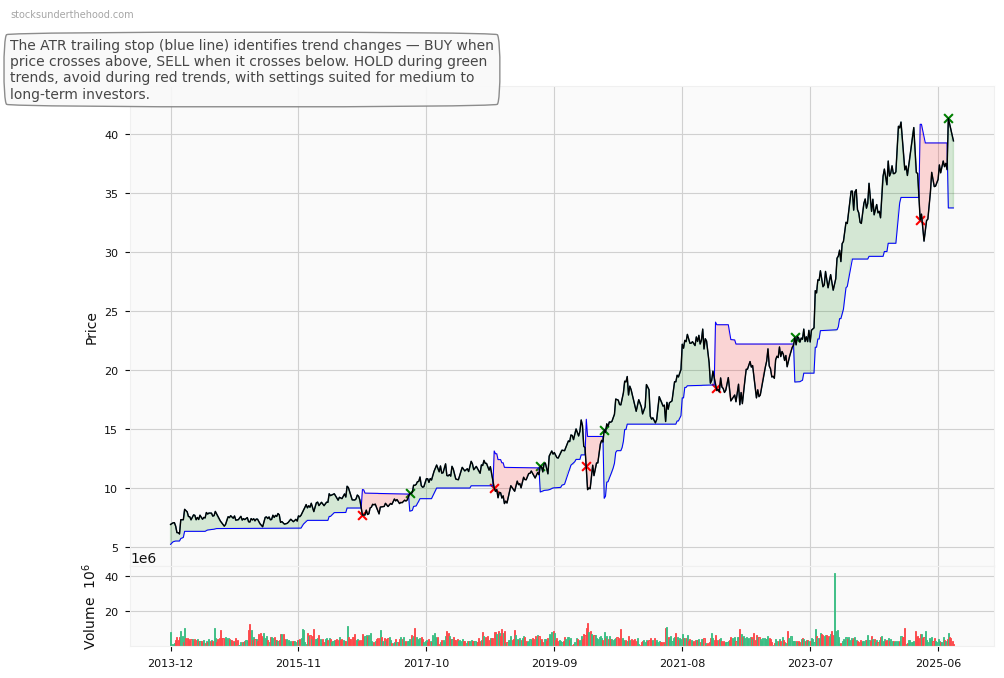
CAR Weekly Price Chart with Average True Range (ATR) Trailing Stop (10-Year View)
Ticker code: C79
C79 Red Flags & Risk Indicators
⚠️
⚠️ RED FLAGS: 2 identified
- Falling Earnings
- High Price to Book vs ROE
Income Statement
| Revenue 2024 Per Share |
Revenue 2025e Per Share |
Revenue 2026e Per Share |
Revenue 24 to 25e [%] |
Revenue 25e to 26e [%] |
EBITDA 2024 Per Share |
EBITDA 2025e Per Share |
EBITDA 2026e Per Share |
EBITDA 24 to 25e [%] |
EBITDA 25e to 26e [%] |
| 0.39444 |
0.57378 |
0.75414 |
45.5 |
31.4 |
0.07783 |
0.13868 |
0.21764 |
78.2 |
56.9 |
C79 Revenue Per Share (2012–2027)
✅✅
C79 Earnings before Interest, Tax, Depreciation and Amortisation (EBITDA) Per Share (2012–2027)
✅✅
C79 Normalised Earnings Per Share (EPS) (2012–2027)
❌
Valuation
| Price To Sales |
Price To Book |
PER 2023 |
PER 2024 |
13Y Median PER Low |
PER 2025e |
13Y Median PER High |
PER 2026e |
Last Updated |
| 14.2 |
4.7 |
805.0 |
-805.0 |
262.8 |
-115.0 |
492.0 |
402.5 |
28/9/25 |
C79 Yearly Price Earnings Ratio (PER) Highs and Lows
✅✅
C79 Weekly Price Chart with Average True Range (ATR) Trailing Stop (10-Year View)