Ticker code: BXB
BXB Red Flags & Risk Indicators
⚠️
⚠️ RED FLAGS: 1 identified
Income Statement
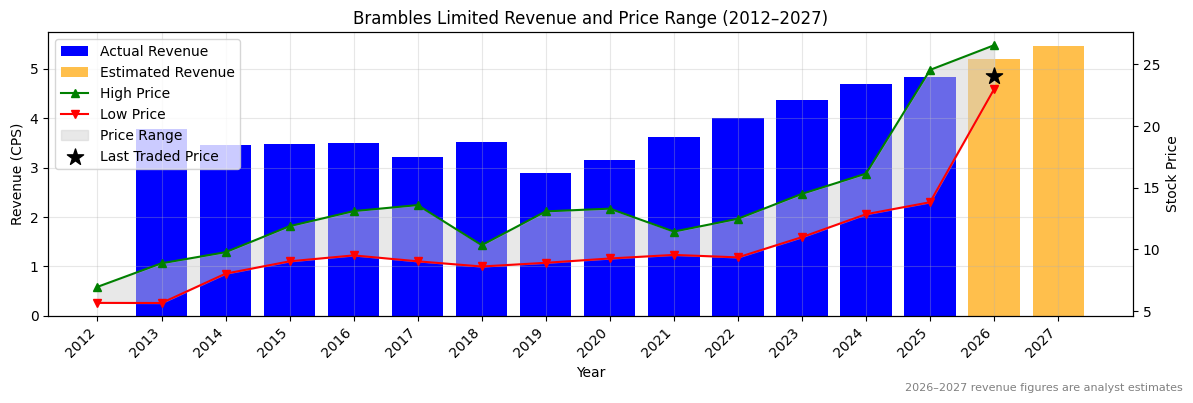
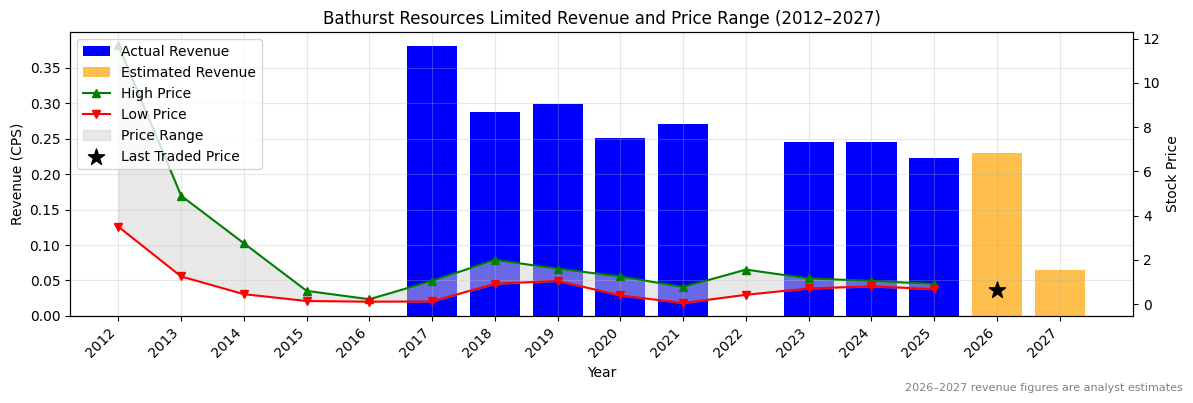
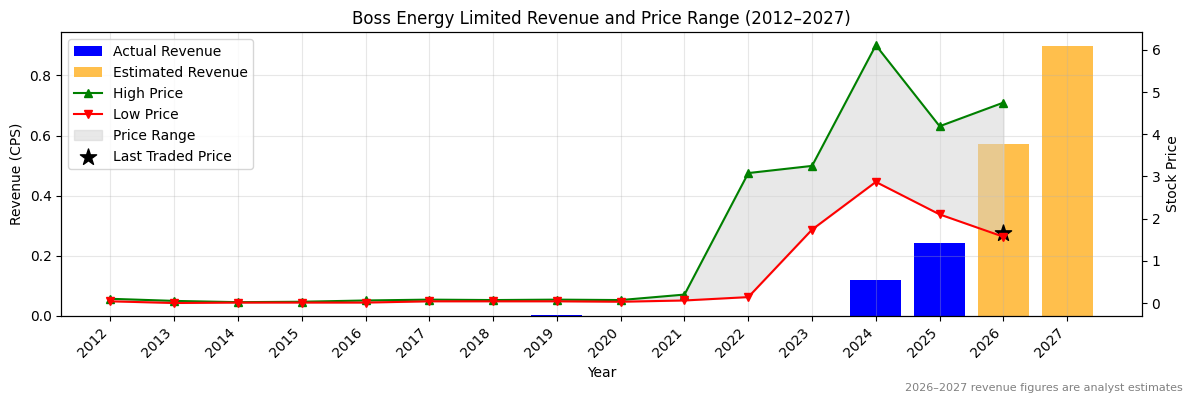
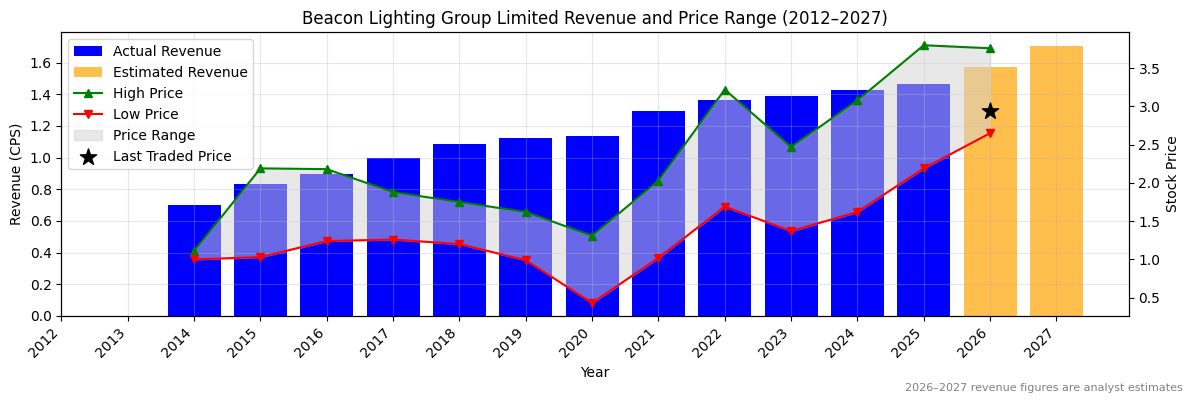
| Revenue 2024 Per Share |
Revenue 2025e Per Share |
Revenue 2026e Per Share |
Revenue 24 to 25e [%] |
Revenue 25e to 26e [%] |
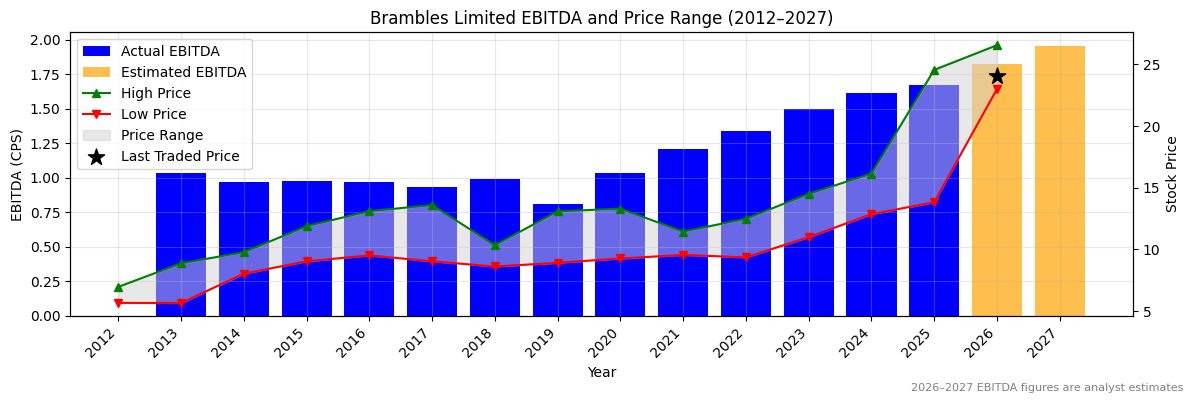
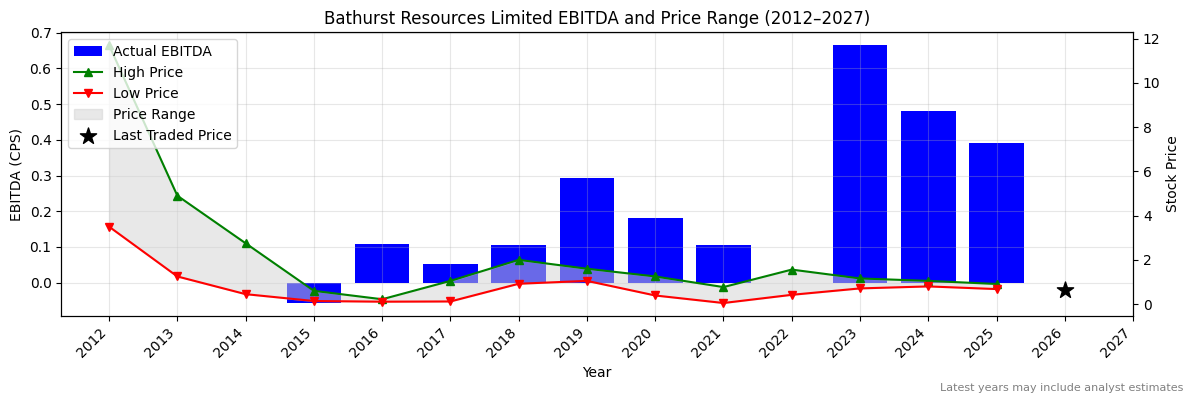
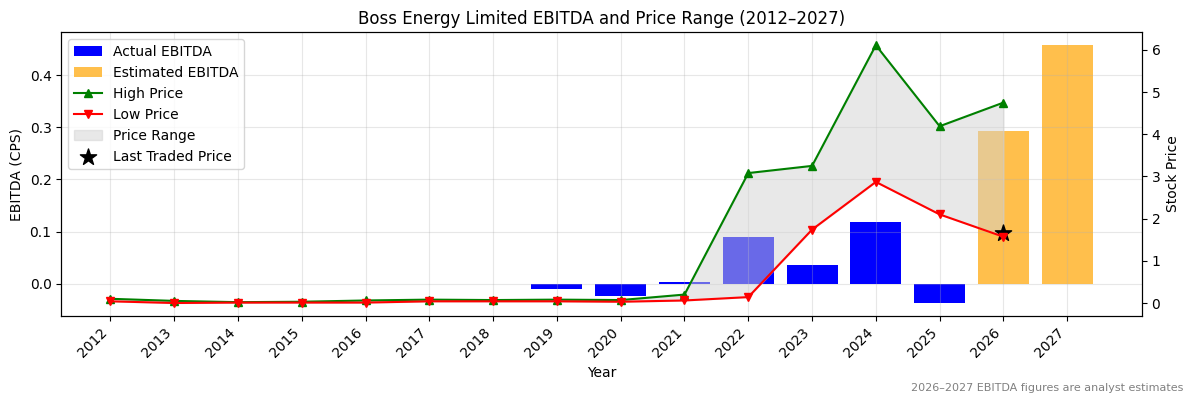
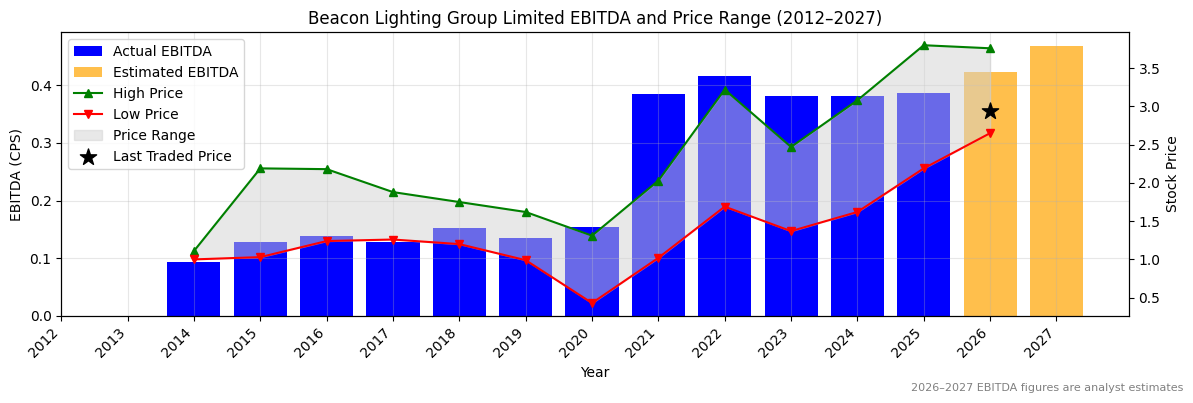
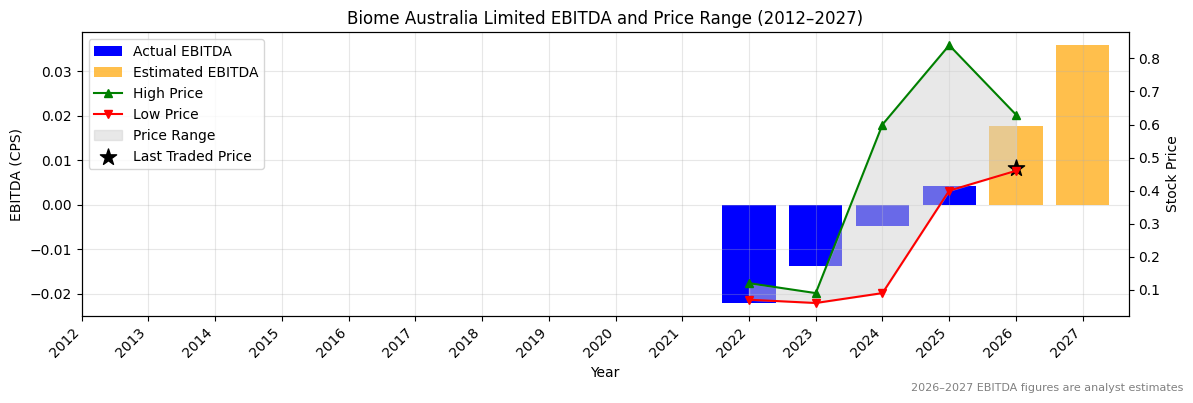
EBITDA 2024 Per Share |
EBITDA 2025e Per Share |
EBITDA 2026e Per Share |
EBITDA 24 to 25e [%] |
EBITDA 25e to 26e [%] |
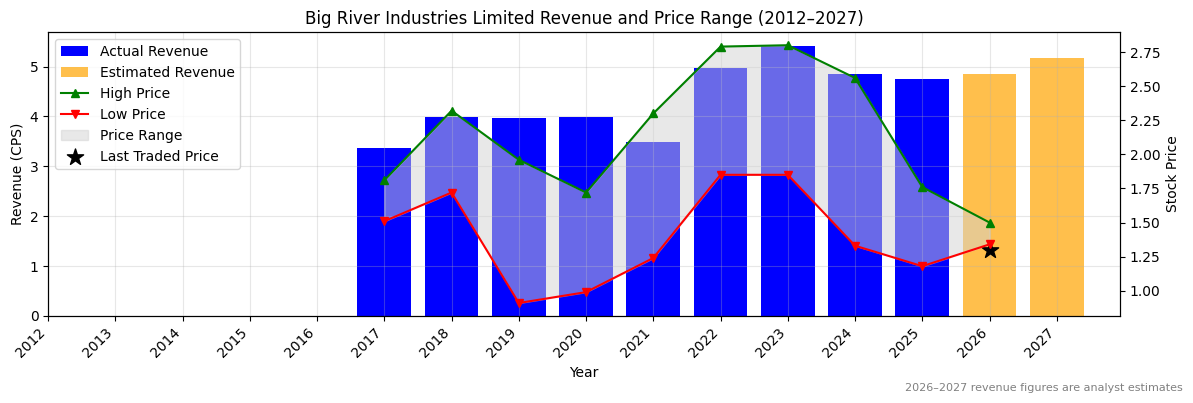
| 4.70005 |
4.99137 |
5.2088 |
6.2 |
4.4 |
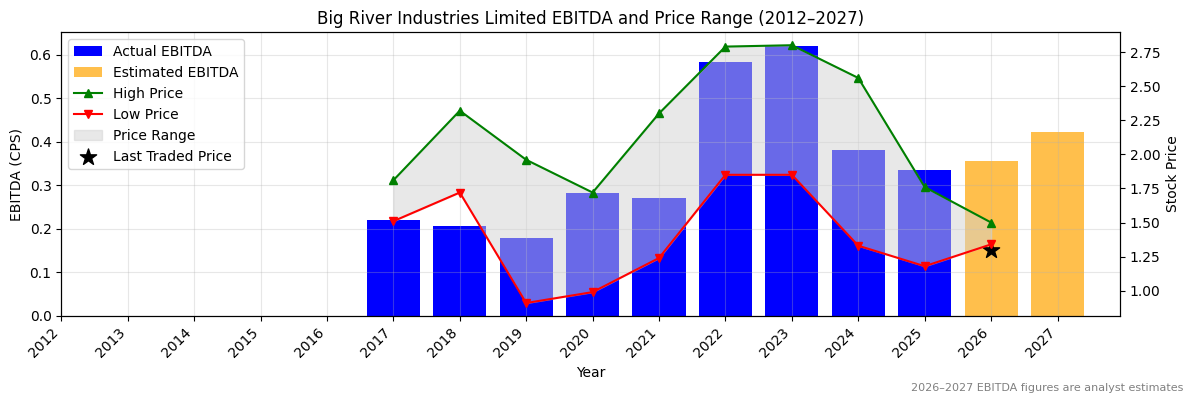
1.61544 |
1.70387 |
1.8193 |
5.5 |
6.8 |
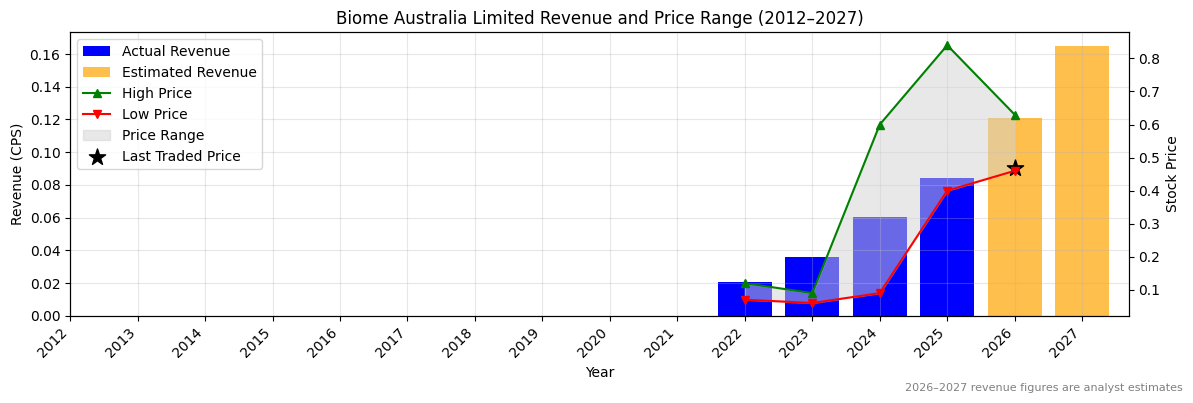
BXB Revenue Per Share (2012–2027)
✅
BXB Earnings before Interest, Tax, Depreciation and Amortisation (EBITDA) Per Share (2012–2027)
✅
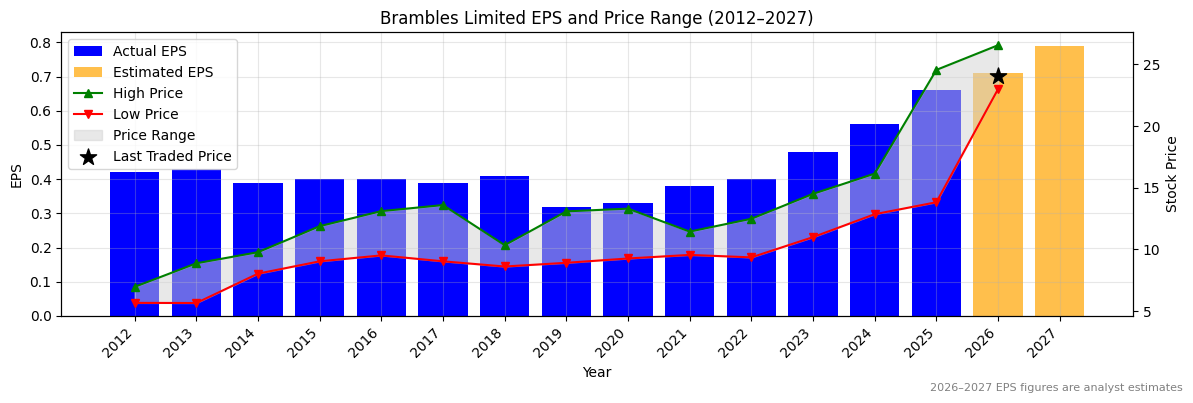
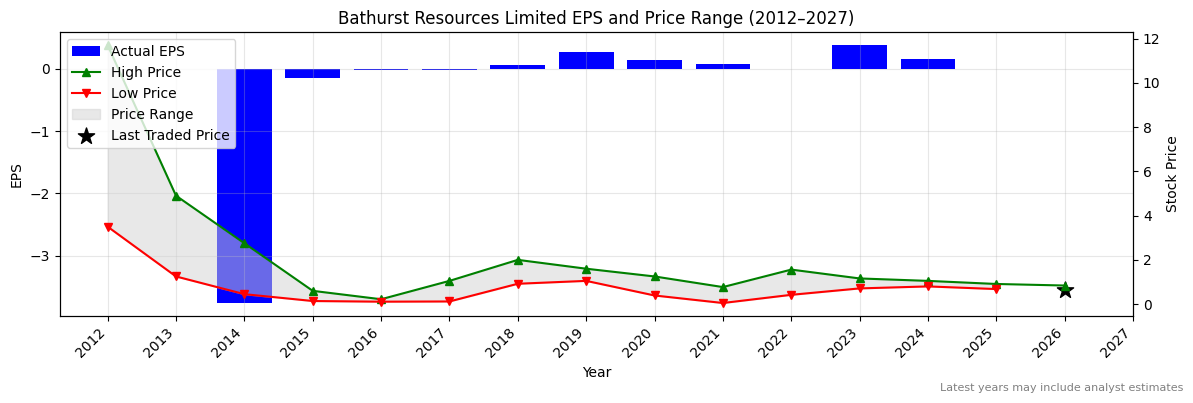
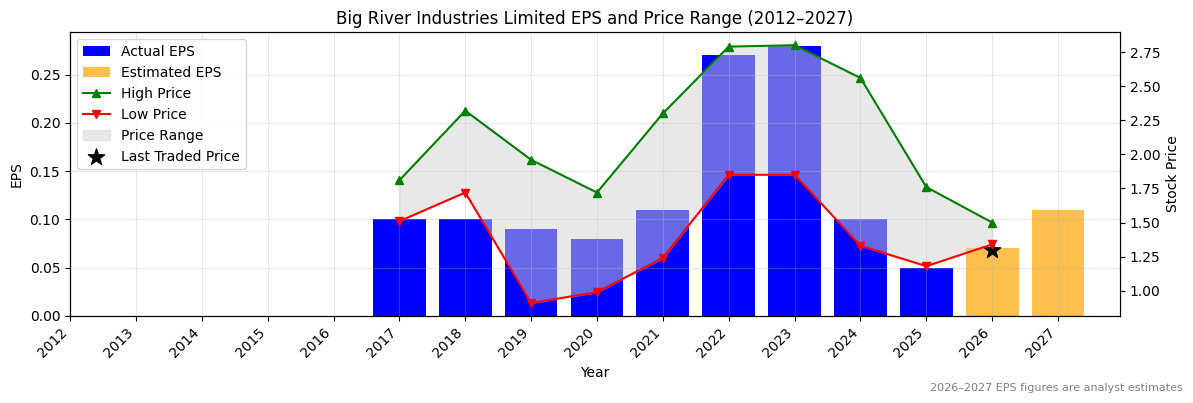
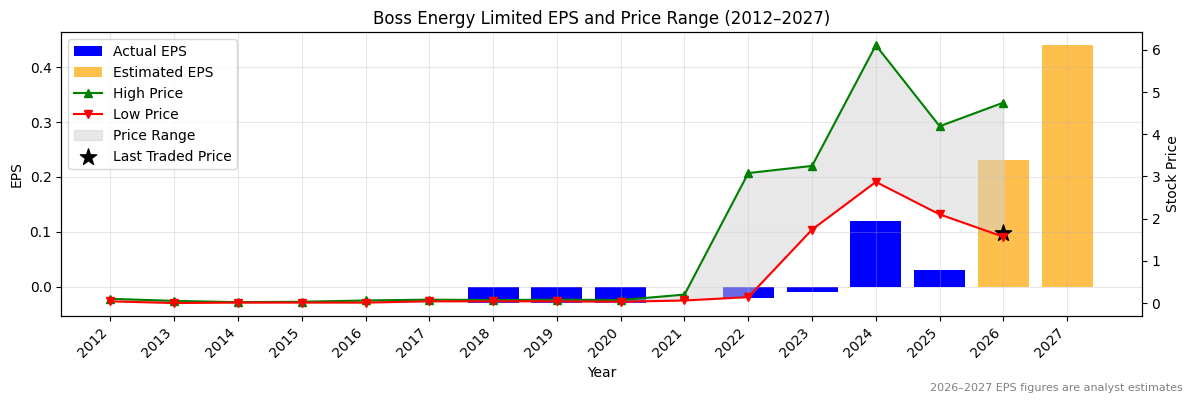
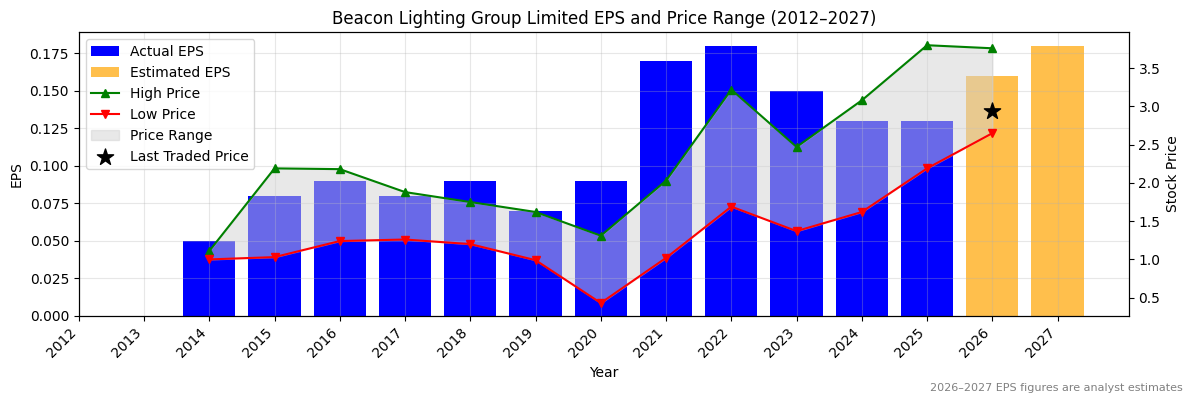
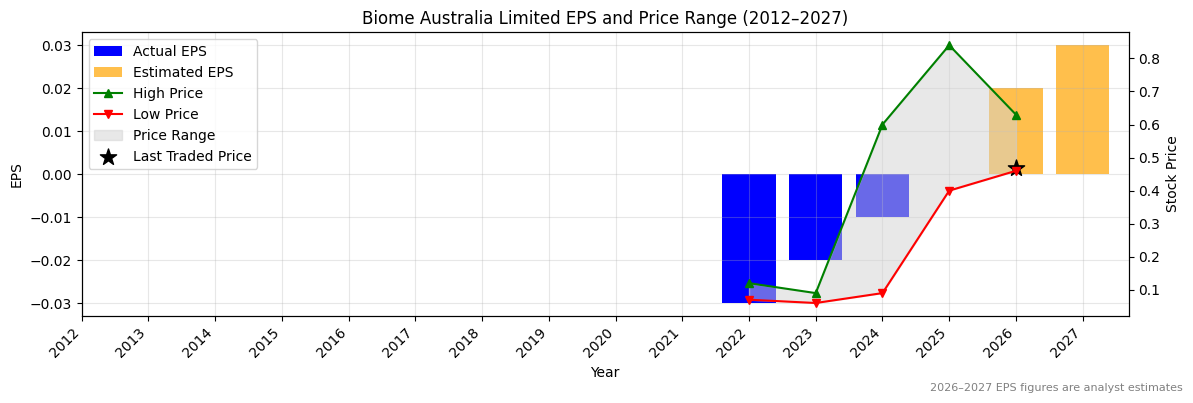
BXB Normalised Earnings Per Share (EPS) (2012–2027)
✅
Valuation
| Price To Sales |
Price To Book |
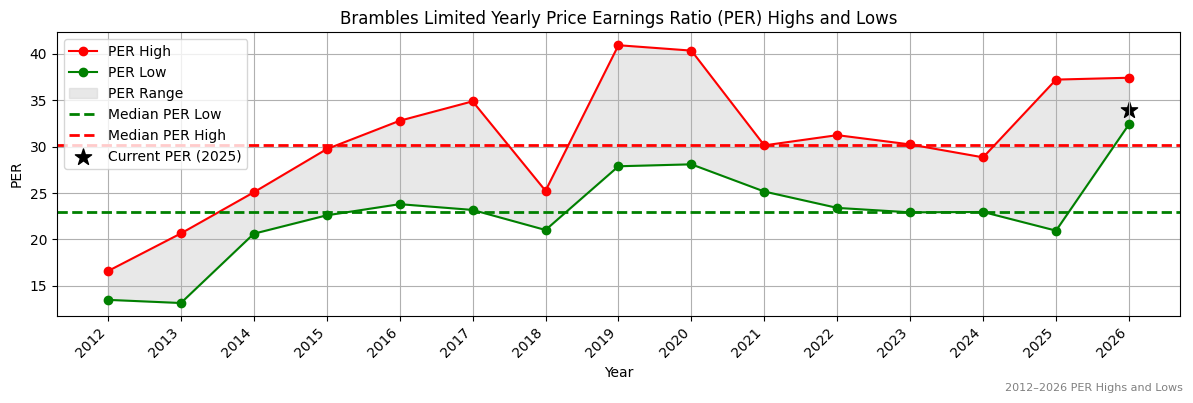
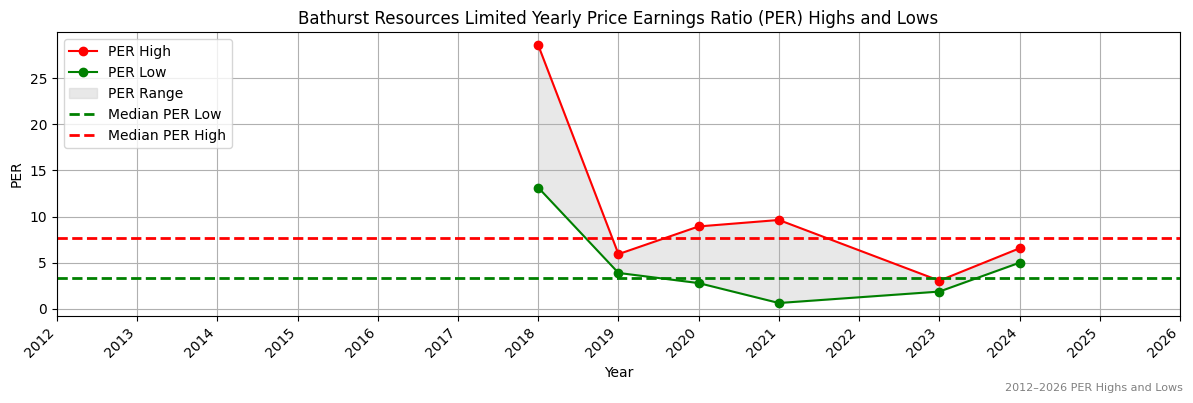
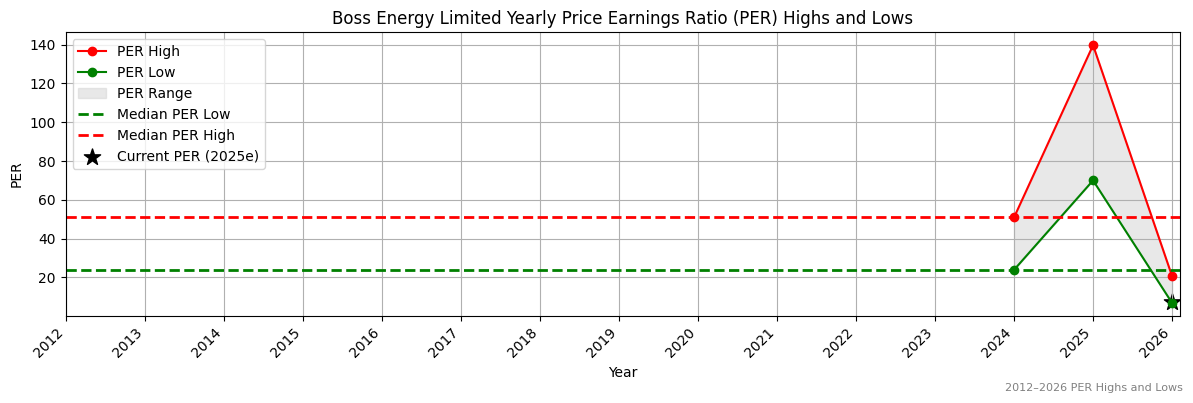
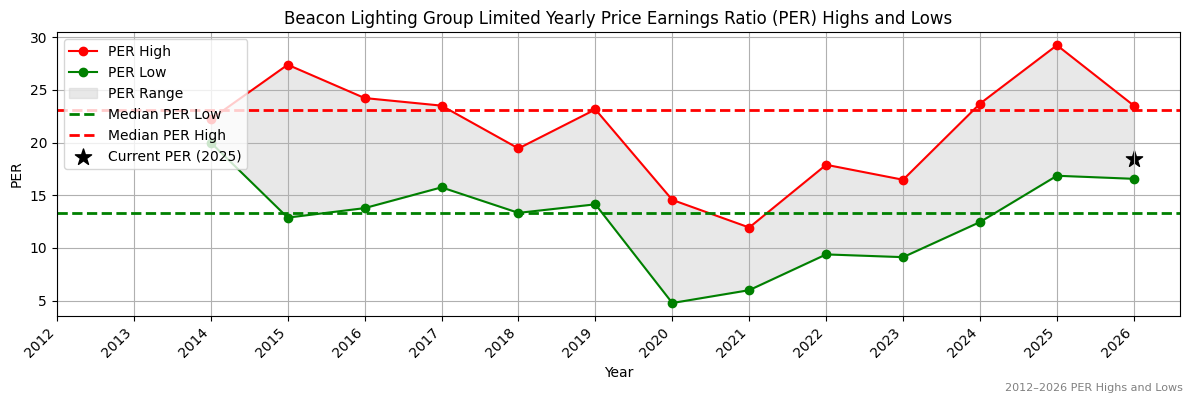
PER 2023 |
PER 2024 |
13Y Median PER Low |
PER 2025e |
13Y Median PER High |
PER 2026e |
Last Updated |
| 5.0 |
10.1 |
51.8 |
44.4 |
23.0 |
40.1 |
30.2 |
36.0 |
21/4/25 |
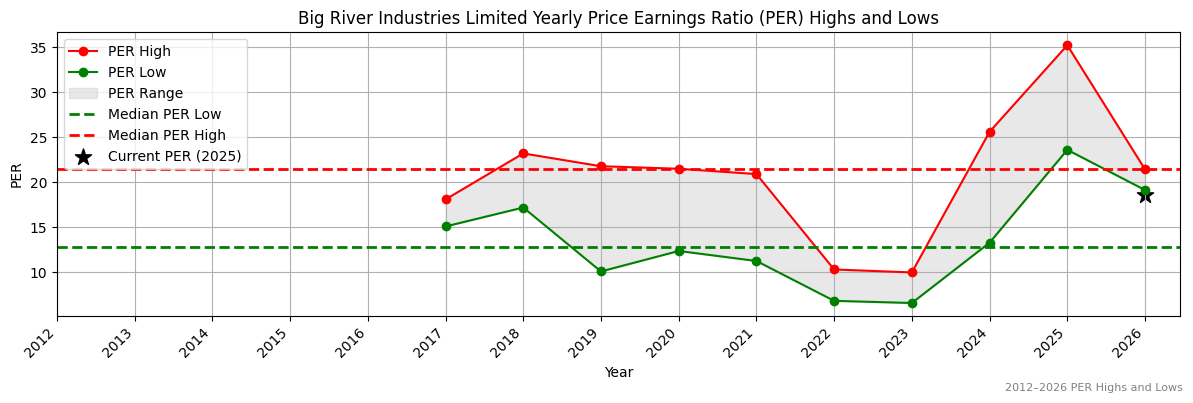
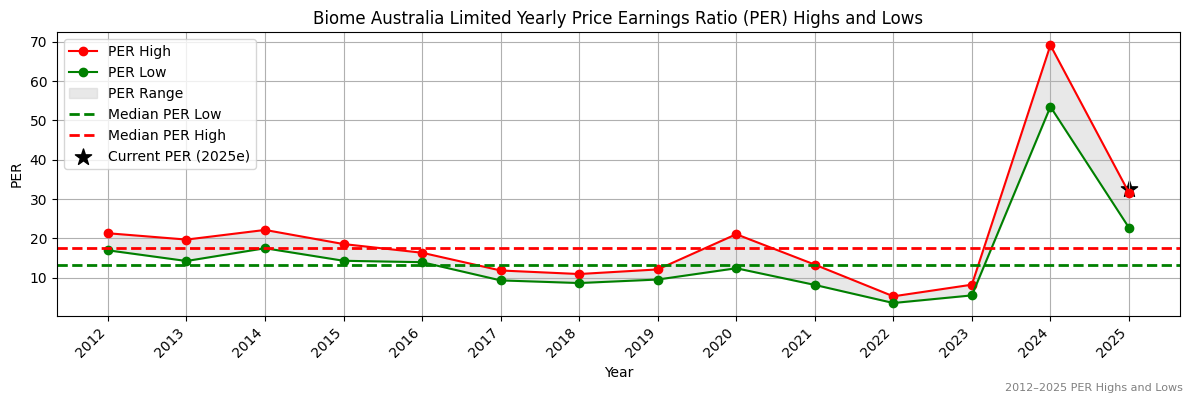
BXB Yearly Price Earnings Ratio (PER) Highs and Lows
❌
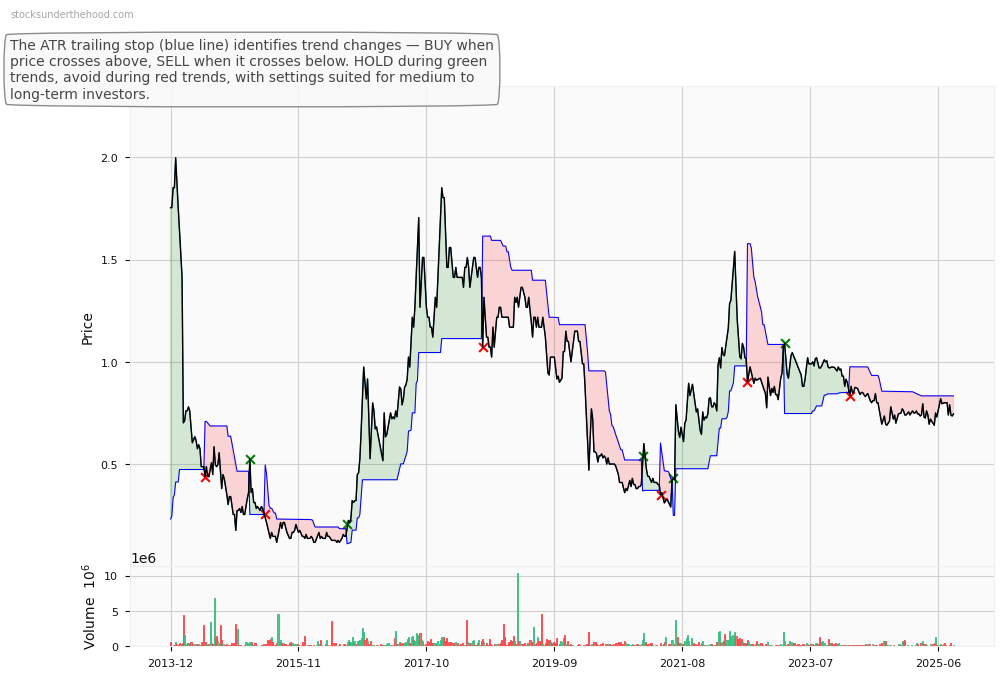
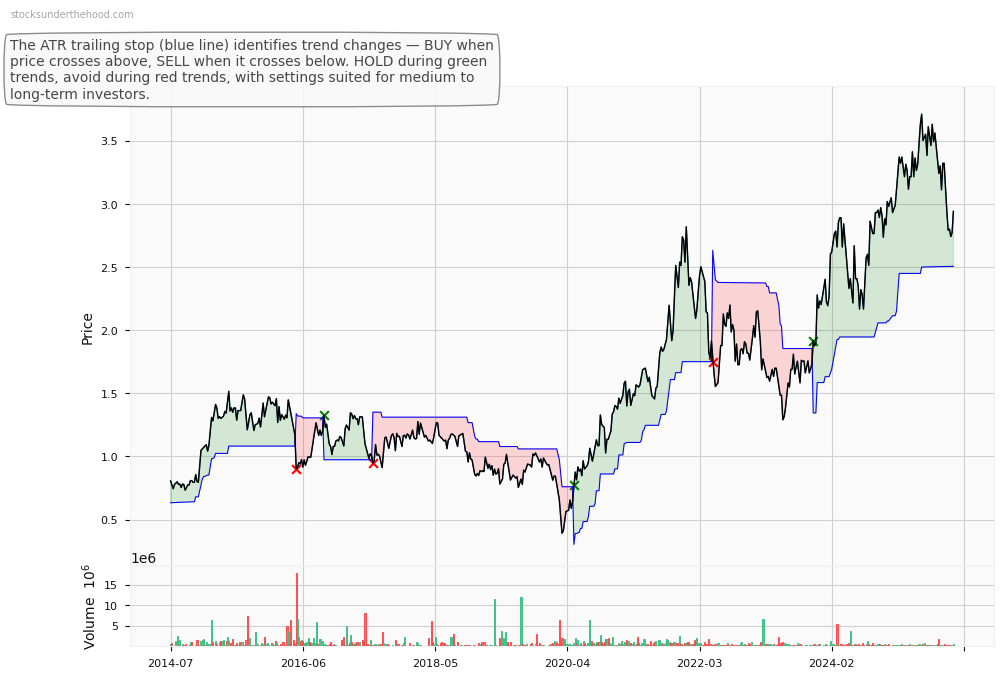
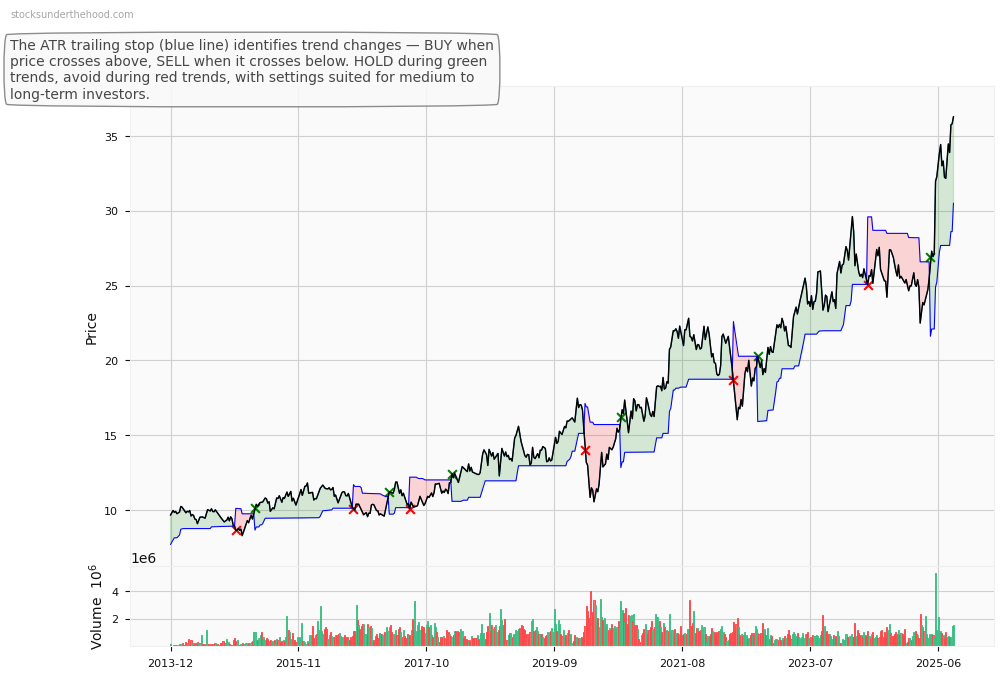
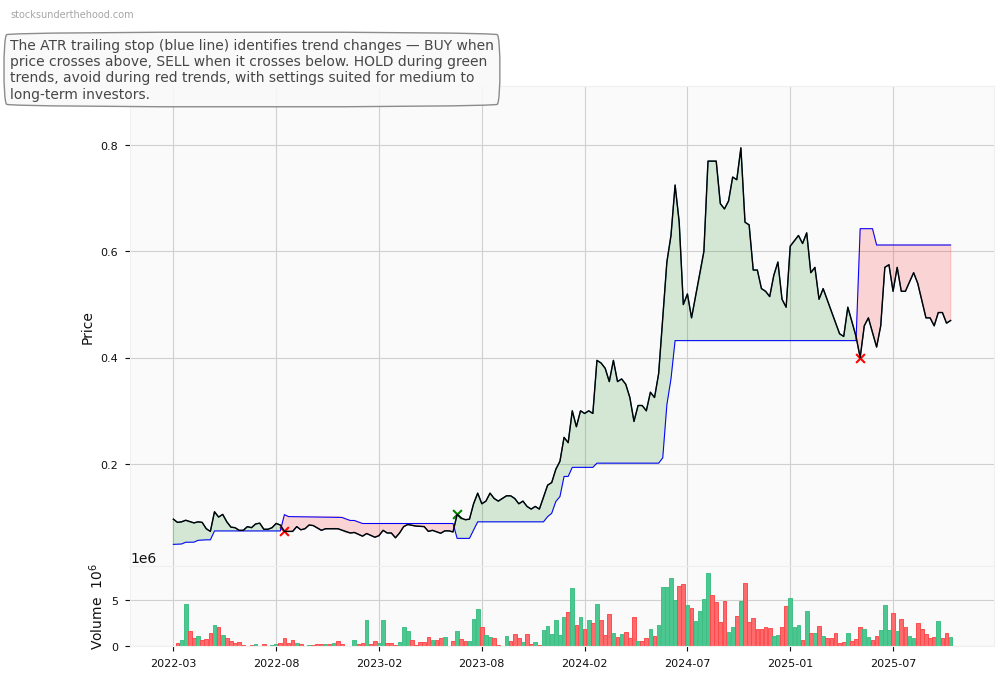
BXB Weekly Price Chart with Average True Range (ATR) Trailing Stop (10-Year View)
Ticker code: BWP
BWP Red Flags & Risk Indicators
✅
⚠️ RED FLAGS: 0 identified
No red flags detected.
Income Statement
| Revenue 2024 Per Share |
Revenue 2025e Per Share |
Revenue 2026e Per Share |
Revenue 24 to 25e [%] |
Revenue 25e to 26e [%] |
EBITDA 2024 Per Share |
EBITDA 2025e Per Share |
EBITDA 2026e Per Share |
EBITDA 24 to 25e [%] |
EBITDA 25e to 26e [%] |
| None |
None |
None |
None |
None |
None |
None |
None |
None |
None |
BWP Revenue Per Share (2012–2027)
BWP Earnings before Interest, Tax, Depreciation and Amortisation (EBITDA) Per Share (2012–2027)
BWP Normalised Earnings Per Share (EPS) (2012–2027)
Valuation
| Price To Sales |
Price To Book |
PER 2023 |
PER 2024 |
13Y Median PER Low |
PER 2025e |
13Y Median PER High |
PER 2026e |
Last Updated |
| 13.7 |
1.0 |
None |
None |
None |
None |
None |
None |
None |
BWP Yearly Price Earnings Ratio (PER) Highs and Lows
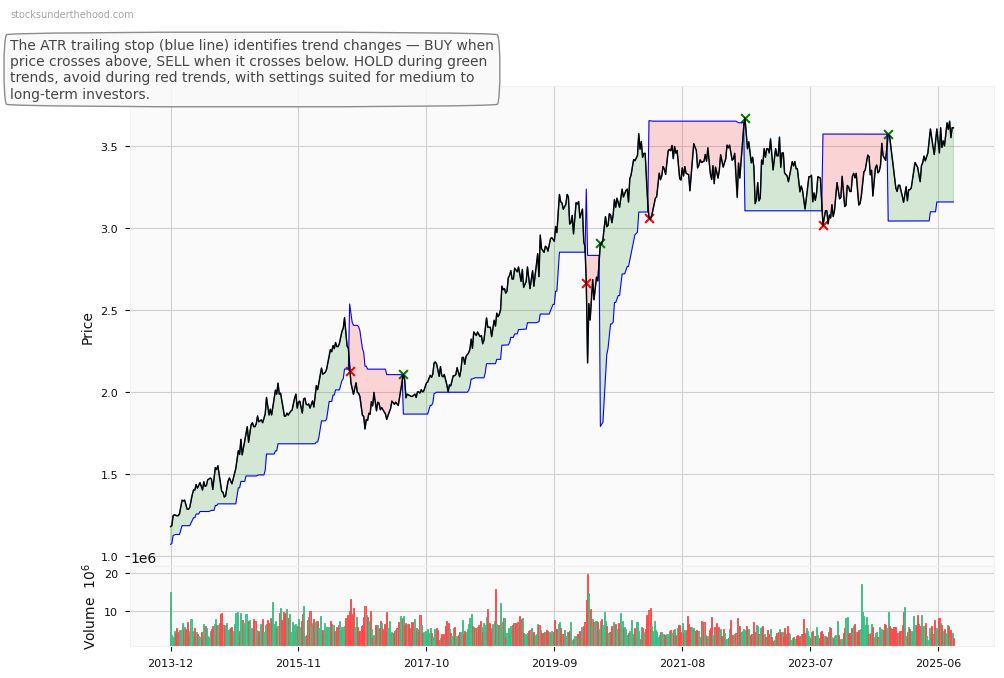
BWP Weekly Price Chart with Average True Range (ATR) Trailing Stop (10-Year View)
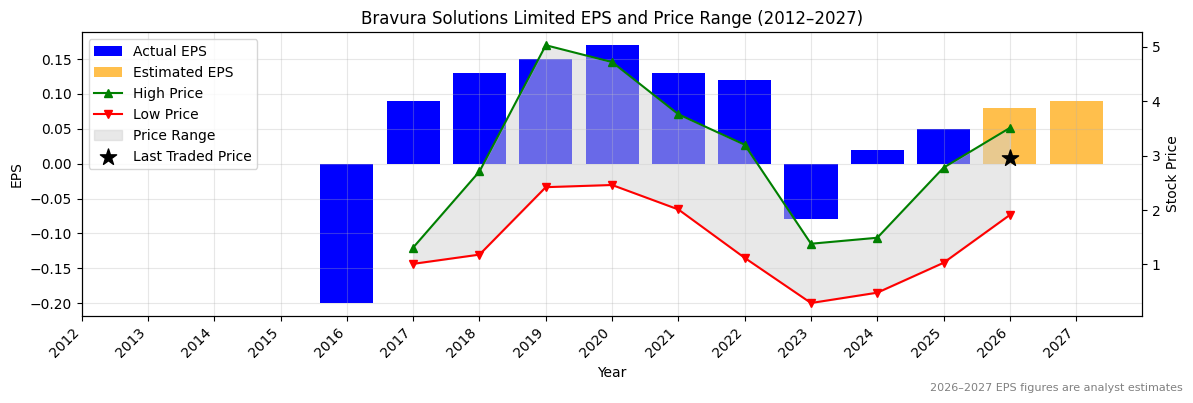
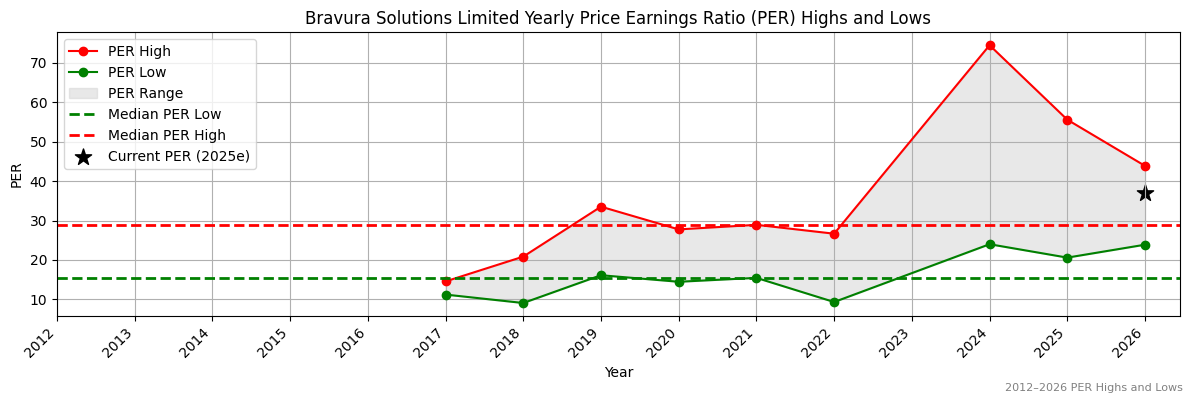
Ticker code: BVS
BVS Red Flags & Risk Indicators
⚠️
⚠️ RED FLAGS: 2 identified
- Increasing Shorts
- High Relative Valuation
Income Statement
| Revenue 2024 Per Share |
Revenue 2025e Per Share |
Revenue 2026e Per Share |
Revenue 24 to 25e [%] |
Revenue 25e to 26e [%] |
EBITDA 2024 Per Share |
EBITDA 2025e Per Share |
EBITDA 2026e Per Share |
EBITDA 24 to 25e [%] |
EBITDA 25e to 26e [%] |
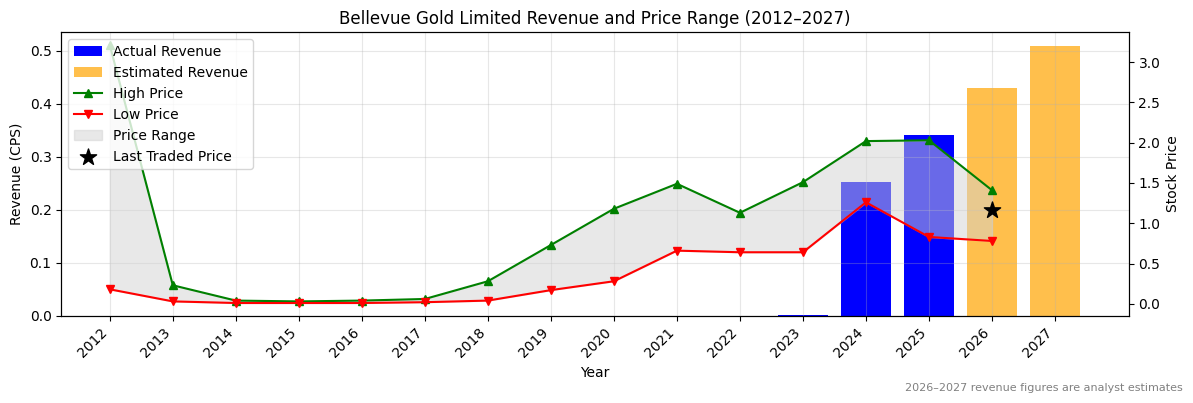
| 0.55849 |
0.70241 |
0.60286 |
25.8 |
-14.2 |
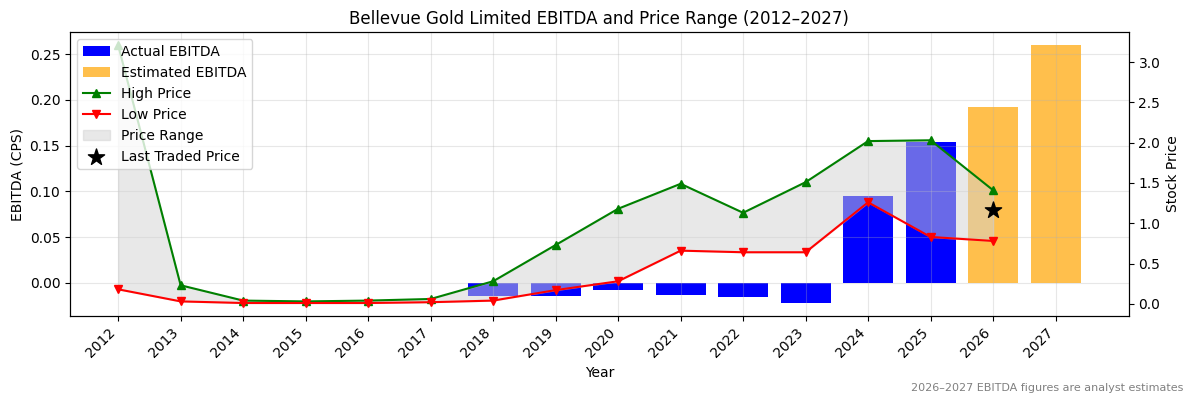
0.05754 |
0.23789 |
0.15333 |
313.4 |
-35.5 |
BVS Revenue Per Share (2012–2027)
✅✅
BVS Earnings before Interest, Tax, Depreciation and Amortisation (EBITDA) Per Share (2012–2027)
✅✅
BVS Normalised Earnings Per Share (EPS) (2012–2027)
✅✅
Valuation
| Price To Sales |
Price To Book |
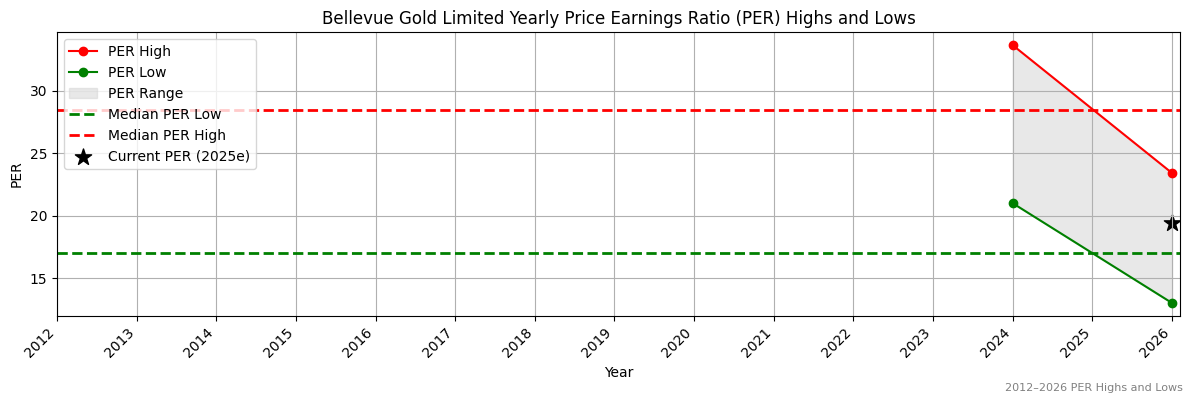
PER 2023 |
PER 2024 |
13Y Median PER Low |
PER 2025e |
13Y Median PER High |
PER 2026e |
Last Updated |
| 4.1 |
13.8 |
-36.0 |
144.0 |
15.5 |
57.6 |
28.9 |
36.0 |
11/10/25 |
BVS Yearly Price Earnings Ratio (PER) Highs and Lows
❌
BVS Weekly Price Chart with Average True Range (ATR) Trailing Stop (10-Year View)
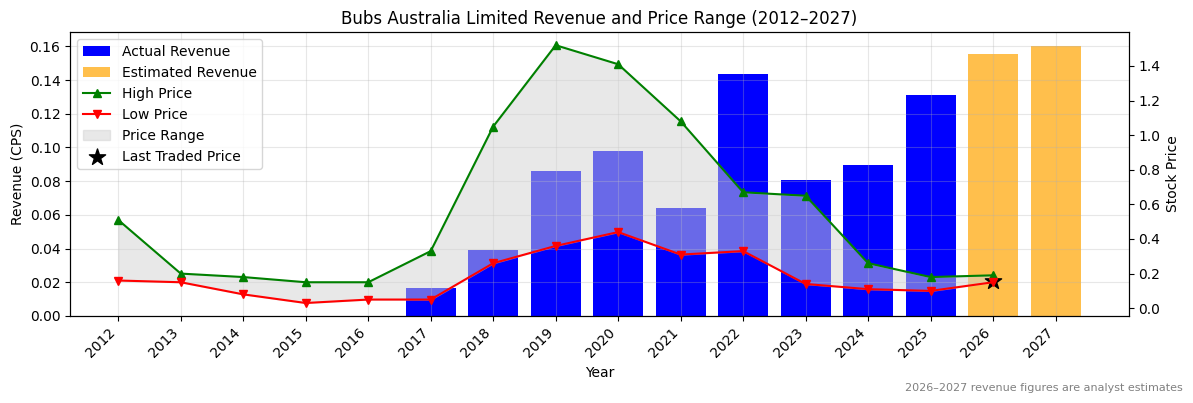
Ticker code: BUB
BUB Red Flags & Risk Indicators
⚠️
⚠️ RED FLAGS: 1 identified
Income Statement
| Revenue 2024 Per Share |
Revenue 2025e Per Share |
Revenue 2026e Per Share |
Revenue 24 to 25e [%] |
Revenue 25e to 26e [%] |
EBITDA 2024 Per Share |
EBITDA 2025e Per Share |
EBITDA 2026e Per Share |
EBITDA 24 to 25e [%] |
EBITDA 25e to 26e [%] |
| 0.08934 |
0.13118 |
0.15577 |
46.8 |
18.7 |
-0.02208 |
0.00645 |
0.00601 |
129.2 |
-6.8 |
BUB Revenue Per Share (2012–2027)
✅✅
BUB Earnings before Interest, Tax, Depreciation and Amortisation (EBITDA) Per Share (2012–2027)
✅✅
BUB Normalised Earnings Per Share (EPS) (2012–2027)
✅✅
Valuation
| Price To Sales |
Price To Book |
PER 2023 |
PER 2024 |
13Y Median PER Low |
PER 2025e |
13Y Median PER High |
PER 2026e |
Last Updated |
| 1.4 |
3.2 |
-1.6 |
-5.2 |
12.5 |
15.5 |
18.5 |
15.5 |
8/9/25 |
BUB Yearly Price Earnings Ratio (PER) Highs and Lows
✅
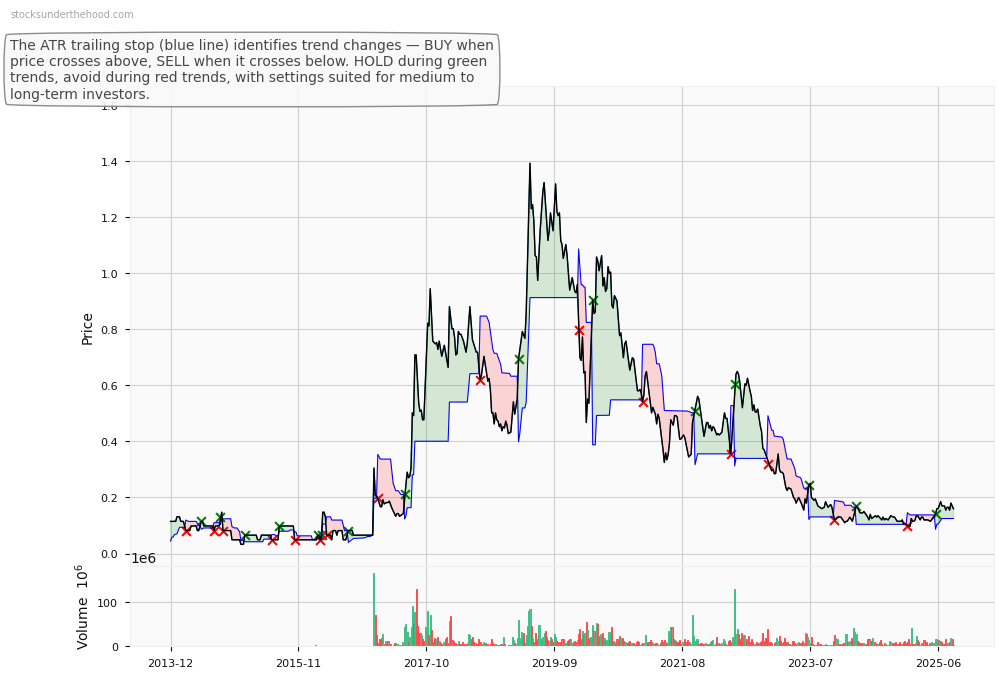
BUB Weekly Price Chart with Average True Range (ATR) Trailing Stop (10-Year View)
Ticker code: BSL
BSL Red Flags & Risk Indicators
❌
⚠️ RED FLAGS: 5 identified
- Highly Shorted
- Increasing Shorts
- Falling Earnings
- Falling Revenues
- Falling EBITDA Margins
Income Statement
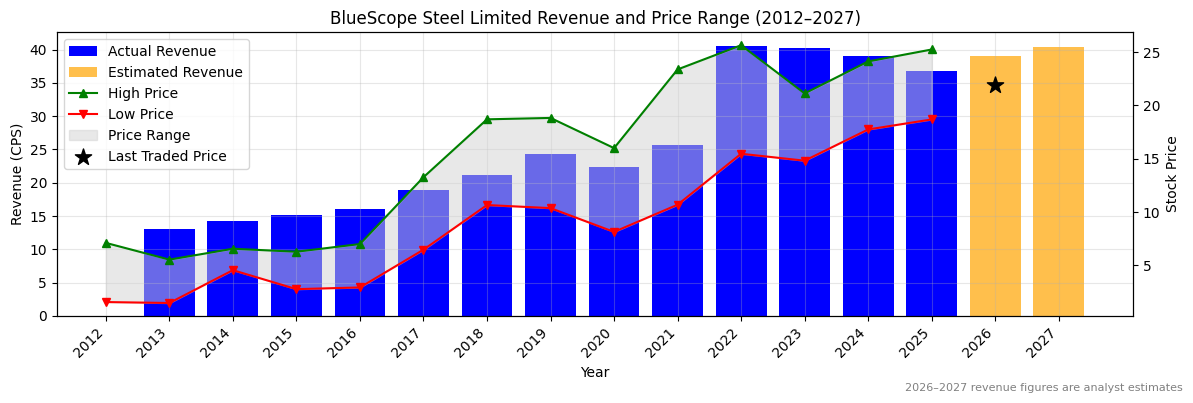
| Revenue 2024 Per Share |
Revenue 2025e Per Share |
Revenue 2026e Per Share |
Revenue 24 to 25e [%] |
Revenue 25e to 26e [%] |
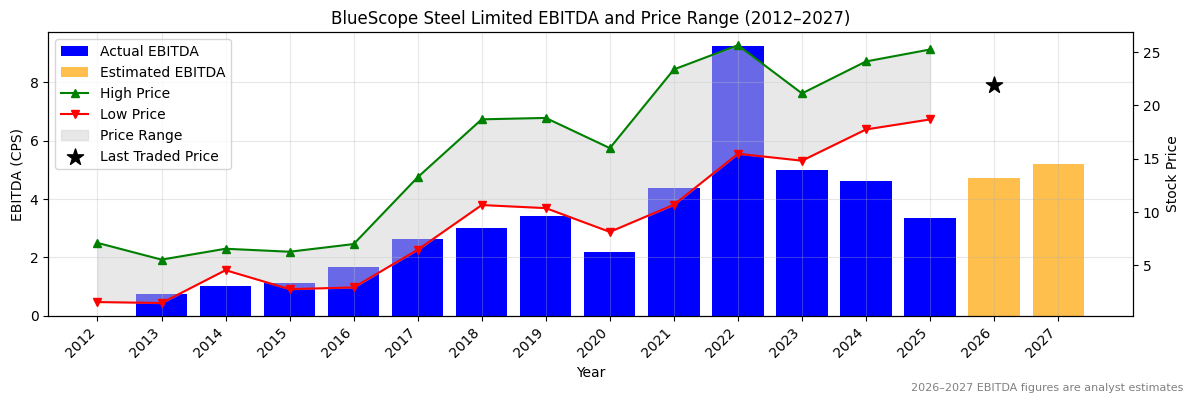
EBITDA 2024 Per Share |
EBITDA 2025e Per Share |
EBITDA 2026e Per Share |
EBITDA 24 to 25e [%] |
EBITDA 25e to 26e [%] |
| 38.97062 |
36.8113 |
39.06226 |
-5.5 |
6.1 |
4.61353 |
3.33842 |
4.70589 |
-27.6 |
41.0 |
BSL Revenue Per Share (2012–2027)
❌
BSL Earnings before Interest, Tax, Depreciation and Amortisation (EBITDA) Per Share (2012–2027)
❌
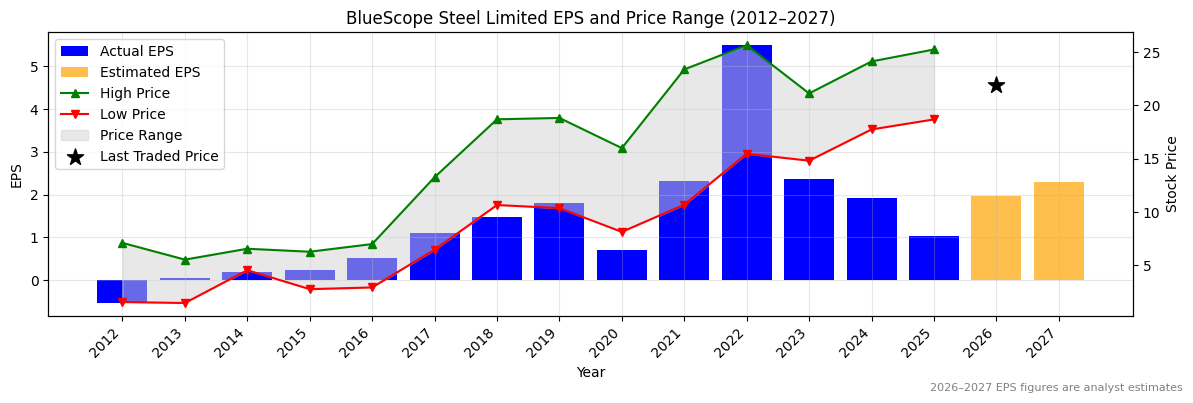
BSL Normalised Earnings Per Share (EPS) (2012–2027)
❌
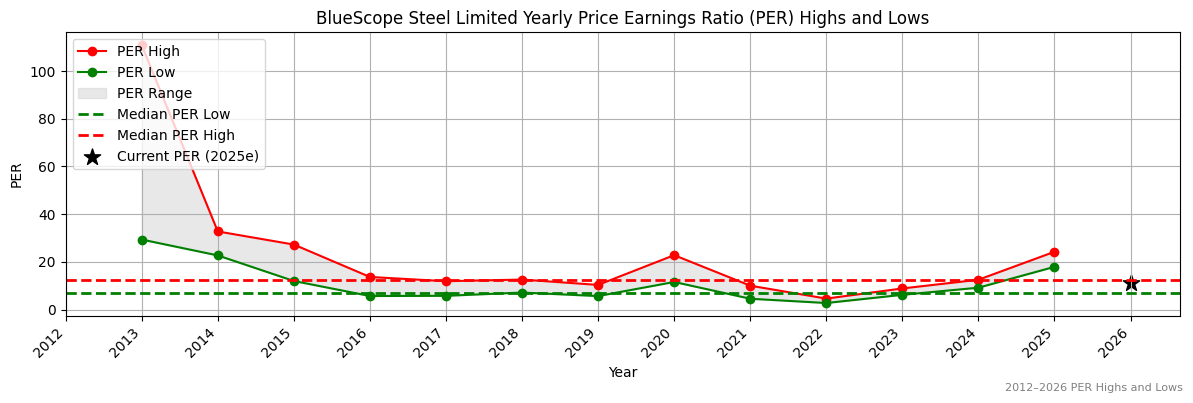
Valuation
| Price To Sales |
Price To Book |
PER 2023 |
PER 2024 |
13Y Median PER Low |
PER 2025e |
13Y Median PER High |
PER 2026e |
Last Updated |
| 0.6 |
0.9 |
9.7 |
11.9 |
7.2 |
22.0 |
12.6 |
11.6 |
20/4/25 |
BSL Yearly Price Earnings Ratio (PER) Highs and Lows
❌
BSL Weekly Price Chart with Average True Range (ATR) Trailing Stop (10-Year View)
Ticker code: BSA
BSA Red Flags & Risk Indicators
⚠️
⚠️ RED FLAGS: 2 identified
- Low Operating Margin
- Falling EBITDA Margins
Income Statement
| Revenue 2024 Per Share |
Revenue 2025e Per Share |
Revenue 2026e Per Share |
Revenue 24 to 25e [%] |
Revenue 25e to 26e [%] |
EBITDA 2024 Per Share |
EBITDA 2025e Per Share |
EBITDA 2026e Per Share |
EBITDA 24 to 25e [%] |
EBITDA 25e to 26e [%] |
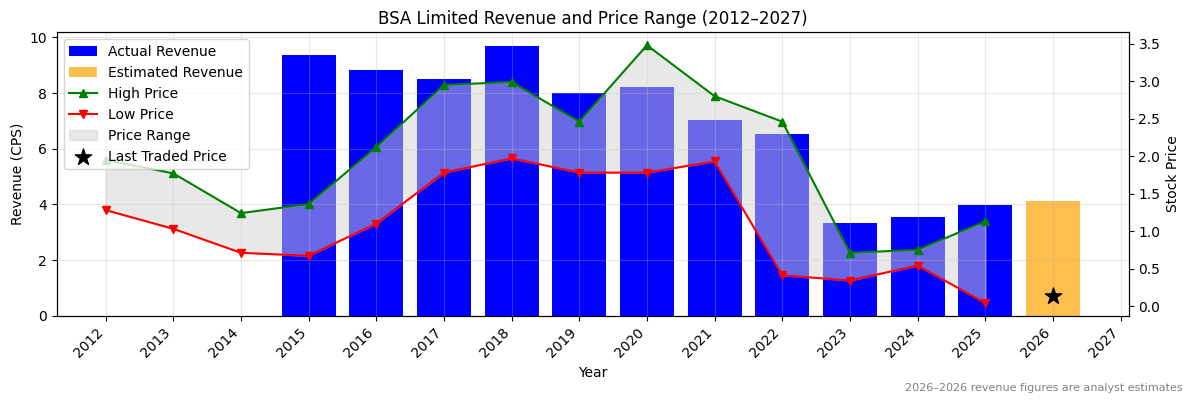
| 3.54351 |
3.98405 |
4.11685 |
12.4 |
3.3 |
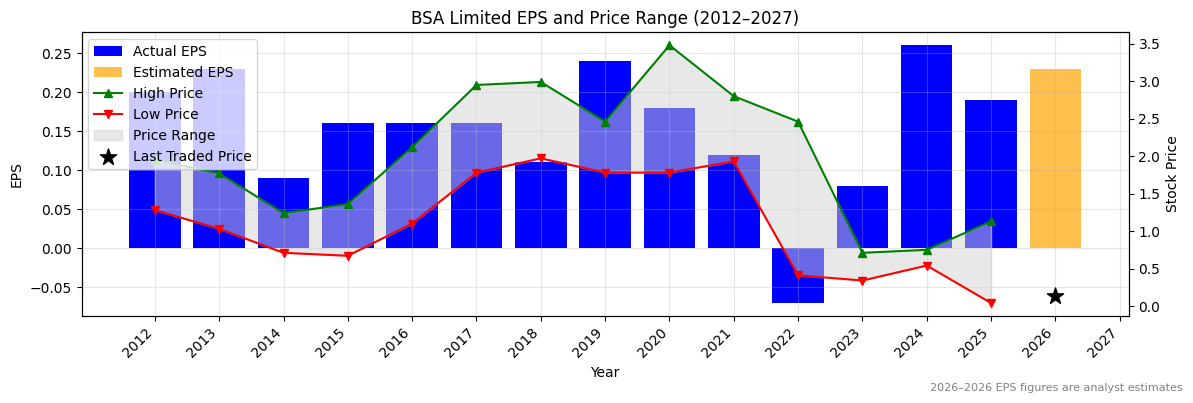
0.30765 |
0.2656 |
0.23904 |
-13.7 |
-10.0 |
BSA Revenue Per Share (2012–2027)
✅
BSA Earnings before Interest, Tax, Depreciation and Amortisation (EBITDA) Per Share (2012–2027)
❌
BSA Normalised Earnings Per Share (EPS) (2012–2027)
❌
Valuation
| Price To Sales |
Price To Book |
PER 2023 |
PER 2024 |
13Y Median PER Low |
PER 2025e |
13Y Median PER High |
PER 2026e |
Last Updated |
| 0.0 |
1.3 |
1.5 |
0.5 |
6.9 |
0.6 |
10.3 |
0.5 |
21/4/25 |
BSA Yearly Price Earnings Ratio (PER) Highs and Lows
✅✅
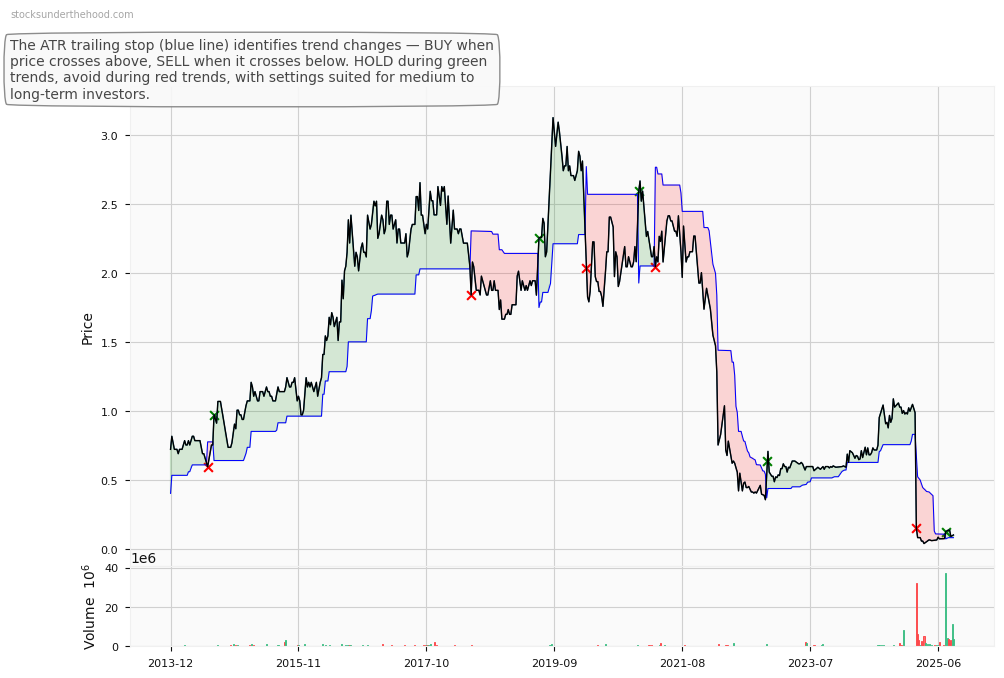
BSA Weekly Price Chart with Average True Range (ATR) Trailing Stop (10-Year View)
Ticker code: BRN
BRN Red Flags & Risk Indicators
❌
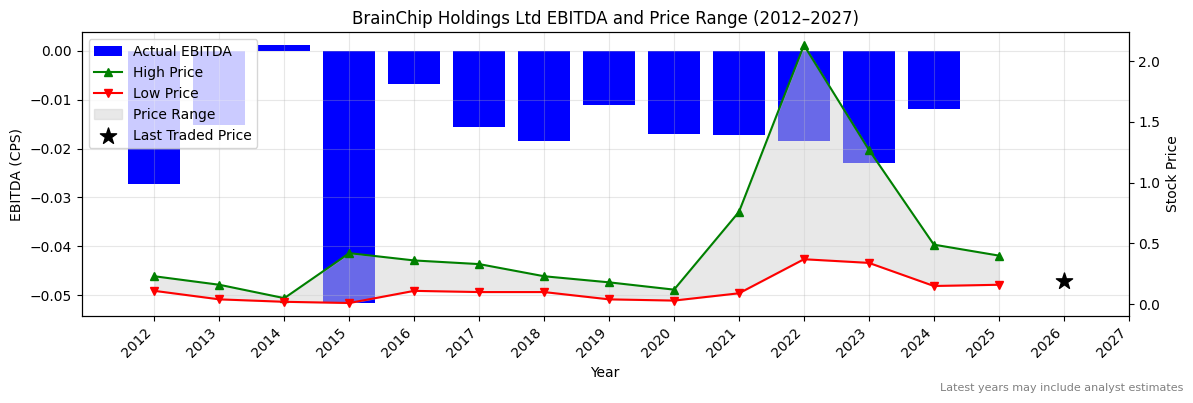
⚠️ RED FLAGS: 5 identified
- Large Share Issuance
- Low Operating Margin
- Highly Shorted
- Increasing Shorts
- High Price to Book vs ROE
Income Statement
| Revenue 2024 Per Share |
Revenue 2025e Per Share |
Revenue 2026e Per Share |
Revenue 24 to 25e [%] |
Revenue 25e to 26e [%] |
EBITDA 2024 Per Share |
EBITDA 2025e Per Share |
EBITDA 2026e Per Share |
EBITDA 24 to 25e [%] |
EBITDA 25e to 26e [%] |
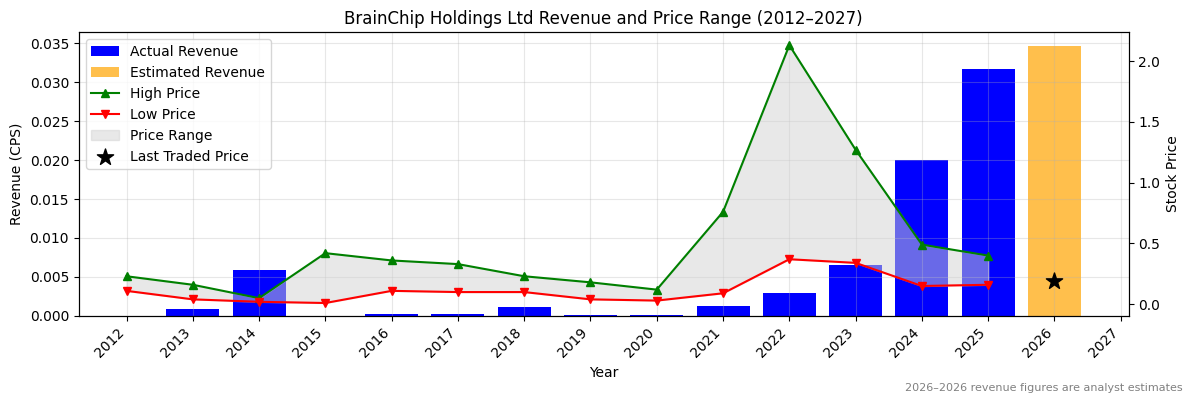
| 0.02002 |
0.03167 |
0.03466 |
58.2 |
9.4 |
-0.0119 |
None |
None |
None |
None |
BRN Revenue Per Share (2012–2027)
✅✅
BRN Earnings before Interest, Tax, Depreciation and Amortisation (EBITDA) Per Share (2012–2027)
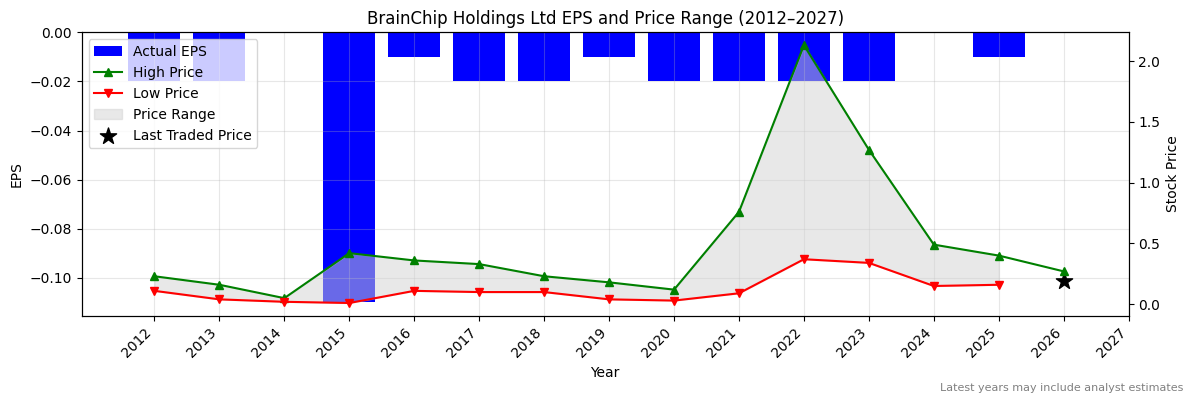
BRN Normalised Earnings Per Share (EPS) (2012–2027)
Valuation
| Price To Sales |
Price To Book |
PER 2023 |
PER 2024 |
13Y Median PER Low |
PER 2025e |
13Y Median PER High |
PER 2026e |
Last Updated |
| 326.1 |
25.0 |
-10.0 |
None |
None |
-20.0 |
None |
None |
30/12/24 |
BRN Yearly Price Earnings Ratio (PER) Highs and Lows
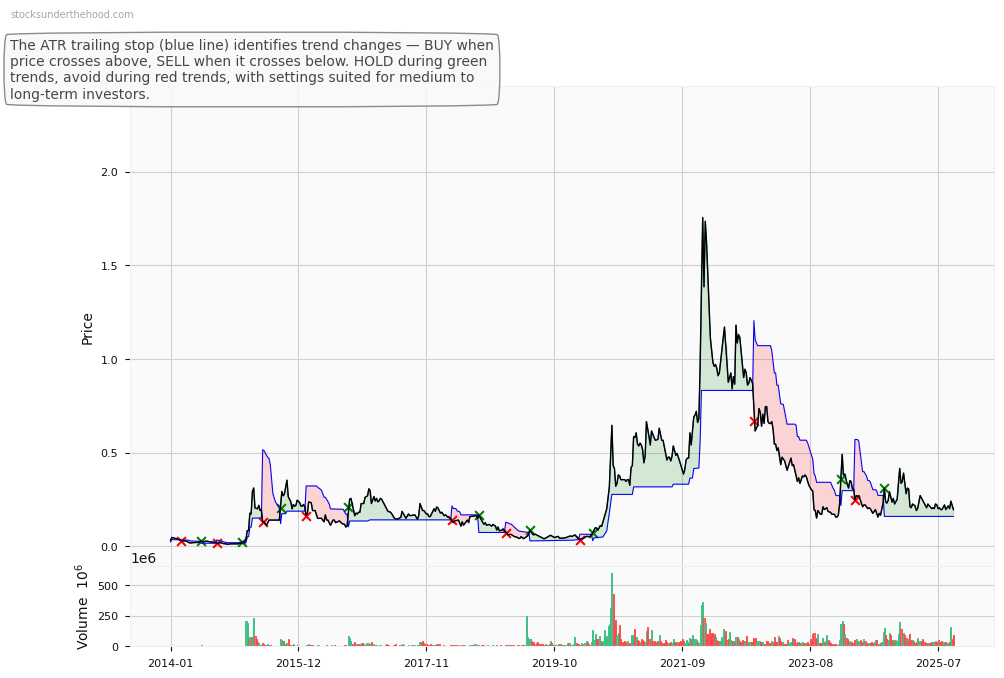
BRN Weekly Price Chart with Average True Range (ATR) Trailing Stop (10-Year View)
Ticker code: BRL
BRL Red Flags & Risk Indicators
❌
⚠️ RED FLAGS: 3 identified
- Falling Earnings
- High Relative Valuation
- Falling EBITDA Margins
Income Statement
| Revenue 2024 Per Share |
Revenue 2025e Per Share |
Revenue 2026e Per Share |
Revenue 24 to 25e [%] |
Revenue 25e to 26e [%] |
EBITDA 2024 Per Share |
EBITDA 2025e Per Share |
EBITDA 2026e Per Share |
EBITDA 24 to 25e [%] |
EBITDA 25e to 26e [%] |
| 0.24572 |
0.22236 |
0.22919 |
-9.5 |
3.1 |
0.48182 |
0.39033 |
None |
-19.0 |
None |
BRL Revenue Per Share (2012–2027)
❌
BRL Earnings before Interest, Tax, Depreciation and Amortisation (EBITDA) Per Share (2012–2027)
❌
BRL Normalised Earnings Per Share (EPS) (2012–2027)
Valuation
| Price To Sales |
Price To Book |
PER 2023 |
PER 2024 |
13Y Median PER Low |
PER 2025e |
13Y Median PER High |
PER 2026e |
Last Updated |
| 3.6 |
0.4 |
1.7 |
3.9 |
3.3 |
None |
7.7 |
None |
14/11/24 |
BRL Yearly Price Earnings Ratio (PER) Highs and Lows
BRL Weekly Price Chart with Average True Range (ATR) Trailing Stop (10-Year View)
Ticker code: BRI
BRI Red Flags & Risk Indicators
⚠️
⚠️ RED FLAGS: 2 identified
- Falling Revenues
- Falling EBITDA Margins
Income Statement
| Revenue 2024 Per Share |
Revenue 2025e Per Share |
Revenue 2026e Per Share |
Revenue 24 to 25e [%] |
Revenue 25e to 26e [%] |
EBITDA 2024 Per Share |
EBITDA 2025e Per Share |
EBITDA 2026e Per Share |
EBITDA 24 to 25e [%] |
EBITDA 25e to 26e [%] |
| 4.85786 |
4.74551 |
4.84499 |
-2.3 |
2.1 |
0.38167 |
0.33609 |
0.35636 |
-11.9 |
6.0 |
BRI Revenue Per Share (2012–2027)
❌
BRI Earnings before Interest, Tax, Depreciation and Amortisation (EBITDA) Per Share (2012–2027)
❌
BRI Normalised Earnings Per Share (EPS) (2012–2027)
❌
Valuation
| Price To Sales |
Price To Book |
PER 2023 |
PER 2024 |
13Y Median PER Low |
PER 2025e |
13Y Median PER High |
PER 2026e |
Last Updated |
| 0.3 |
1.2 |
5.1 |
14.3 |
12.8 |
28.7 |
21.5 |
20.5 |
3/9/25 |
BRI Yearly Price Earnings Ratio (PER) Highs and Lows
❌
BRI Weekly Price Chart with Average True Range (ATR) Trailing Stop (10-Year View)
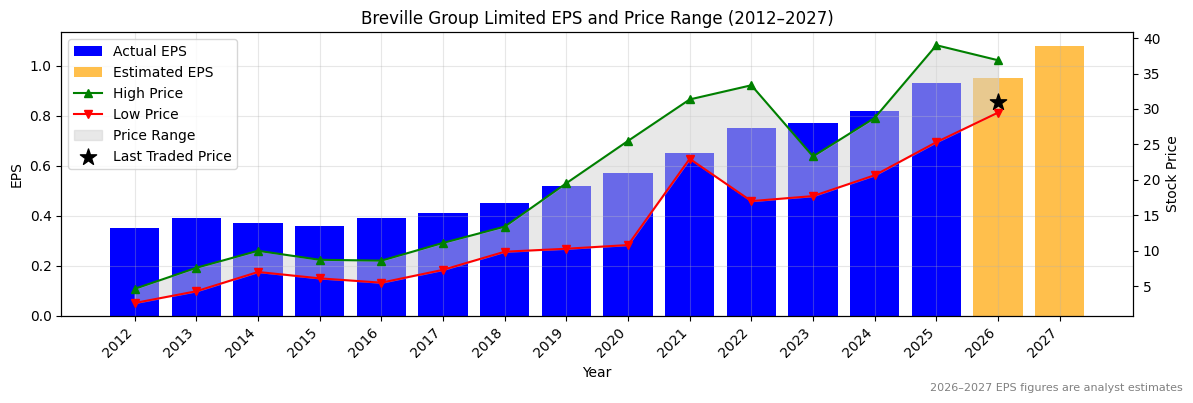
Ticker code: BRG
BRG Red Flags & Risk Indicators
❌
⚠️ RED FLAGS: 3 identified
- Highly Shorted
- Increasing Shorts
- High Relative Valuation
Income Statement
| Revenue 2024 Per Share |
Revenue 2025e Per Share |
Revenue 2026e Per Share |
Revenue 24 to 25e [%] |
Revenue 25e to 26e [%] |
EBITDA 2024 Per Share |
EBITDA 2025e Per Share |
EBITDA 2026e Per Share |
EBITDA 24 to 25e [%] |
EBITDA 25e to 26e [%] |
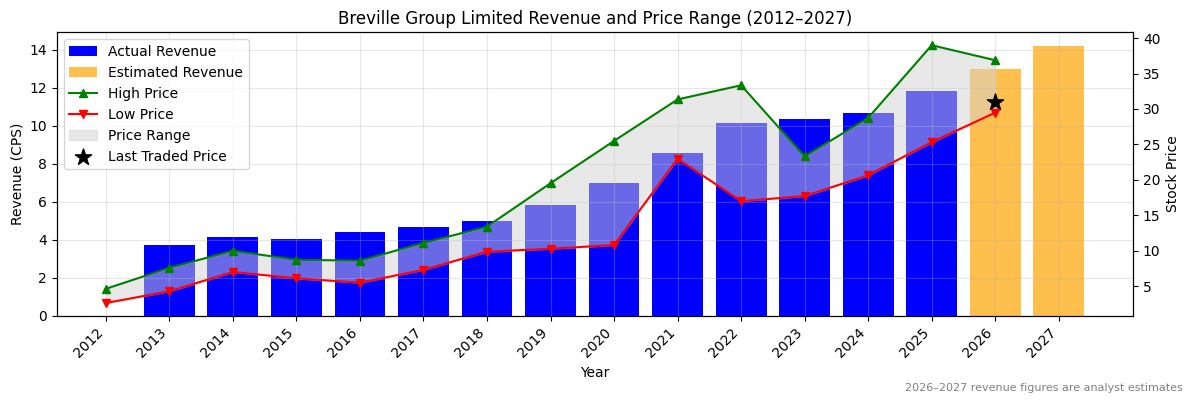
| 10.66946 |
11.83089 |
12.99235 |
10.9 |
9.8 |
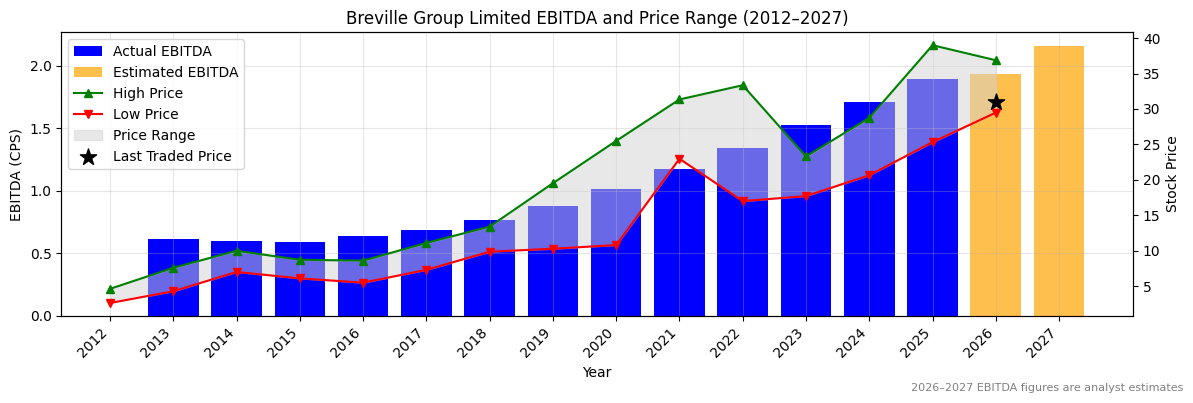
1.71199 |
1.89603 |
1.93545 |
10.7 |
2.1 |
BRG Revenue Per Share (2012–2027)
✅
BRG Earnings before Interest, Tax, Depreciation and Amortisation (EBITDA) Per Share (2012–2027)
✅
BRG Normalised Earnings Per Share (EPS) (2012–2027)
✅
Valuation
| Price To Sales |
Price To Book |
PER 2023 |
PER 2024 |
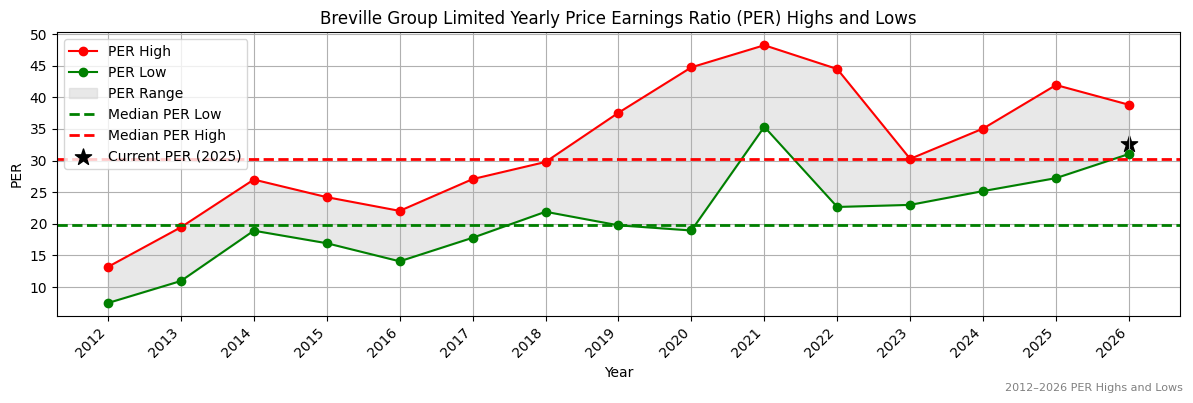
13Y Median PER Low |
PER 2025e |
13Y Median PER High |
PER 2026e |
Last Updated |
| 2.5 |
4.4 |
38.6 |
36.2 |
19.8 |
31.9 |
30.3 |
31.3 |
17/9/25 |
BRG Yearly Price Earnings Ratio (PER) Highs and Lows
❌
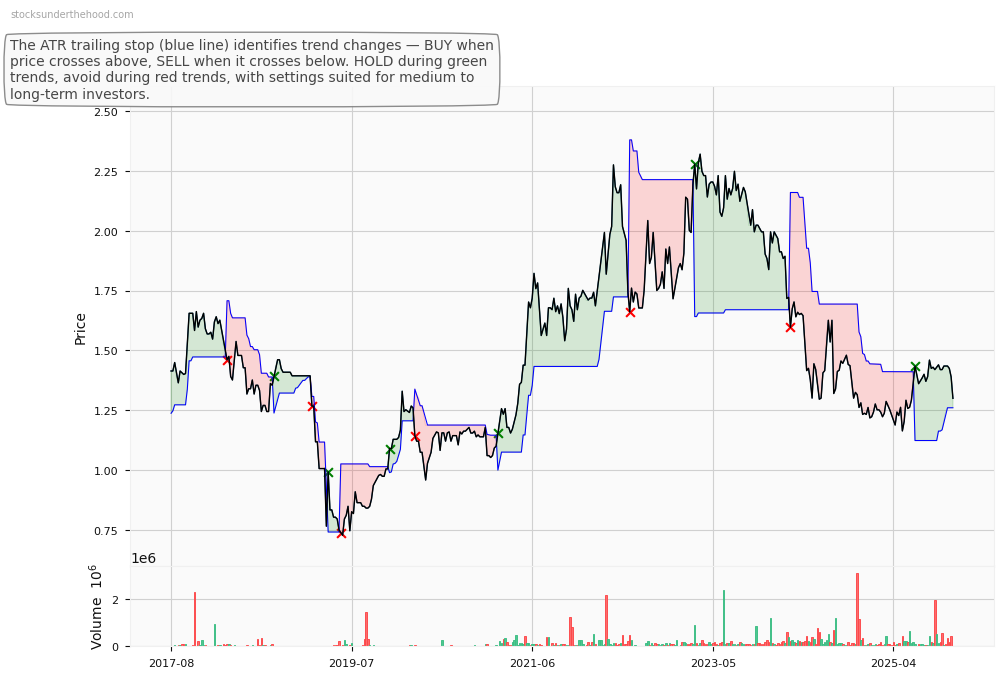
BRG Weekly Price Chart with Average True Range (ATR) Trailing Stop (10-Year View)
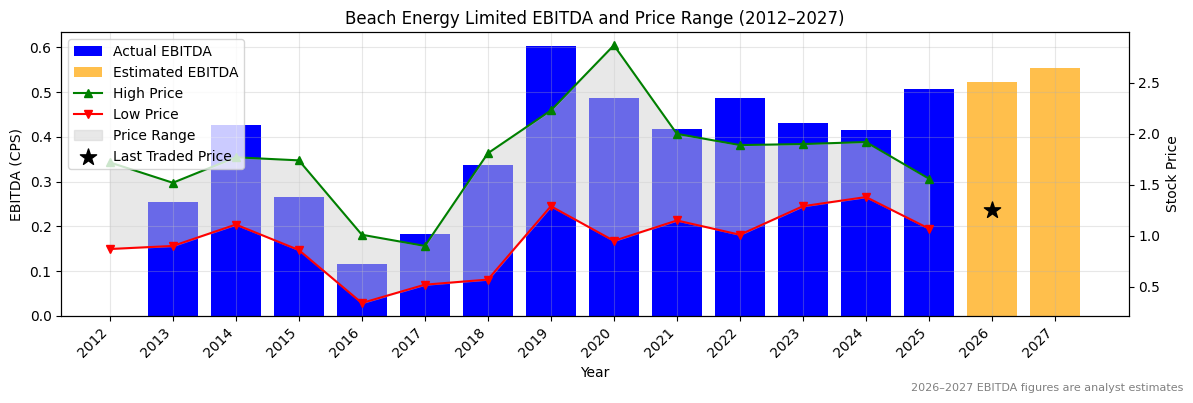
Ticker code: BPT
BPT Red Flags & Risk Indicators
❌
⚠️ RED FLAGS: 3 identified
- Highly Shorted
- Increasing Shorts
- Falling Earnings
Income Statement
| Revenue 2024 Per Share |
Revenue 2025e Per Share |
Revenue 2026e Per Share |
Revenue 24 to 25e [%] |
Revenue 25e to 26e [%] |
EBITDA 2024 Per Share |
EBITDA 2025e Per Share |
EBITDA 2026e Per Share |
EBITDA 24 to 25e [%] |
EBITDA 25e to 26e [%] |
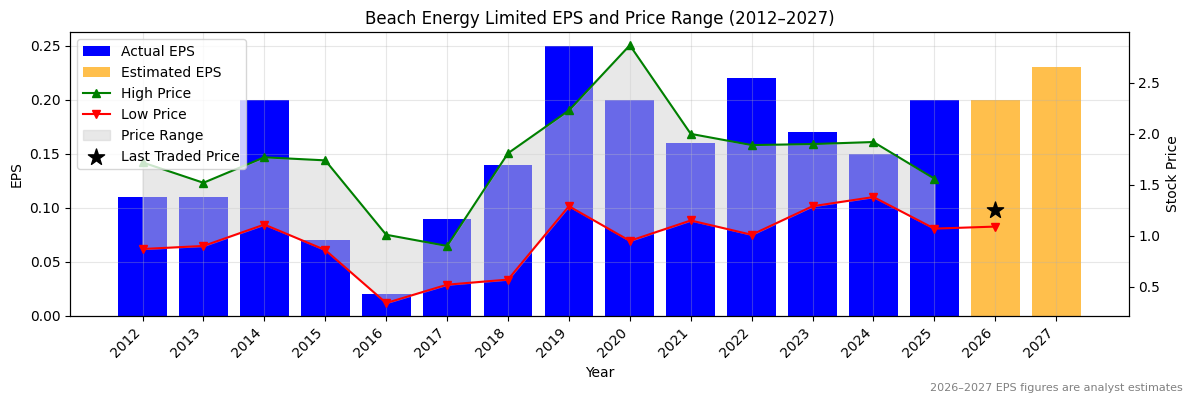
| 0.77412 |
0.86821 |
0.87405 |
12.2 |
0.7 |
0.41643 |
0.50753 |
0.52287 |
21.9 |
3.0 |
BPT Revenue Per Share (2012–2027)
✅
BPT Earnings before Interest, Tax, Depreciation and Amortisation (EBITDA) Per Share (2012–2027)
✅✅
BPT Normalised Earnings Per Share (EPS) (2012–2027)
✅✅
Valuation
| Price To Sales |
Price To Book |
PER 2023 |
PER 2024 |
13Y Median PER Low |
PER 2025e |
13Y Median PER High |
PER 2026e |
Last Updated |
| 1.3 |
0.9 |
7.3 |
8.3 |
5.8 |
6.2 |
12.7 |
6.2 |
23/7/25 |
BPT Yearly Price Earnings Ratio (PER) Highs and Lows
✅
BPT Weekly Price Chart with Average True Range (ATR) Trailing Stop (10-Year View)
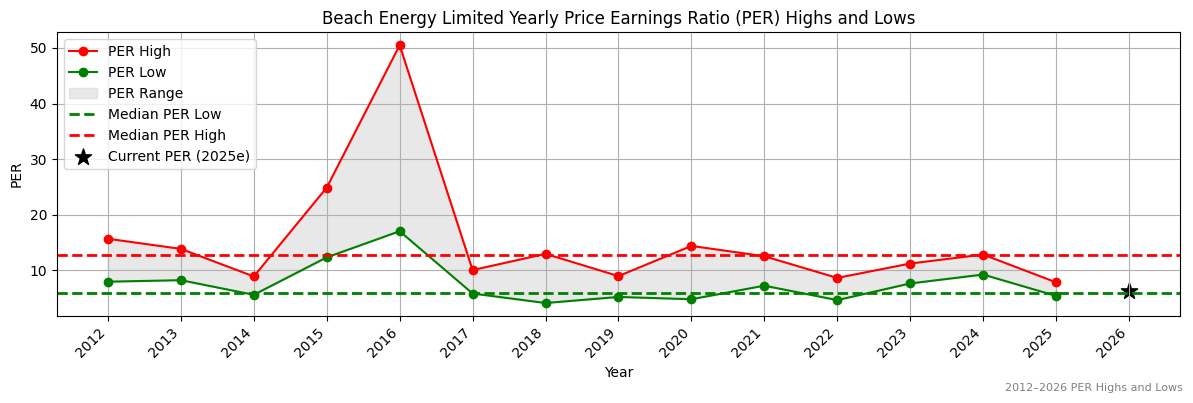
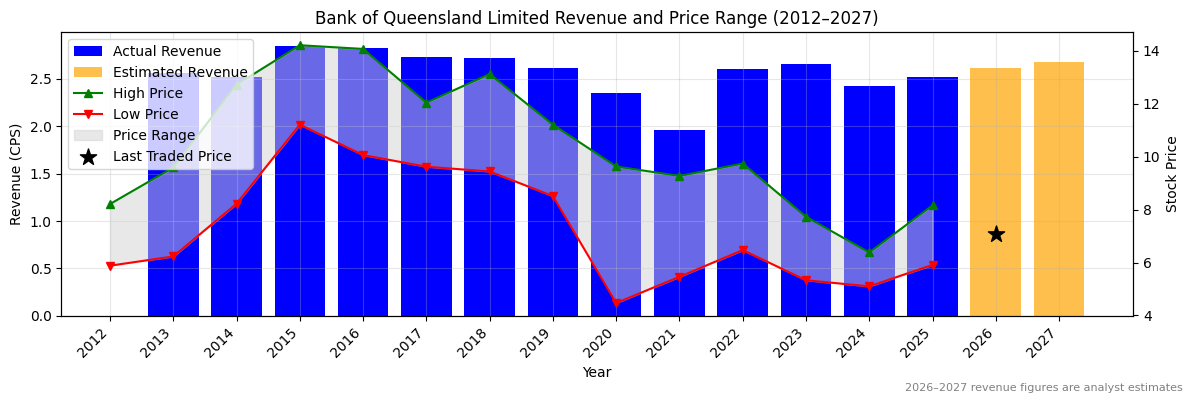
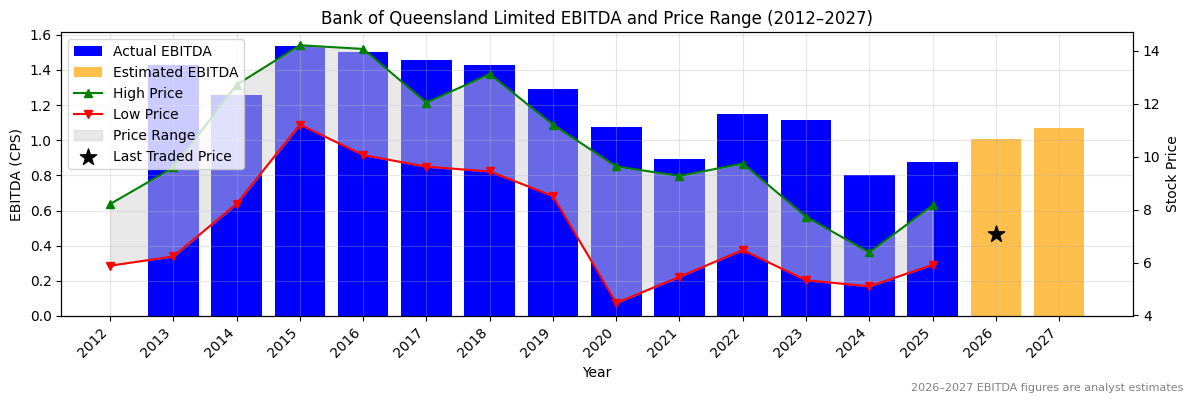
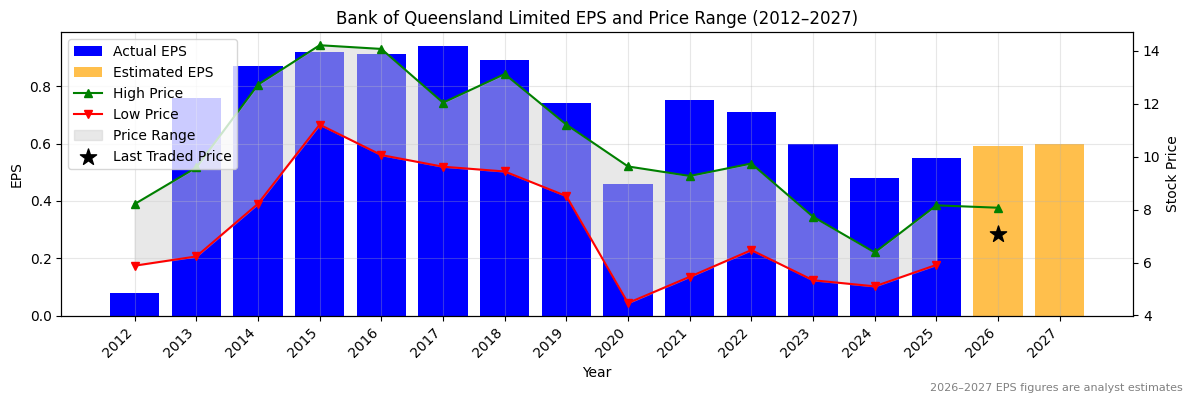
Ticker code: BOQ
BOQ Red Flags & Risk Indicators
⚠️
⚠️ RED FLAGS: 1 identified
Income Statement
| Revenue 2024 Per Share |
Revenue 2025e Per Share |
Revenue 2026e Per Share |
Revenue 24 to 25e [%] |
Revenue 25e to 26e [%] |
EBITDA 2024 Per Share |
EBITDA 2025e Per Share |
EBITDA 2026e Per Share |
EBITDA 24 to 25e [%] |
EBITDA 25e to 26e [%] |
| 2.41875 |
2.51535 |
2.61585 |
4.0 |
4.0 |
0.80272 |
0.87867 |
1.00555 |
9.5 |
14.4 |
BOQ Revenue Per Share (2012–2027)
✅
BOQ Earnings before Interest, Tax, Depreciation and Amortisation (EBITDA) Per Share (2012–2027)
✅
BOQ Normalised Earnings Per Share (EPS) (2012–2027)
✅
Valuation
| Price To Sales |
Price To Book |
PER 2023 |
PER 2024 |
13Y Median PER Low |
PER 2025e |
13Y Median PER High |
PER 2026e |
Last Updated |
| 2.7 |
0.8 |
11.4 |
14.3 |
10.4 |
12.5 |
14.6 |
11.6 |
2/8/25 |
BOQ Yearly Price Earnings Ratio (PER) Highs and Lows
✅
BOQ Weekly Price Chart with Average True Range (ATR) Trailing Stop (10-Year View)
Ticker code: BOE
BOE Red Flags & Risk Indicators
❌
⚠️ RED FLAGS: 4 identified
- Highly Shorted
- Increasing Shorts
- Falling Earnings
- Falling EBITDA Margins
Income Statement
| Revenue 2024 Per Share |
Revenue 2025e Per Share |
Revenue 2026e Per Share |
Revenue 24 to 25e [%] |
Revenue 25e to 26e [%] |
EBITDA 2024 Per Share |
EBITDA 2025e Per Share |
EBITDA 2026e Per Share |
EBITDA 24 to 25e [%] |
EBITDA 25e to 26e [%] |
| 0.11898 |
0.24173 |
0.57165 |
103.2 |
136.5 |
0.1181 |
-0.03707 |
0.29372 |
-131.4 |
892.4 |
BOE Revenue Per Share (2012–2027)
✅✅
BOE Earnings before Interest, Tax, Depreciation and Amortisation (EBITDA) Per Share (2012–2027)
❌
BOE Normalised Earnings Per Share (EPS) (2012–2027)
❌
Valuation
| Price To Sales |
Price To Book |
PER 2023 |
PER 2024 |
13Y Median PER Low |
PER 2025e |
13Y Median PER High |
PER 2026e |
Last Updated |
| 10.9 |
1.7 |
-199.0 |
16.6 |
23.9 |
66.3 |
50.9 |
8.7 |
18/6/25 |
BOE Yearly Price Earnings Ratio (PER) Highs and Lows
❌
BOE Weekly Price Chart with Average True Range (ATR) Trailing Stop (10-Year View)
Ticker code: BMT
BMT Red Flags & Risk Indicators
⚠️
⚠️ RED FLAGS: 2 identified
- Negative Operating Cash Flow
- Falling Revenues
Income Statement
| Revenue 2024 Per Share |
Revenue 2025e Per Share |
Revenue 2026e Per Share |
Revenue 24 to 25e [%] |
Revenue 25e to 26e [%] |
EBITDA 2024 Per Share |
EBITDA 2025e Per Share |
EBITDA 2026e Per Share |
EBITDA 24 to 25e [%] |
EBITDA 25e to 26e [%] |
| 0.09551 |
0.10491 |
0.12285 |
9.8 |
17.1 |
-0.00374 |
-0.00103 |
0.00354 |
72.3 |
442.8 |
BMT Revenue Per Share (2012–2027)
✅
BMT Earnings before Interest, Tax, Depreciation and Amortisation (EBITDA) Per Share (2012–2027)
✅✅
BMT Normalised Earnings Per Share (EPS) (2012–2027)
❌
Valuation
| Price To Sales |
Price To Book |
PER 2023 |
PER 2024 |
13Y Median PER Low |
PER 2025e |
13Y Median PER High |
PER 2026e |
Last Updated |
| 2.2 |
1.5 |
-7.3 |
-11.0 |
None |
-11.0 |
None |
-11.0 |
6/10/25 |
BMT Yearly Price Earnings Ratio (PER) Highs and Lows
BMT Weekly Price Chart with Average True Range (ATR) Trailing Stop (10-Year View)
Ticker code: BLX
BLX Red Flags & Risk Indicators
⚠️
⚠️ RED FLAGS: 1 identified
Income Statement
| Revenue 2024 Per Share |
Revenue 2025e Per Share |
Revenue 2026e Per Share |
Revenue 24 to 25e [%] |
Revenue 25e to 26e [%] |
EBITDA 2024 Per Share |
EBITDA 2025e Per Share |
EBITDA 2026e Per Share |
EBITDA 24 to 25e [%] |
EBITDA 25e to 26e [%] |
| 1.42443 |
1.46653 |
1.57507 |
3.0 |
7.4 |
0.38135 |
0.38651 |
0.42321 |
1.4 |
9.5 |
BLX Revenue Per Share (2012–2027)
✅
BLX Earnings before Interest, Tax, Depreciation and Amortisation (EBITDA) Per Share (2012–2027)
✅
BLX Normalised Earnings Per Share (EPS) (2012–2027)
❌
Valuation
| Price To Sales |
Price To Book |
PER 2023 |
PER 2024 |
13Y Median PER Low |
PER 2025e |
13Y Median PER High |
PER 2026e |
Last Updated |
| 1.9 |
3.5 |
18.6 |
21.5 |
13.3 |
21.5 |
23.1 |
17.4 |
8/7/25 |
BLX Yearly Price Earnings Ratio (PER) Highs and Lows
✅
BLX Weekly Price Chart with Average True Range (ATR) Trailing Stop (10-Year View)
Ticker code: BA
BA Red Flags & Risk Indicators
❌
⚠️ RED FLAGS: 4 identified
- Low Operating Margin
- Negative Equity
- Falling Earnings
- High Relative Valuation
Income Statement
| Revenue 2024 Per Share |
Revenue 2025e Per Share |
Revenue 2026e Per Share |
Revenue 24 to 25e [%] |
Revenue 25e to 26e [%] |
EBITDA 2024 Per Share |
EBITDA 2025e Per Share |
EBITDA 2026e Per Share |
EBITDA 24 to 25e [%] |
EBITDA 25e to 26e [%] |
| 108.35505 |
109.95114 |
128.14497 |
1.5 |
16.5 |
6.58386 |
11.98469 |
None |
82.0 |
None |
BA Revenue Per Share (2012–2027)
✅
BA Earnings before Interest, Tax, Depreciation and Amortisation (EBITDA) Per Share (2012–2027)
✅✅
BA Normalised Earnings Per Share (EPS) (2012–2027)
✅✅
Valuation
| Price To Sales |
Price To Book |
PER 2023 |
PER 2024 |
13Y Median PER Low |
PER 2025e |
13Y Median PER High |
PER 2026e |
Last Updated |
| 2.0 |
-38.3 |
-34.4 |
-174.0 |
12.4 |
37.7 |
20.5 |
22.9 |
11/6/24 |
BA Yearly Price Earnings Ratio (PER) Highs and Lows
❌
BA Weekly Price Chart with Average True Range (ATR) Trailing Stop (10-Year View)
Ticker code: ASX:BKW
ASX:BKW Red Flags & Risk Indicators
❌
⚠️ RED FLAGS: 4 identified
- Increasing Shorts
- Falling Earnings
- High Price to Book vs ROE
- High Relative Valuation
Income Statement
| Revenue 2024 Per Share |
Revenue 2025e Per Share |
Revenue 2026e Per Share |
Revenue 24 to 25e [%] |
Revenue 25e to 26e [%] |
EBITDA 2024 Per Share |
EBITDA 2025e Per Share |
EBITDA 2026e Per Share |
EBITDA 24 to 25e [%] |
EBITDA 25e to 26e [%] |
| 7.14829 |
6.87695 |
7.18811 |
-3.8 |
4.5 |
1.02794 |
2.35913 |
2.9034 |
129.5 |
23.1 |
ASX:BKW Revenue Per Share (2012–2027)
❌
ASX:BKW Earnings before Interest, Tax, Depreciation and Amortisation (EBITDA) Per Share (2012–2027)
✅✅
ASX:BKW Normalised Earnings Per Share (EPS) (2012–2027)
✅✅
Valuation
| Price To Sales |
Price To Book |
PER 2023 |
PER 2024 |
13Y Median PER Low |
PER 2025e |
13Y Median PER High |
PER 2026e |
Last Updated |
| 4.8 |
1.5 |
None |
None |
13.2 |
None |
17.5 |
None |
4/7/25 |
ASX:BKW Yearly Price Earnings Ratio (PER) Highs and Lows
ASX:BKW Weekly Price Chart with Average True Range (ATR) Trailing Stop (10-Year View)
Ticker code: BIO
BIO Red Flags & Risk Indicators
❌
⚠️ RED FLAGS: 6 identified
- Negative Operating Cash Flow
- Low Operating Margin
- Increasing Shorts
- Falling Earnings
- High Price to Book vs ROE
- Risk Of Capital Raise
Income Statement
| Revenue 2024 Per Share |
Revenue 2025e Per Share |
Revenue 2026e Per Share |
Revenue 24 to 25e [%] |
Revenue 25e to 26e [%] |
EBITDA 2024 Per Share |
EBITDA 2025e Per Share |
EBITDA 2026e Per Share |
EBITDA 24 to 25e [%] |
EBITDA 25e to 26e [%] |
| 0.06048 |
0.08403 |
0.12103 |
38.9 |
44.0 |
-0.00484 |
0.00422 |
0.01768 |
187.3 |
318.9 |
BIO Revenue Per Share (2012–2027)
✅✅
BIO Earnings before Interest, Tax, Depreciation and Amortisation (EBITDA) Per Share (2012–2027)
✅✅
BIO Normalised Earnings Per Share (EPS) (2012–2027)
✅✅
Valuation
| Price To Sales |
Price To Book |
PER 2023 |
PER 2024 |
13Y Median PER Low |
PER 2025e |
13Y Median PER High |
PER 2026e |
Last Updated |
| 5.5 |
21.9 |
-23.0 |
-46.0 |
23.0 |
None |
31.5 |
23.0 |
2/10/25 |
BIO Yearly Price Earnings Ratio (PER) Highs and Lows
BIO Weekly Price Chart with Average True Range (ATR) Trailing Stop (10-Year View)
Ticker code: BHP
BHP Red Flags & Risk Indicators
❌
⚠️ RED FLAGS: 4 identified
- Increasing Shorts
- Falling Revenues
- High Relative Valuation
- Falling EBITDA Margins
Income Statement
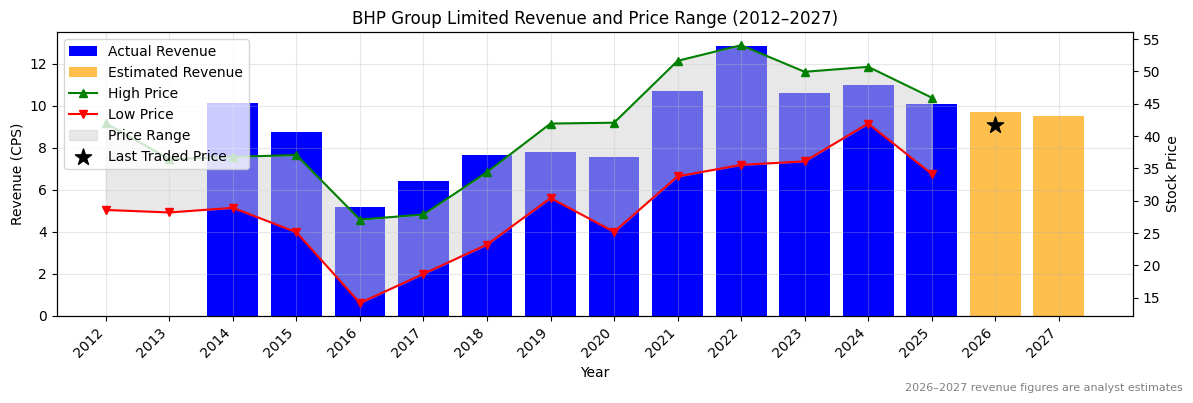
| Revenue 2024 Per Share |
Revenue 2025e Per Share |
Revenue 2026e Per Share |
Revenue 24 to 25e [%] |
Revenue 25e to 26e [%] |
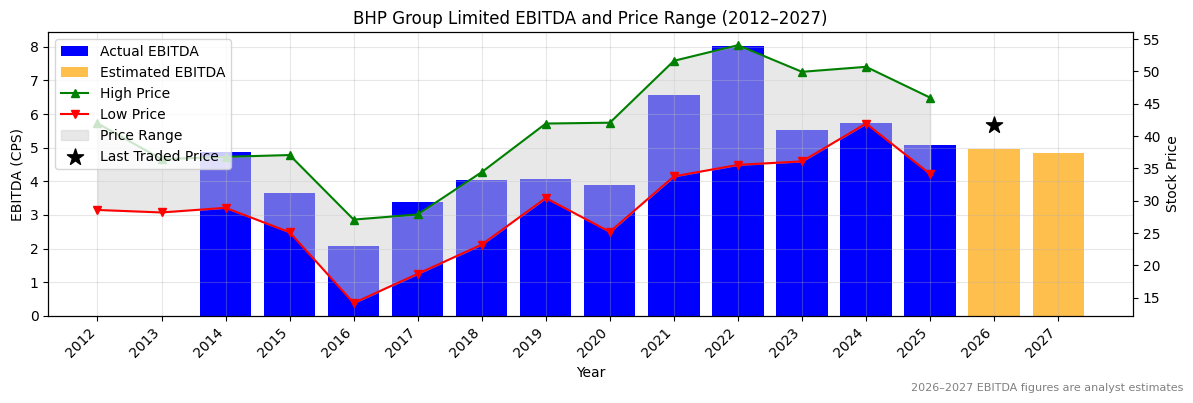
EBITDA 2024 Per Share |
EBITDA 2025e Per Share |
EBITDA 2026e Per Share |
EBITDA 24 to 25e [%] |
EBITDA 25e to 26e [%] |
| 10.97466 |
10.06736 |
9.73124 |
-8.3 |
-3.3 |
5.72138 |
5.08842 |
4.95143 |
-11.1 |
-2.7 |
BHP Revenue Per Share (2012–2027)
❌
BHP Earnings before Interest, Tax, Depreciation and Amortisation (EBITDA) Per Share (2012–2027)
❌
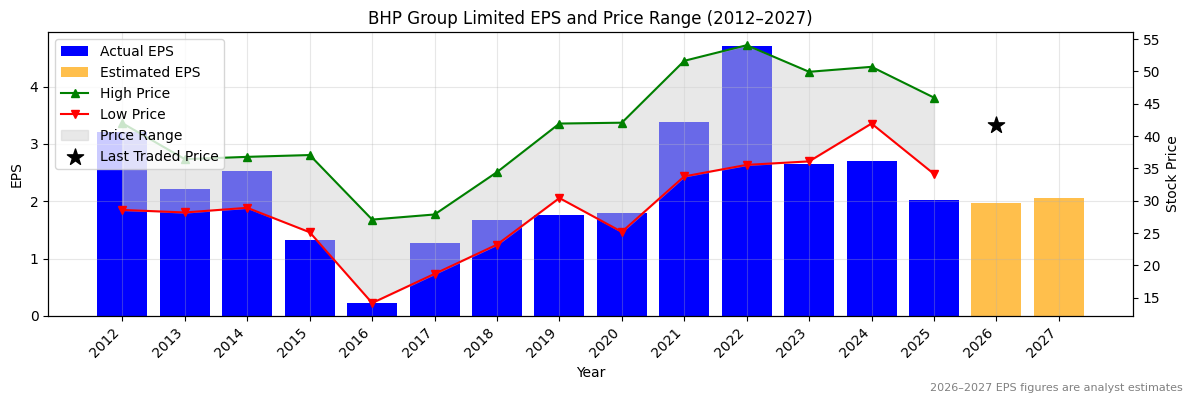
BHP Normalised Earnings Per Share (EPS) (2012–2027)
❌
Valuation
| Price To Sales |
Price To Book |
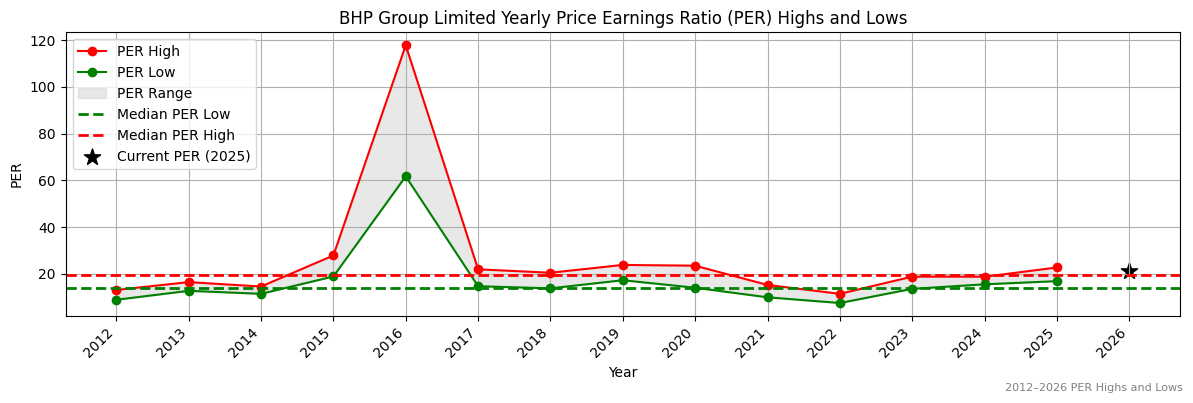
PER 2023 |
PER 2024 |
13Y Median PER Low |
PER 2025e |
13Y Median PER High |
PER 2026e |
Last Updated |
| 4.3 |
4.6 |
16.4 |
16.1 |
14.0 |
21.5 |
19.7 |
22.1 |
24/7/25 |
BHP Yearly Price Earnings Ratio (PER) Highs and Lows
❌
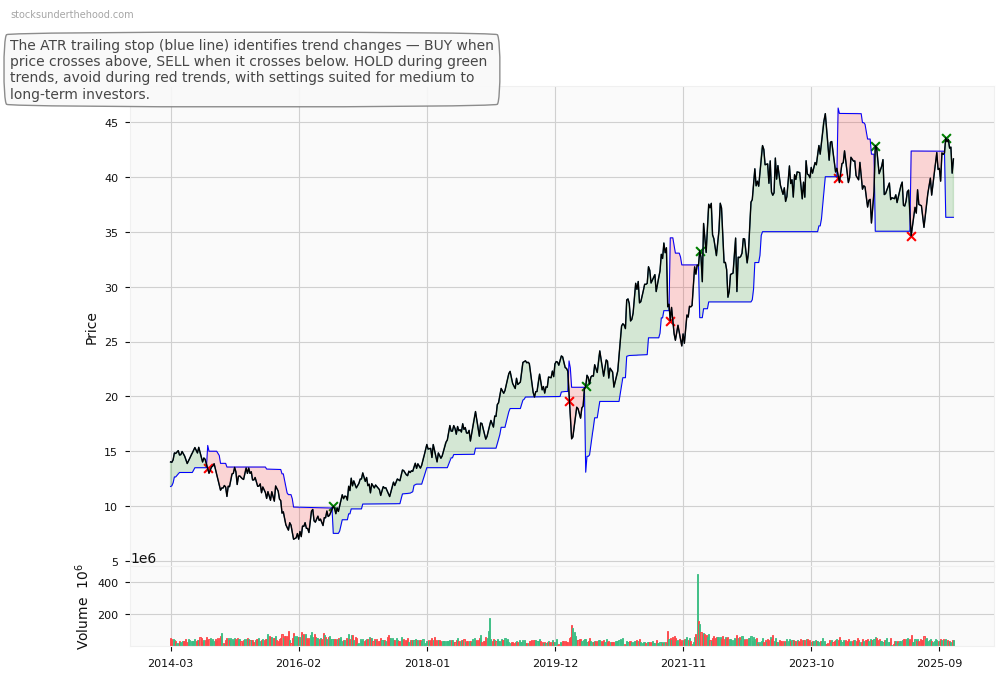
BHP Weekly Price Chart with Average True Range (ATR) Trailing Stop (10-Year View)
Ticker code: BGL
BGL Red Flags & Risk Indicators
❌
⚠️ RED FLAGS: 3 identified
- Large Share Issuance
- Falling Earnings
- Falling Revenues
Income Statement
| Revenue 2024 Per Share |
Revenue 2025e Per Share |
Revenue 2026e Per Share |
Revenue 24 to 25e [%] |
Revenue 25e to 26e [%] |
EBITDA 2024 Per Share |
EBITDA 2025e Per Share |
EBITDA 2026e Per Share |
EBITDA 24 to 25e [%] |
EBITDA 25e to 26e [%] |
| 0.25346 |
0.34161 |
0.42913 |
34.8 |
25.6 |
0.09536 |
0.15344 |
0.1927 |
60.9 |
25.6 |
BGL Revenue Per Share (2012–2027)
✅✅
BGL Earnings before Interest, Tax, Depreciation and Amortisation (EBITDA) Per Share (2012–2027)
✅✅
BGL Normalised Earnings Per Share (EPS) (2012–2027)
❌
Valuation
| Price To Sales |
Price To Book |
PER 2023 |
PER 2024 |
13Y Median PER Low |
PER 2025e |
13Y Median PER High |
PER 2026e |
Last Updated |
| 4.4 |
2.1 |
-58.5 |
19.5 |
17.0 |
-39.0 |
28.5 |
19.5 |
8/9/25 |
BGL Yearly Price Earnings Ratio (PER) Highs and Lows
✅✅
BGL Weekly Price Chart with Average True Range (ATR) Trailing Stop (10-Year View)