Ticker code: BGA
BGA Red Flags & Risk Indicators
❌
⚠️ RED FLAGS: 4 identified
- Negative Operating Cash Flow
- Low Operating Margin
- Increasing Shorts
- Falling Earnings
Income Statement
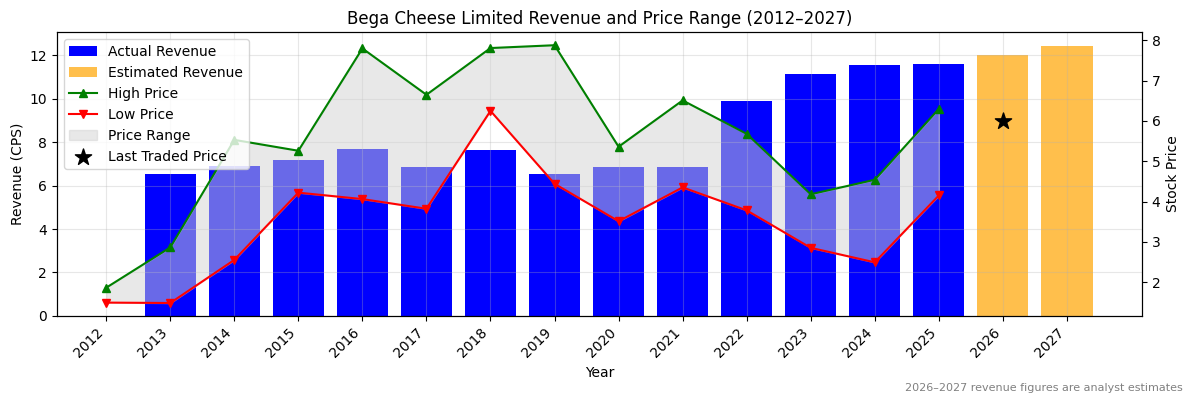
| Revenue 2024 Per Share |
Revenue 2025e Per Share |
Revenue 2026e Per Share |
Revenue 24 to 25e [%] |
Revenue 25e to 26e [%] |
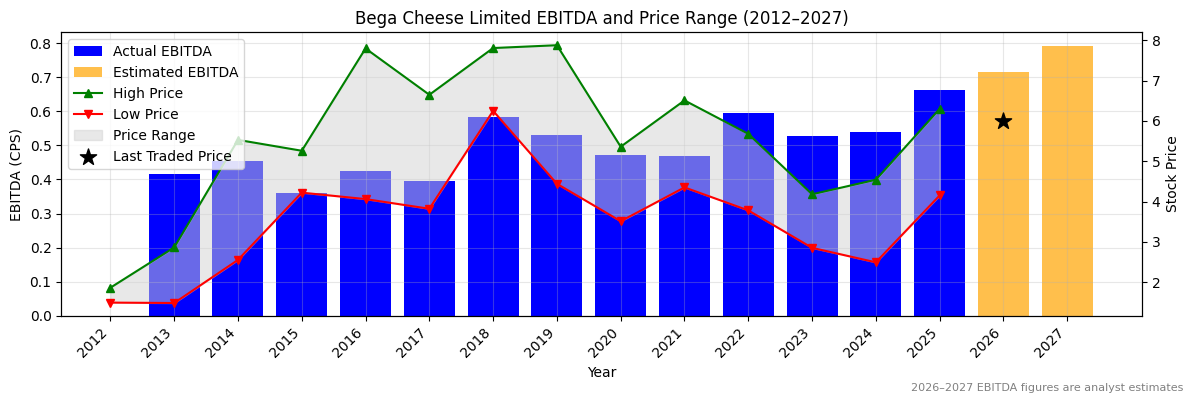
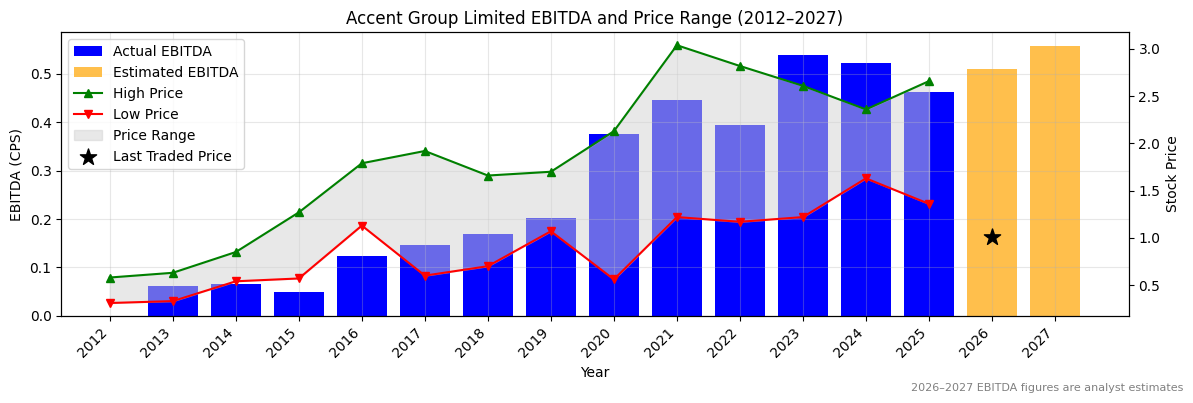
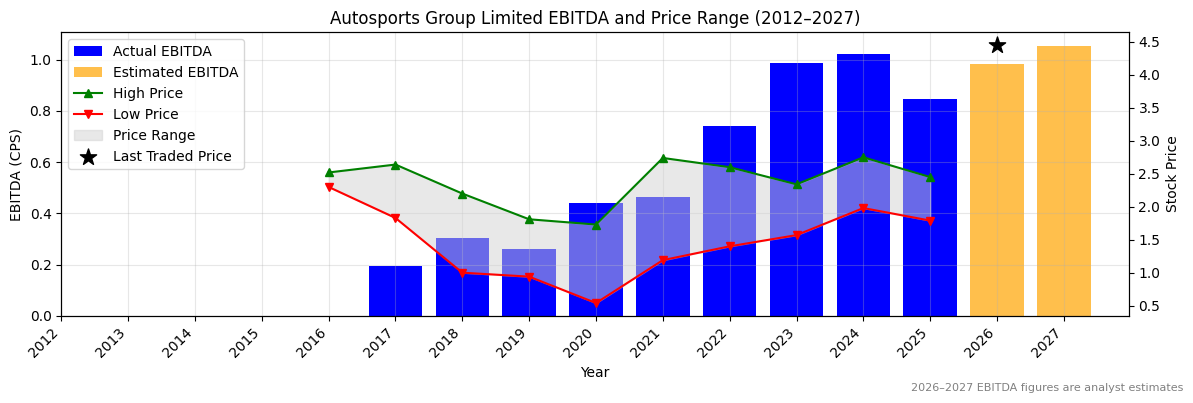
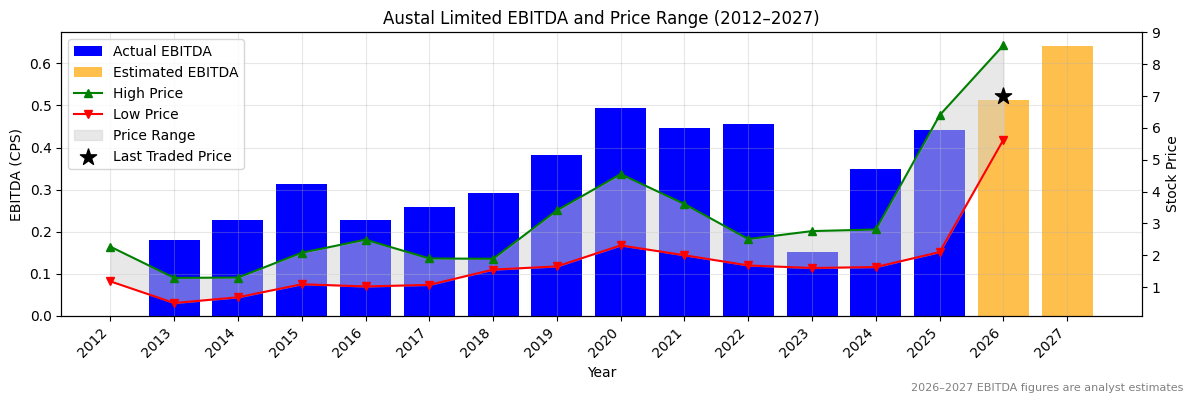
EBITDA 2024 Per Share |
EBITDA 2025e Per Share |
EBITDA 2026e Per Share |
EBITDA 24 to 25e [%] |
EBITDA 25e to 26e [%] |
| 11.55473 |
11.61183 |
12.03547 |
0.5 |
3.6 |
0.53843 |
0.66278 |
0.7143 |
23.1 |
7.8 |
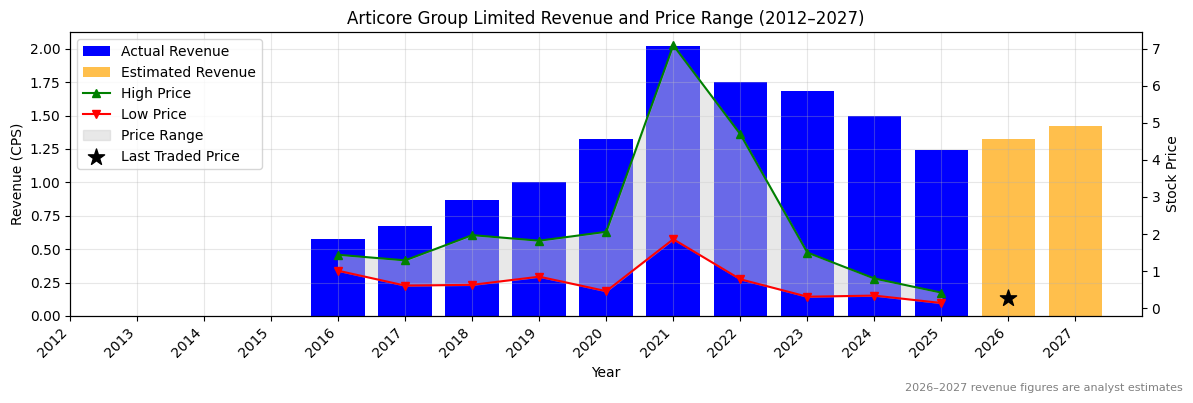
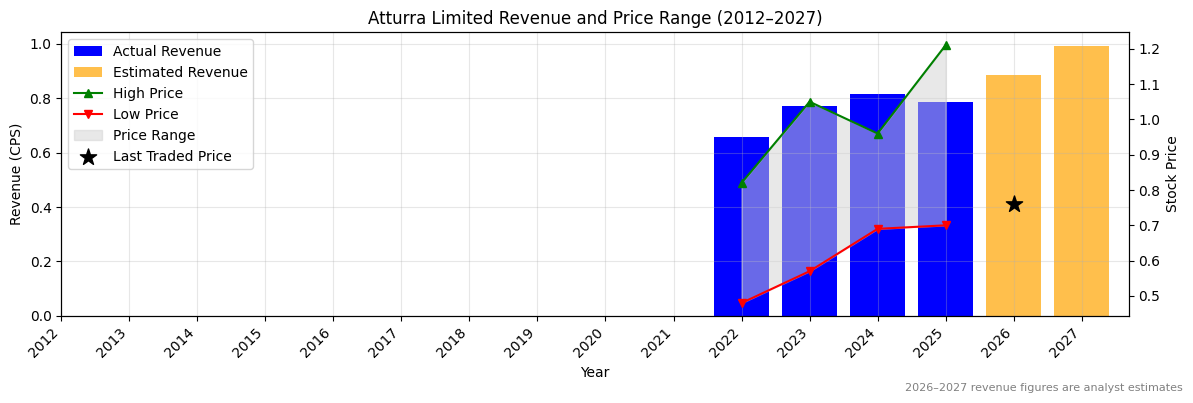
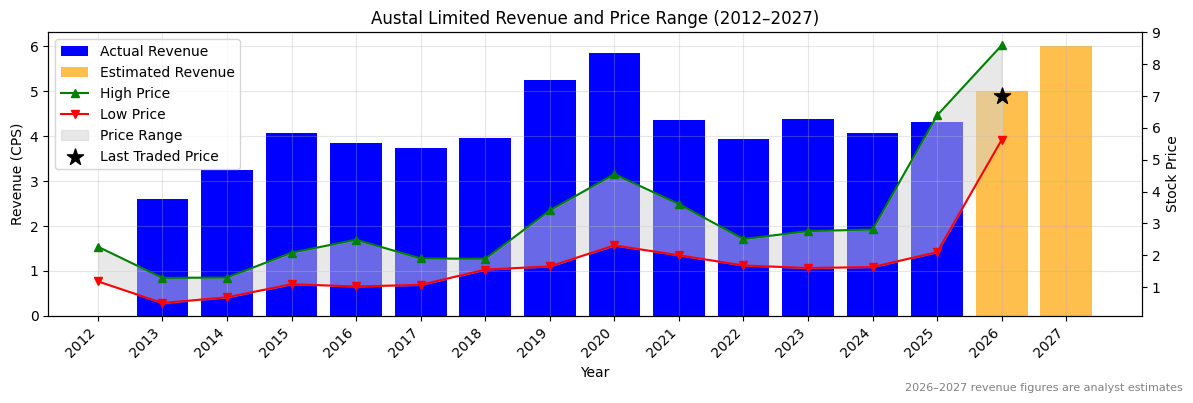
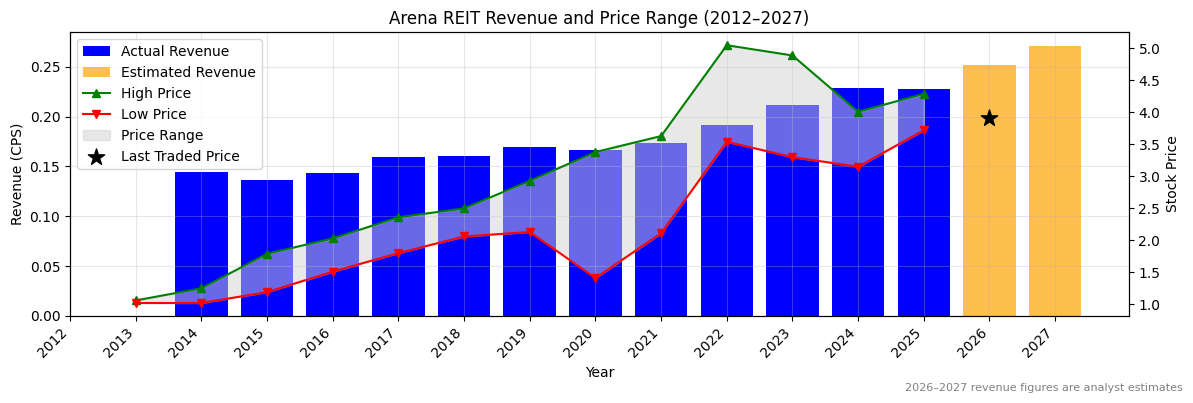
BGA Revenue Per Share (2012–2027)
✅
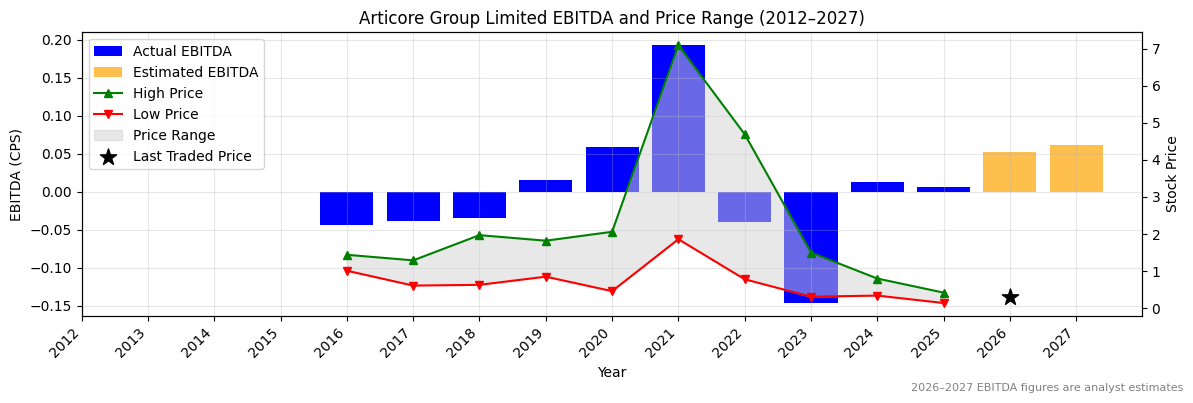
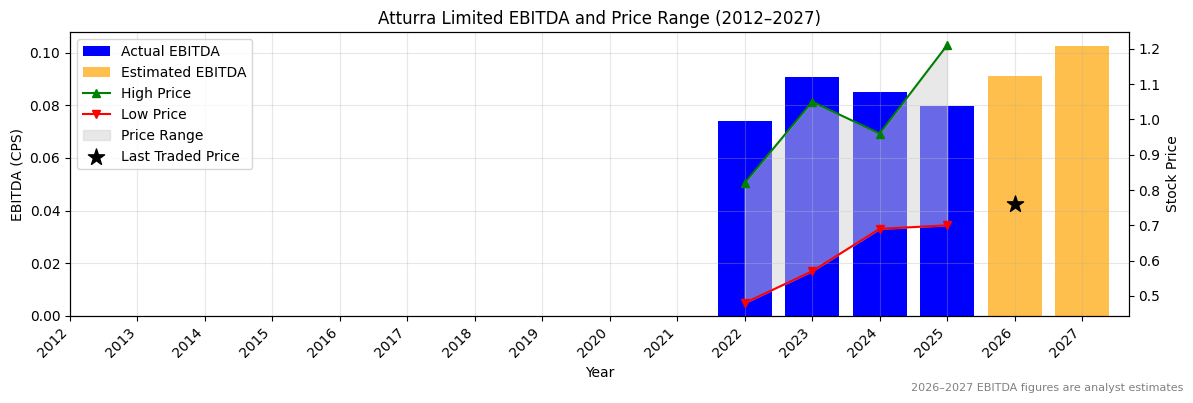
BGA Earnings before Interest, Tax, Depreciation and Amortisation (EBITDA) Per Share (2012–2027)
✅✅
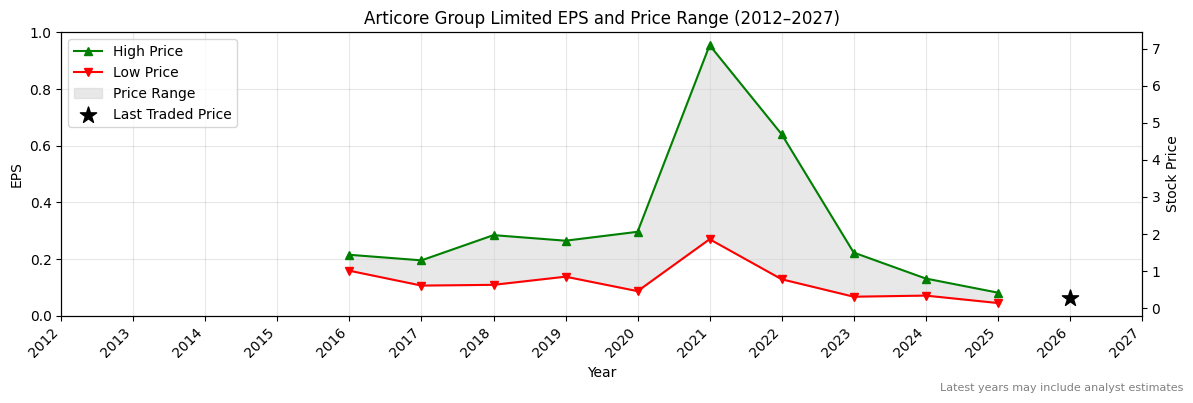
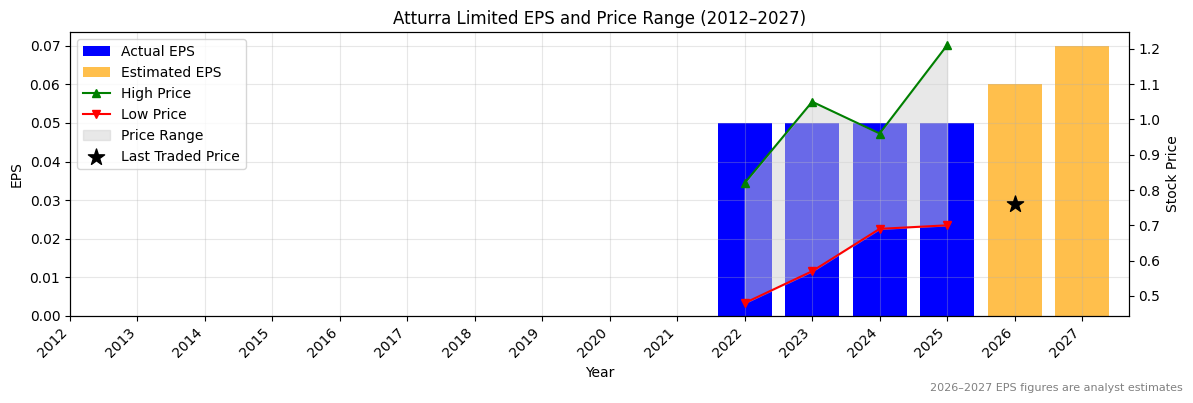
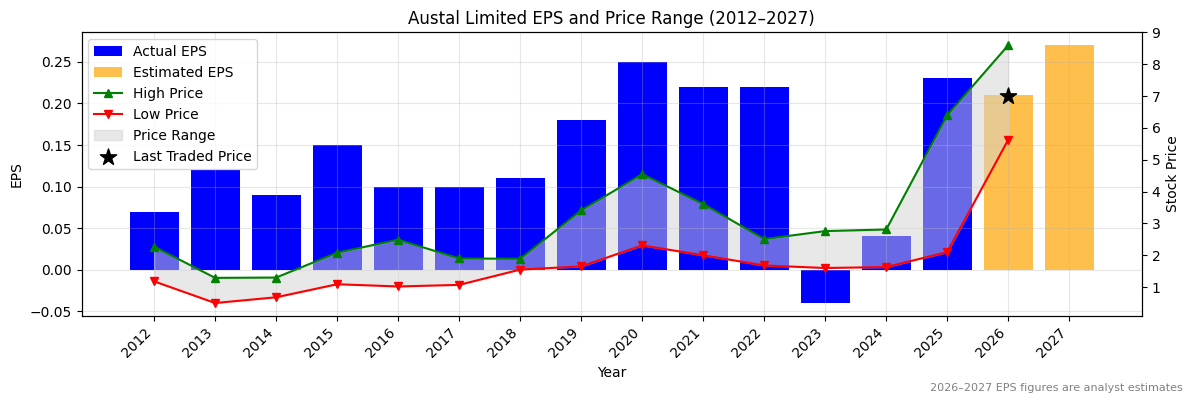
BGA Normalised Earnings Per Share (EPS) (2012–2027)
✅✅
Valuation
| Price To Sales |
Price To Book |
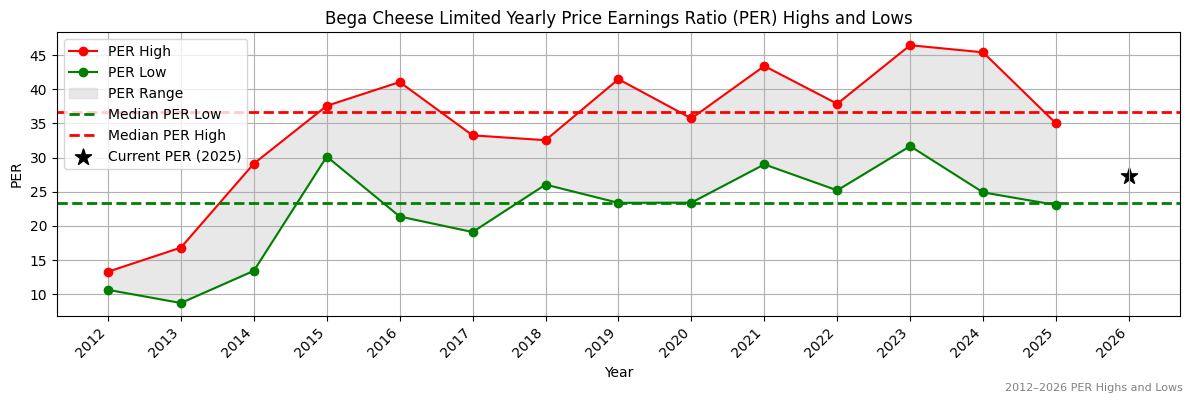
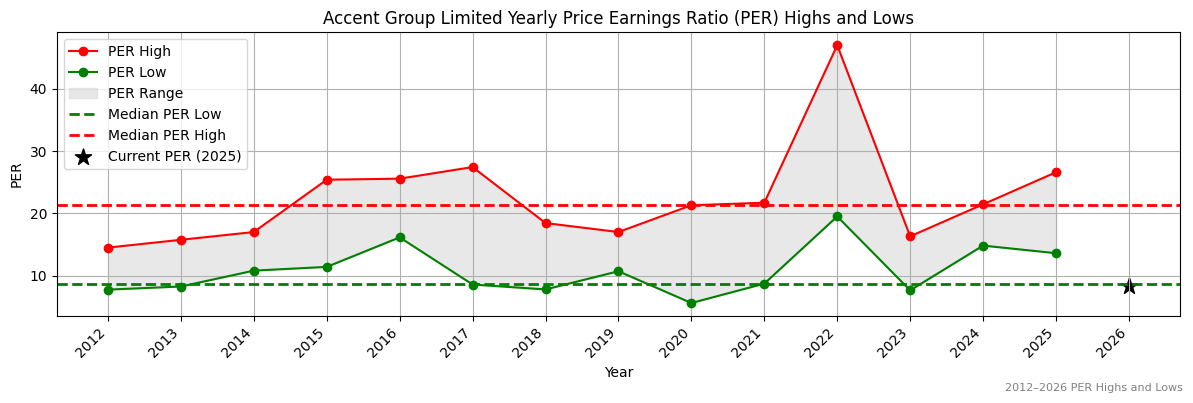
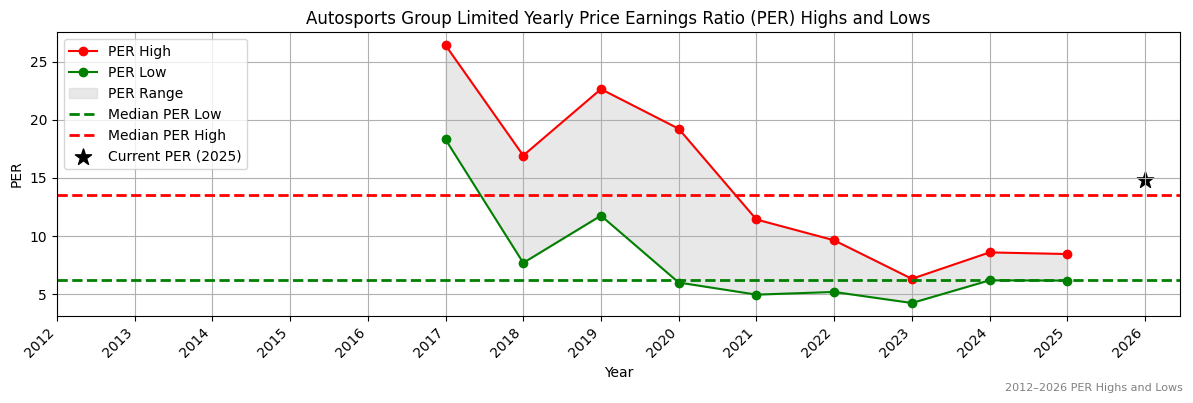
PER 2023 |
PER 2024 |
13Y Median PER Low |
PER 2025e |
13Y Median PER High |
PER 2026e |
Last Updated |
| 0.5 |
1.7 |
59.0 |
53.1 |
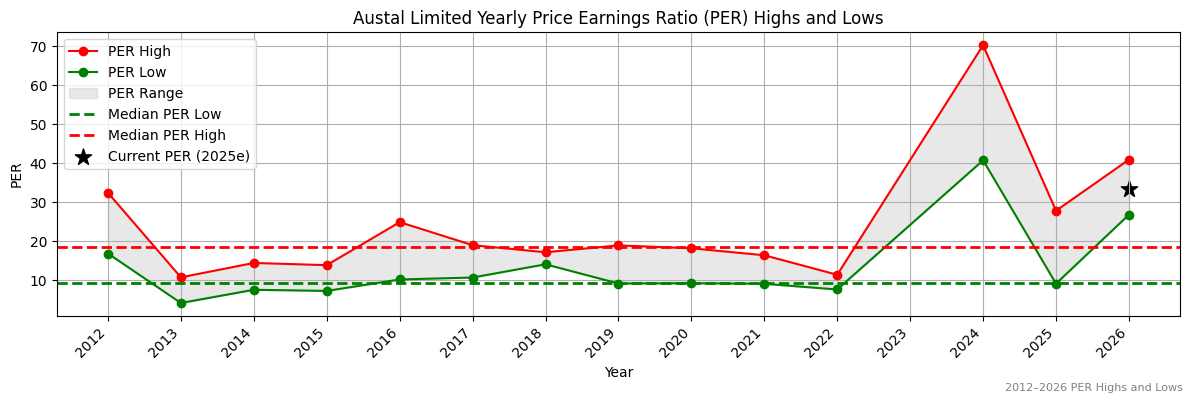
23.4 |
29.5 |
36.7 |
24.1 |
26/10/25 |
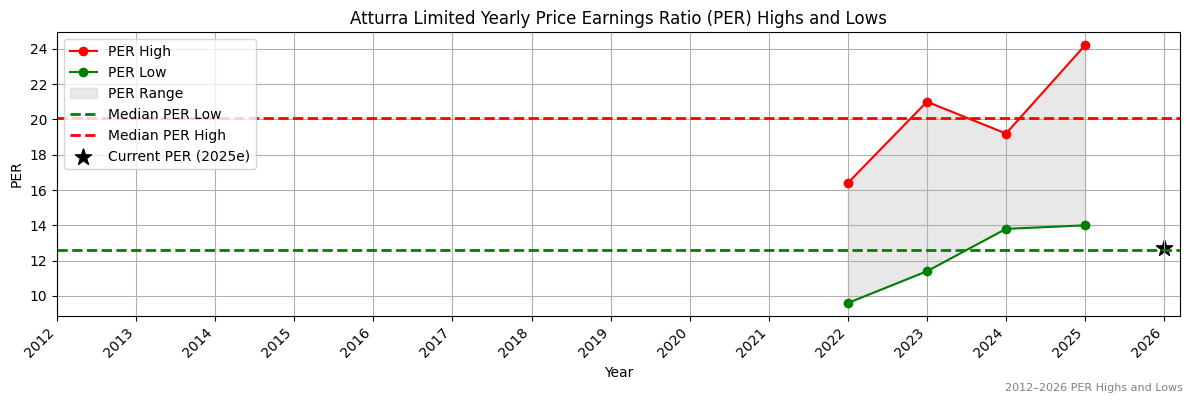
BGA Yearly Price Earnings Ratio (PER) Highs and Lows
✅
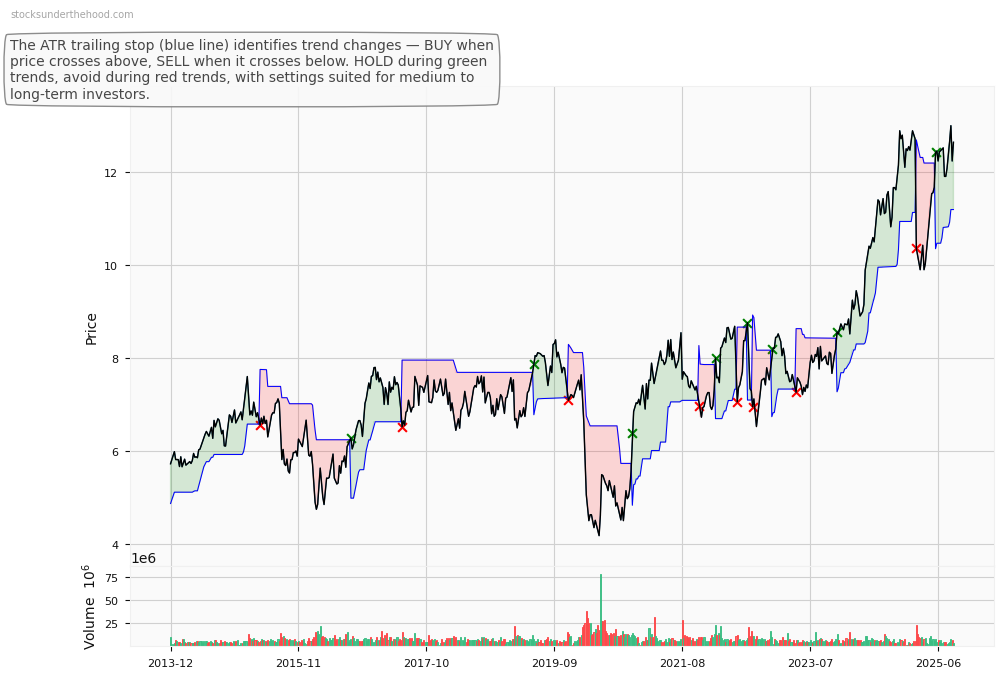
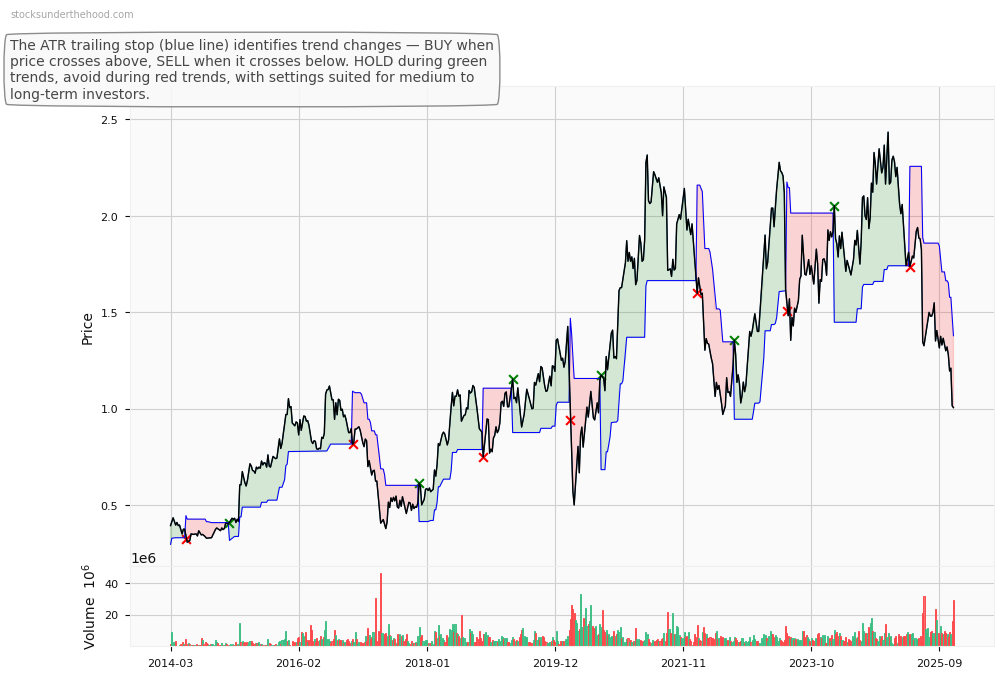
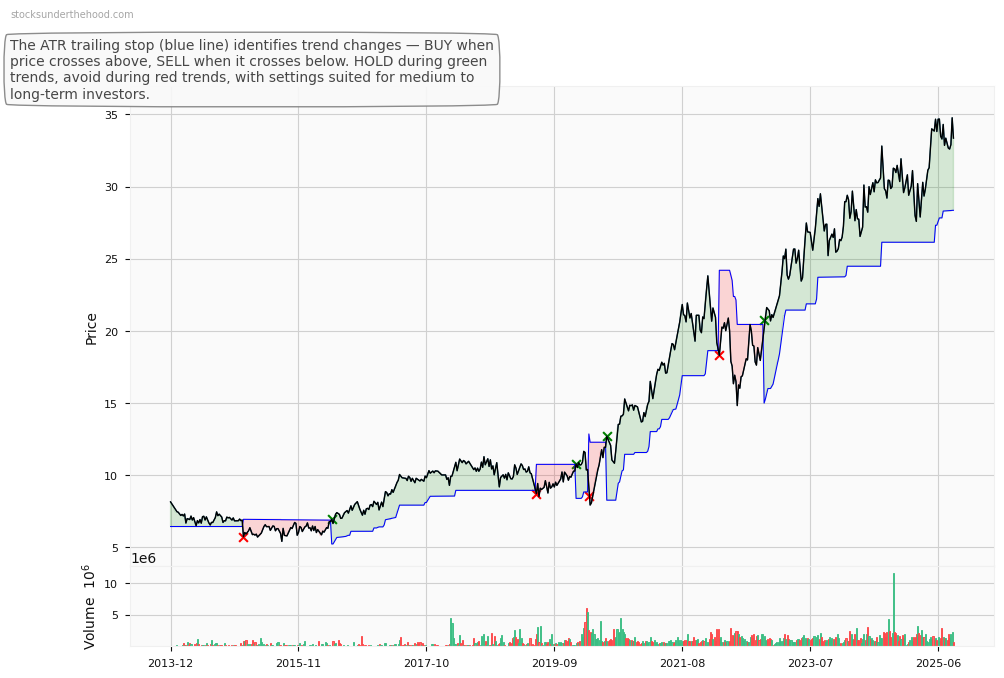
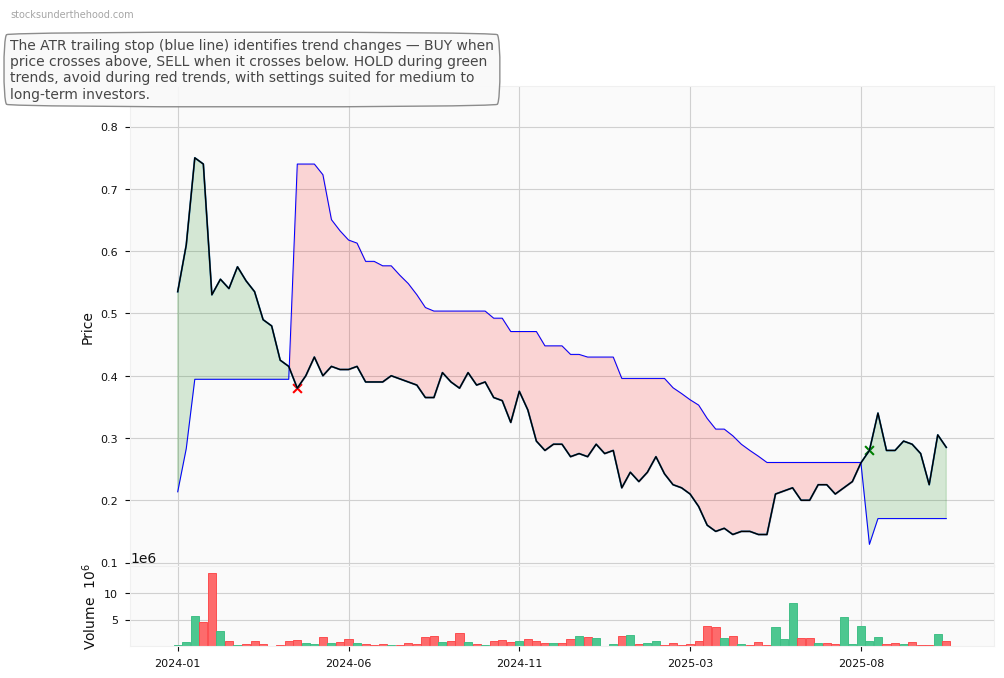
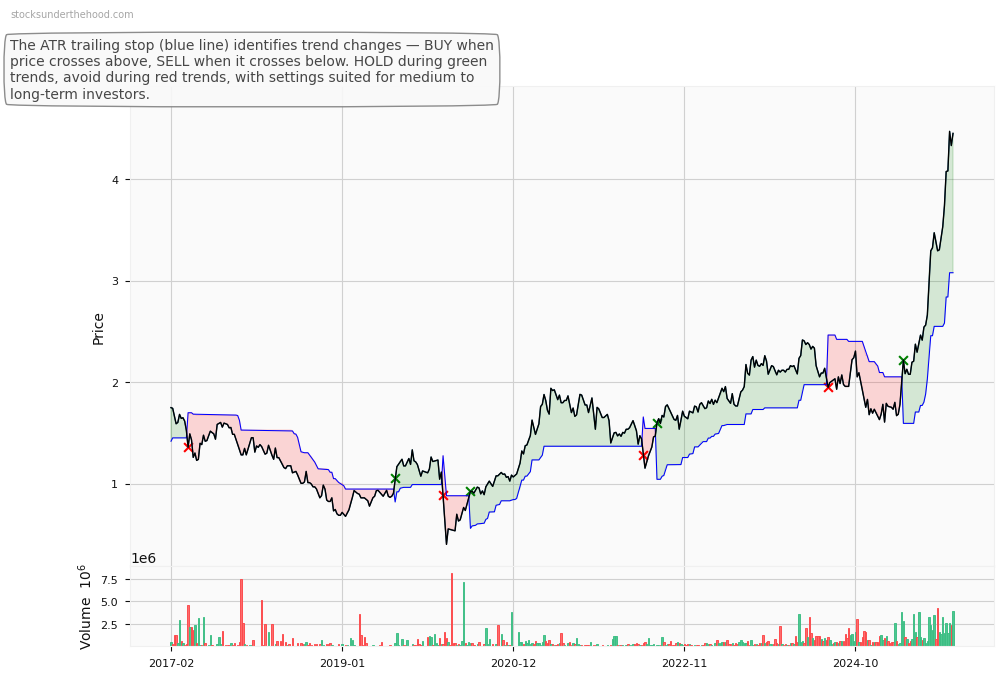
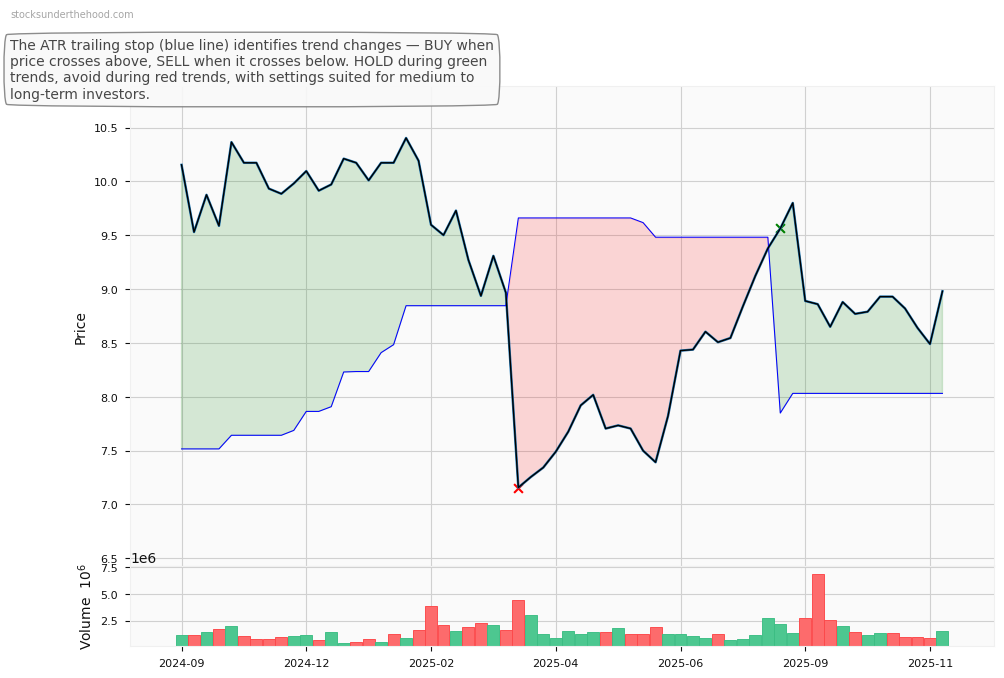
BGA Weekly Price Chart with Average True Range (ATR) Trailing Stop (10-Year View)
Ticker code: BFG
BFG Red Flags & Risk Indicators
⚠️
⚠️ RED FLAGS: 1 identified
Income Statement
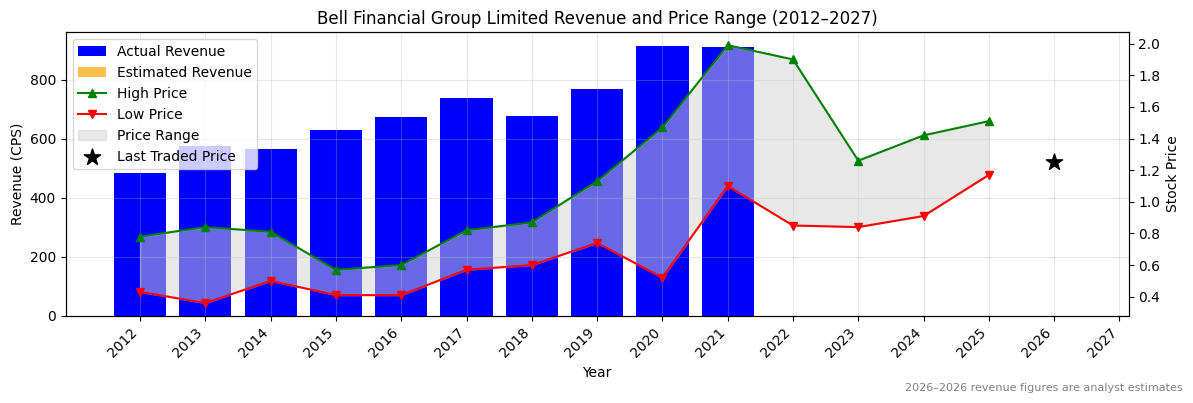
| Revenue 2024 Per Share |
Revenue 2025e Per Share |
Revenue 2026e Per Share |
Revenue 24 to 25e [%] |
Revenue 25e to 26e [%] |
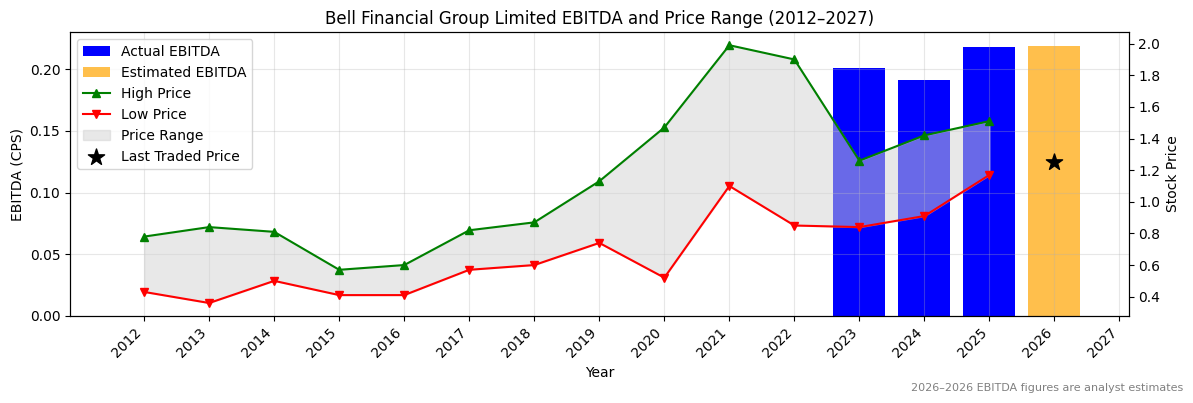
EBITDA 2024 Per Share |
EBITDA 2025e Per Share |
EBITDA 2026e Per Share |
EBITDA 24 to 25e [%] |
EBITDA 25e to 26e [%] |
| 0.8618 |
0.82465 |
0.88513 |
-4.3 |
7.3 |
0.19114 |
0.21762 |
0.21887 |
13.9 |
0.6 |
BFG Revenue Per Share (2012–2027)
❌
BFG Earnings before Interest, Tax, Depreciation and Amortisation (EBITDA) Per Share (2012–2027)
✅
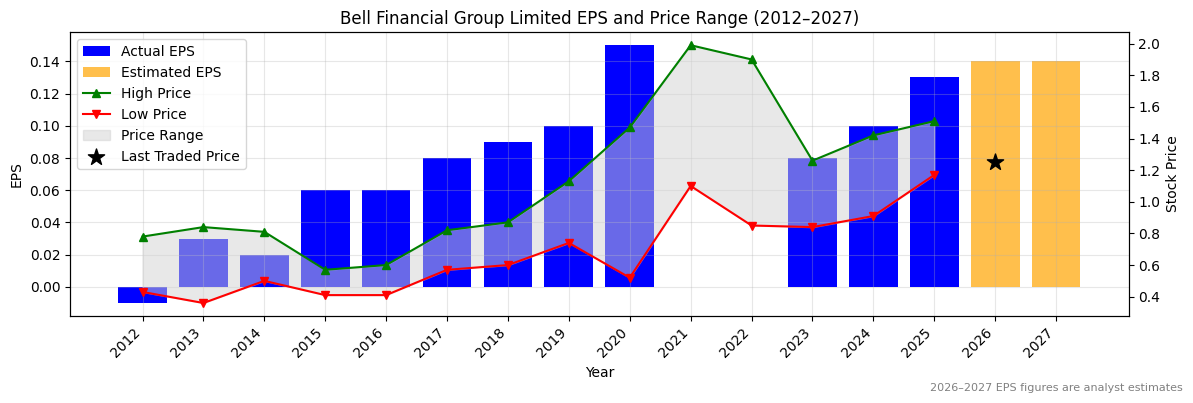
BFG Normalised Earnings Per Share (EPS) (2012–2027)
✅✅
Valuation
| Price To Sales |
Price To Book |
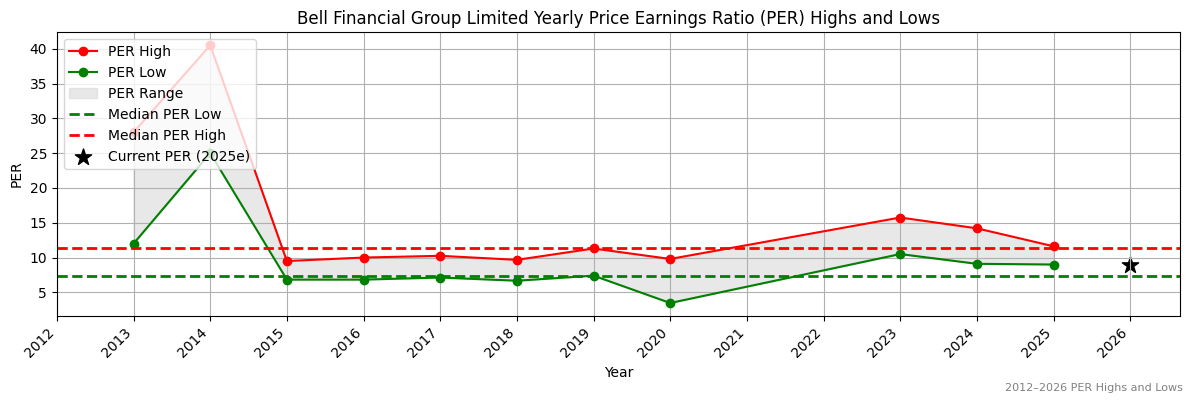
PER 2023 |
PER 2024 |
13Y Median PER Low |
PER 2025e |
13Y Median PER High |
PER 2026e |
Last Updated |
| 1.7 |
1.7 |
15.7 |
12.6 |
7.4 |
9.7 |
11.3 |
9.0 |
21/4/25 |
BFG Yearly Price Earnings Ratio (PER) Highs and Lows
✅
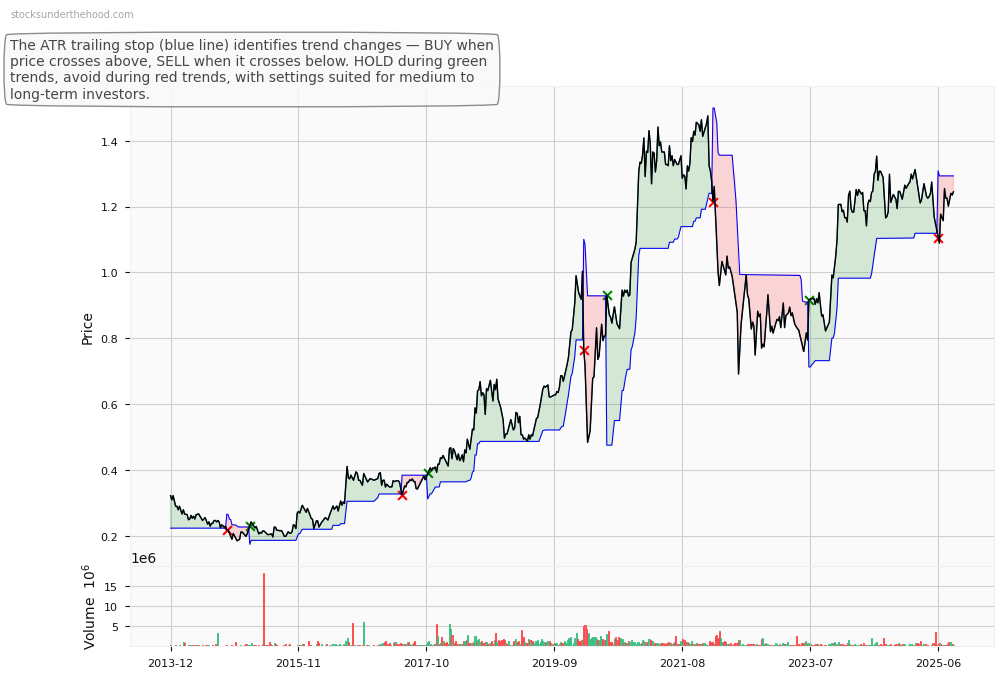
BFG Weekly Price Chart with Average True Range (ATR) Trailing Stop (10-Year View)
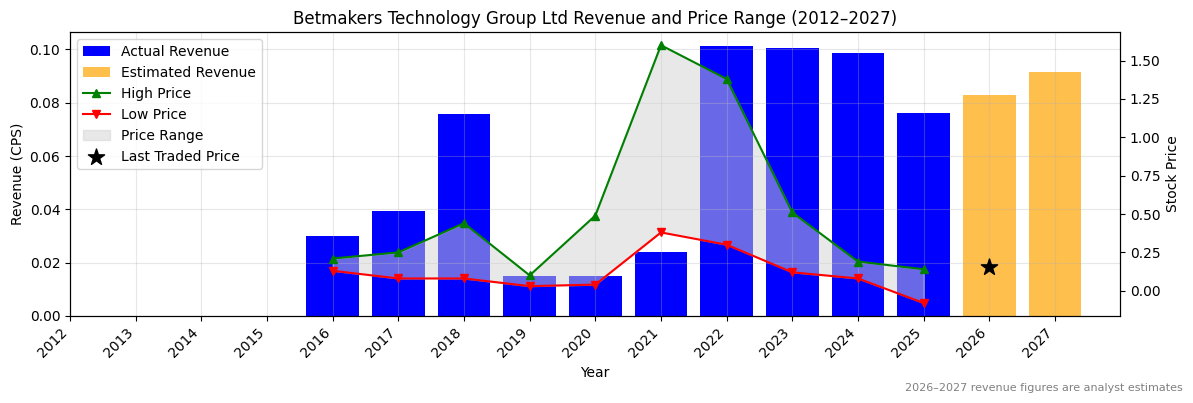
Ticker code: BET
BET Red Flags & Risk Indicators
❌
⚠️ RED FLAGS: 3 identified
- Large Share Issuance
- Low Operating Margin
- Falling EBITDA Margins
Income Statement
| Revenue 2024 Per Share |
Revenue 2025e Per Share |
Revenue 2026e Per Share |
Revenue 24 to 25e [%] |
Revenue 25e to 26e [%] |
EBITDA 2024 Per Share |
EBITDA 2025e Per Share |
EBITDA 2026e Per Share |
EBITDA 24 to 25e [%] |
EBITDA 25e to 26e [%] |
| 0.09865 |
0.07687 |
0.0839 |
-22.1 |
9.2 |
0.0115 |
0.00145 |
0.01113 |
-87.4 |
669.3 |
BET Revenue Per Share (2012–2027)
❌
BET Earnings before Interest, Tax, Depreciation and Amortisation (EBITDA) Per Share (2012–2027)
❌
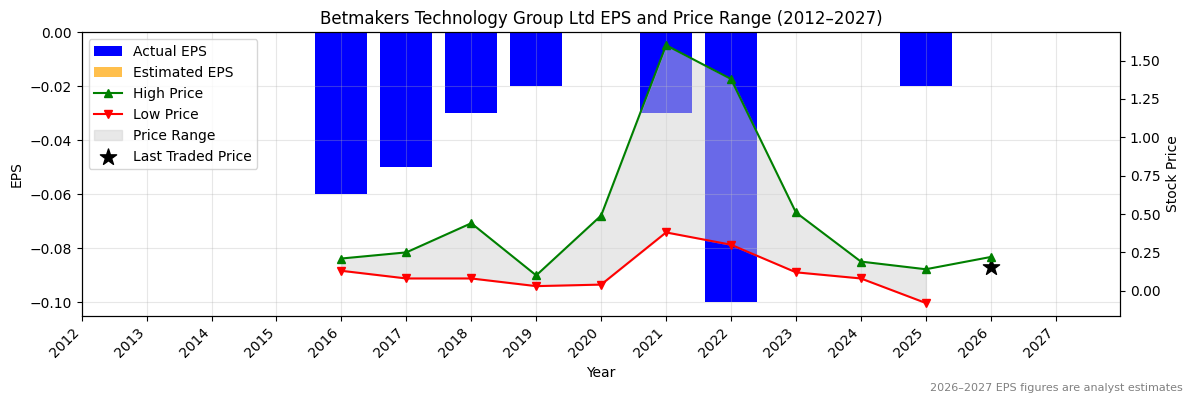
BET Normalised Earnings Per Share (EPS) (2012–2027)
Valuation
| Price To Sales |
Price To Book |
PER 2023 |
PER 2024 |
13Y Median PER Low |
PER 2025e |
13Y Median PER High |
PER 2026e |
Last Updated |
| 2.1 |
1.8 |
None |
None |
3.8 |
-8.0 |
None |
None |
11/10/25 |
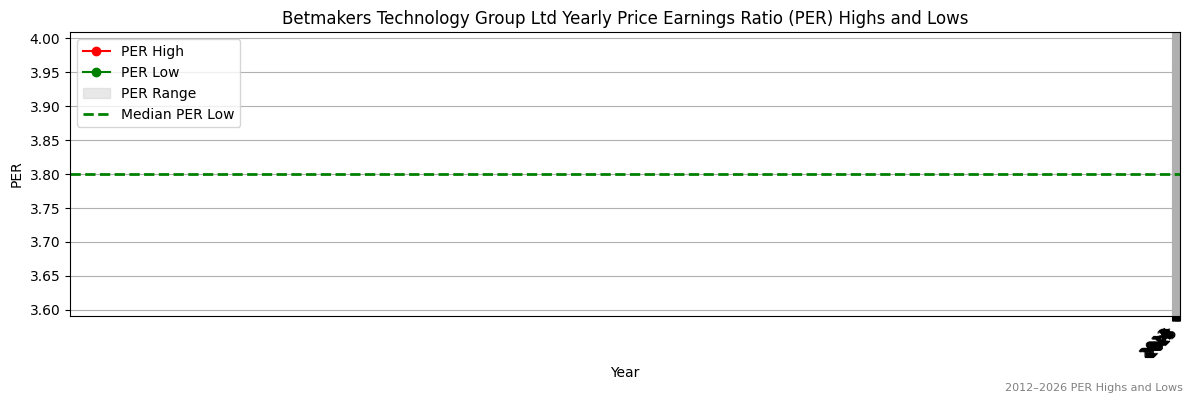
BET Yearly Price Earnings Ratio (PER) Highs and Lows
BET Weekly Price Chart with Average True Range (ATR) Trailing Stop (10-Year View)
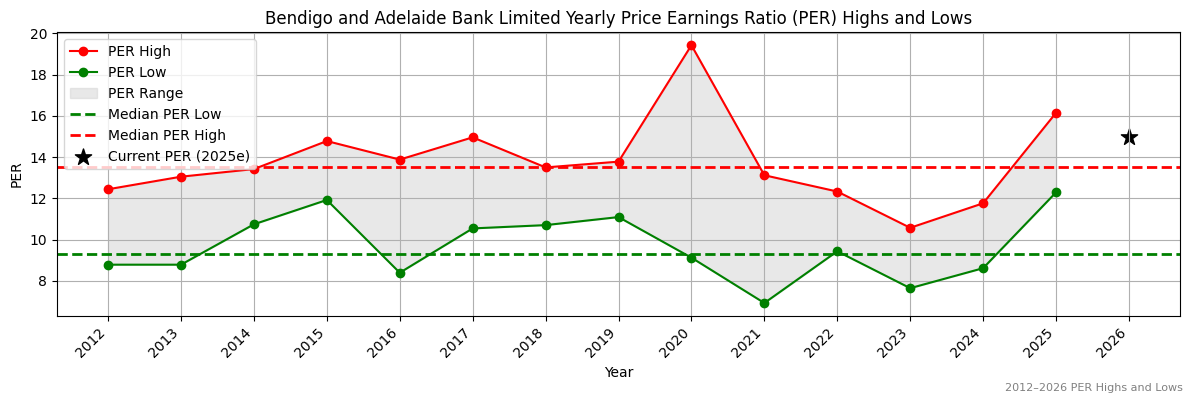
Ticker code: BEN
BEN Red Flags & Risk Indicators
❌
⚠️ RED FLAGS: 3 identified
- Low Operating Margin
- High Relative Valuation
- Falling EBITDA Margins
Income Statement
| Revenue 2024 Per Share |
Revenue 2025e Per Share |
Revenue 2026e Per Share |
Revenue 24 to 25e [%] |
Revenue 25e to 26e [%] |
EBITDA 2024 Per Share |
EBITDA 2025e Per Share |
EBITDA 2026e Per Share |
EBITDA 24 to 25e [%] |
EBITDA 25e to 26e [%] |
| 3.44074 |
3.41648 |
3.57858 |
-0.7 |
4.7 |
1.46384 |
1.30048 |
1.347 |
-11.2 |
3.6 |
BEN Revenue Per Share (2012–2027)
❌
BEN Earnings before Interest, Tax, Depreciation and Amortisation (EBITDA) Per Share (2012–2027)
❌
BEN Normalised Earnings Per Share (EPS) (2012–2027)
❌
Valuation
| Price To Sales |
Price To Book |
PER 2023 |
PER 2024 |
13Y Median PER Low |
PER 2025e |
13Y Median PER High |
PER 2026e |
Last Updated |
| 3.7 |
1.1 |
12.4 |
12.8 |
9.3 |
14.9 |
13.5 |
15.1 |
21/4/25 |
BEN Yearly Price Earnings Ratio (PER) Highs and Lows
❌
BEN Weekly Price Chart with Average True Range (ATR) Trailing Stop (10-Year View)
Ticker code: BCC
BCC Red Flags & Risk Indicators
✅
⚠️ RED FLAGS: 0 identified
No red flags detected.
Income Statement
| Revenue 2024 Per Share |
Revenue 2025e Per Share |
Revenue 2026e Per Share |
Revenue 24 to 25e [%] |
Revenue 25e to 26e [%] |
EBITDA 2024 Per Share |
EBITDA 2025e Per Share |
EBITDA 2026e Per Share |
EBITDA 24 to 25e [%] |
EBITDA 25e to 26e [%] |
| None |
None |
None |
None |
None |
None |
None |
None |
None |
None |
BCC Revenue Per Share (2012–2027)
BCC Earnings before Interest, Tax, Depreciation and Amortisation (EBITDA) Per Share (2012–2027)
BCC Normalised Earnings Per Share (EPS) (2012–2027)
Valuation
| Price To Sales |
Price To Book |
PER 2023 |
PER 2024 |
13Y Median PER Low |
PER 2025e |
13Y Median PER High |
PER 2026e |
Last Updated |
| 0.3 |
2.6 |
None |
None |
None |
None |
None |
None |
None |
BCC Yearly Price Earnings Ratio (PER) Highs and Lows
BCC Weekly Price Chart with Average True Range (ATR) Trailing Stop (10-Year View)
Ticker code: BBN
BBN Red Flags & Risk Indicators
⚠️
⚠️ RED FLAGS: 1 identified
- More Net Debt Than Equity
Income Statement
| Revenue 2024 Per Share |
Revenue 2025e Per Share |
Revenue 2026e Per Share |
Revenue 24 to 25e [%] |
Revenue 25e to 26e [%] |
EBITDA 2024 Per Share |
EBITDA 2025e Per Share |
EBITDA 2026e Per Share |
EBITDA 24 to 25e [%] |
EBITDA 25e to 26e [%] |
| 3.69434 |
3.86851 |
4.2225 |
4.7 |
9.2 |
0.39509 |
0.4857 |
0.57156 |
22.9 |
17.7 |
BBN Revenue Per Share (2012–2027)
✅
BBN Earnings before Interest, Tax, Depreciation and Amortisation (EBITDA) Per Share (2012–2027)
✅✅
BBN Normalised Earnings Per Share (EPS) (2012–2027)
✅✅
Valuation
| Price To Sales |
Price To Book |
PER 2023 |
PER 2024 |
13Y Median PER Low |
PER 2025e |
13Y Median PER High |
PER 2026e |
Last Updated |
| 0.7 |
3.3 |
24.9 |
91.3 |
15.2 |
30.4 |
28.2 |
21.1 |
14/9/25 |
BBN Yearly Price Earnings Ratio (PER) Highs and Lows
❌
BBN Weekly Price Chart with Average True Range (ATR) Trailing Stop (10-Year View)
Ticker code: BAP
BAP Red Flags & Risk Indicators
❌
⚠️ RED FLAGS: 4 identified
- Highly Shorted
- Increasing Shorts
- Falling Earnings
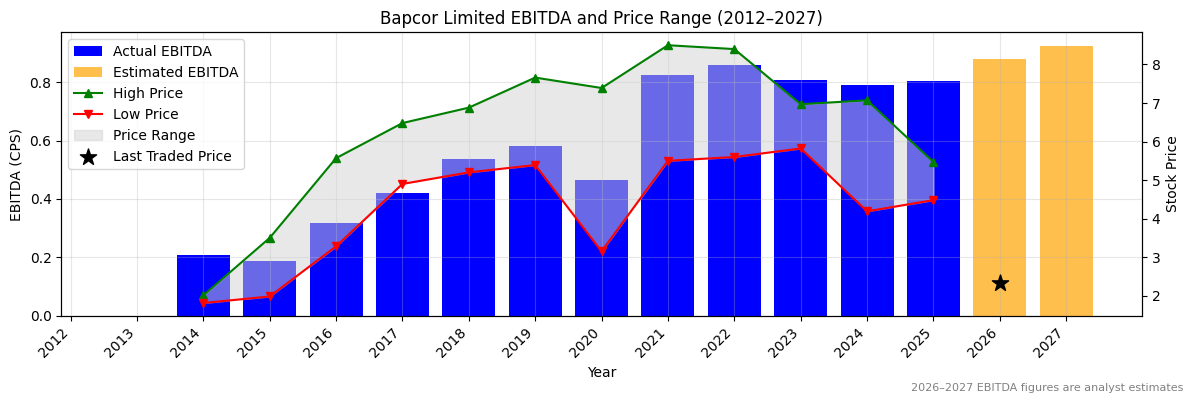
- Falling Revenues
Income Statement
| Revenue 2024 Per Share |
Revenue 2025e Per Share |
Revenue 2026e Per Share |
Revenue 24 to 25e [%] |
Revenue 25e to 26e [%] |
EBITDA 2024 Per Share |
EBITDA 2025e Per Share |
EBITDA 2026e Per Share |
EBITDA 24 to 25e [%] |
EBITDA 25e to 26e [%] |
| 6.00159 |
5.9579 |
6.1711 |
-0.7 |
3.6 |
0.79078 |
0.8048 |
0.87896 |
1.8 |
9.2 |
BAP Revenue Per Share (2012–2027)
❌
BAP Earnings before Interest, Tax, Depreciation and Amortisation (EBITDA) Per Share (2012–2027)
✅
BAP Normalised Earnings Per Share (EPS) (2012–2027)
❌
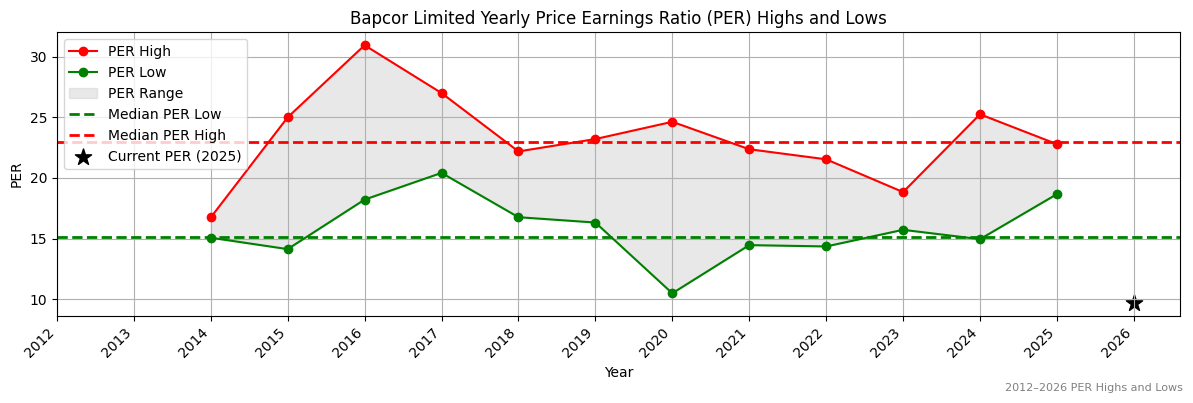
Valuation
| Price To Sales |
Price To Book |
PER 2023 |
PER 2024 |
13Y Median PER Low |
PER 2025e |
13Y Median PER High |
PER 2026e |
Last Updated |
| 0.4 |
1.0 |
6.8 |
9.0 |
15.1 |
10.5 |
23.0 |
10.5 |
10/3/25 |
BAP Yearly Price Earnings Ratio (PER) Highs and Lows
✅✅
BAP Weekly Price Chart with Average True Range (ATR) Trailing Stop (10-Year View)
Ticker code: AZJ
AZJ Red Flags & Risk Indicators
❌
⚠️ RED FLAGS: 4 identified
- Increasing Shorts
- Falling Earnings
- More Net Debt Than Equity
- Falling EBITDA Margins
Income Statement
| Revenue 2024 Per Share |
Revenue 2025e Per Share |
Revenue 2026e Per Share |
Revenue 24 to 25e [%] |
Revenue 25e to 26e [%] |
EBITDA 2024 Per Share |
EBITDA 2025e Per Share |
EBITDA 2026e Per Share |
EBITDA 24 to 25e [%] |
EBITDA 25e to 26e [%] |
| 2.08834 |
2.25423 |
2.33459 |
7.9 |
3.6 |
0.88227 |
0.9243 |
0.98376 |
4.8 |
6.4 |
AZJ Revenue Per Share (2012–2027)
✅
AZJ Earnings before Interest, Tax, Depreciation and Amortisation (EBITDA) Per Share (2012–2027)
✅
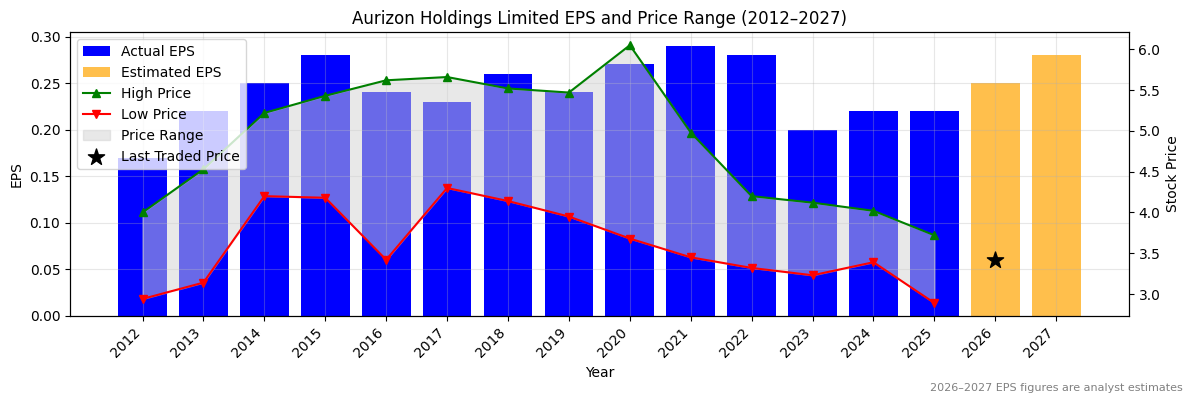
AZJ Normalised Earnings Per Share (EPS) (2012–2027)
❌
Valuation
| Price To Sales |
Price To Book |
PER 2023 |
PER 2024 |
13Y Median PER Low |
PER 2025e |
13Y Median PER High |
PER 2026e |
Last Updated |
| 1.5 |
1.5 |
17.2 |
15.6 |
15.2 |
15.6 |
20.7 |
13.7 |
9/6/25 |
AZJ Yearly Price Earnings Ratio (PER) Highs and Lows
✅
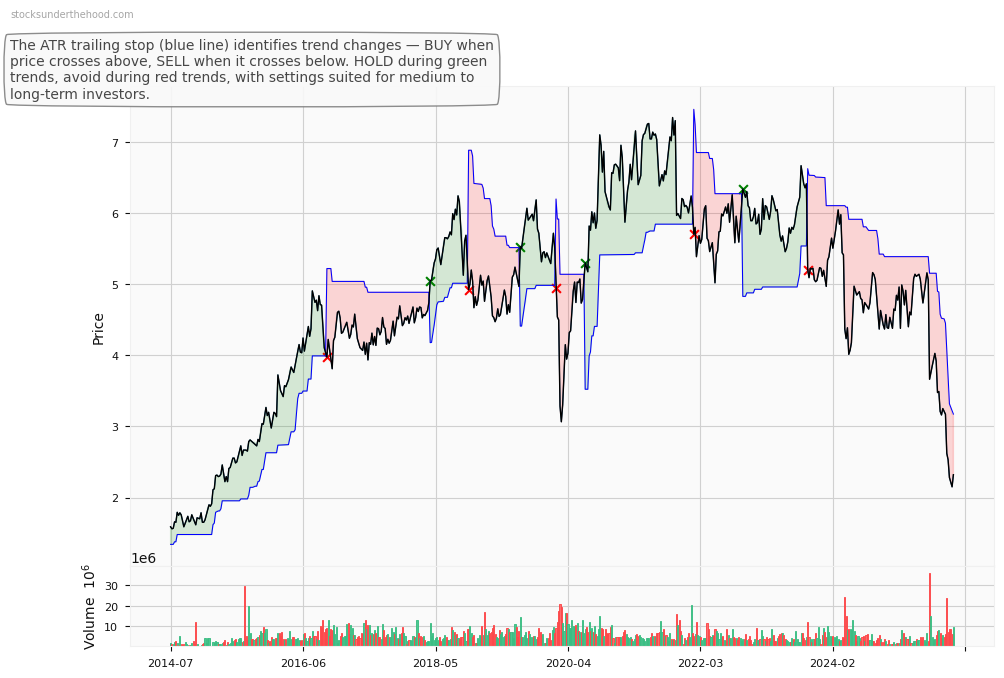
AZJ Weekly Price Chart with Average True Range (ATR) Trailing Stop (10-Year View)
Ticker code: AX1
AX1 Red Flags & Risk Indicators
❌
⚠️ RED FLAGS: 3 identified
- Increasing Shorts
- More Net Debt Than Equity
- Falling EBITDA Margins
Income Statement
| Revenue 2024 Per Share |
Revenue 2025e Per Share |
Revenue 2026e Per Share |
Revenue 24 to 25e [%] |
Revenue 25e to 26e [%] |
EBITDA 2024 Per Share |
EBITDA 2025e Per Share |
EBITDA 2026e Per Share |
EBITDA 24 to 25e [%] |
EBITDA 25e to 26e [%] |
| 2.58276 |
2.47932 |
2.65786 |
-4.0 |
7.2 |
0.52156 |
0.4626 |
0.50981 |
-11.3 |
10.2 |
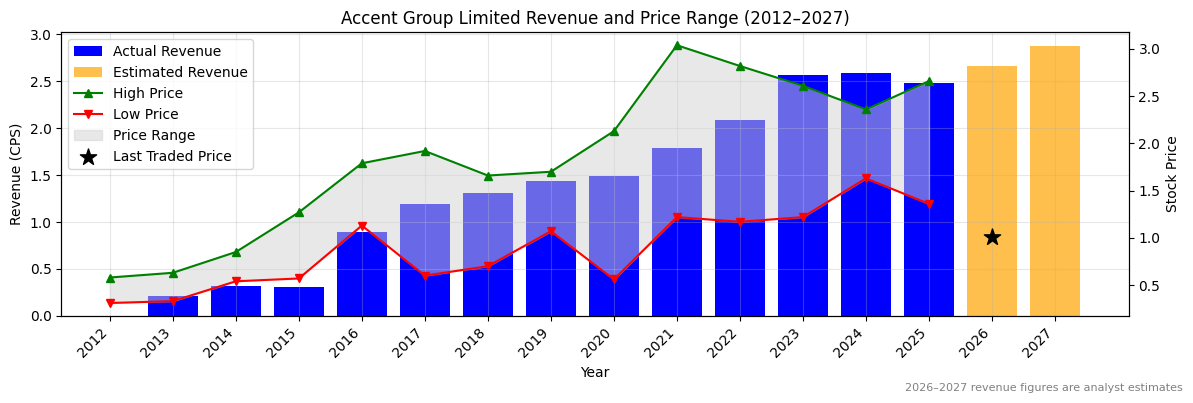
AX1 Revenue Per Share (2012–2027)
❌
AX1 Earnings before Interest, Tax, Depreciation and Amortisation (EBITDA) Per Share (2012–2027)
❌
AX1 Normalised Earnings Per Share (EPS) (2012–2027)
❌
Valuation
| Price To Sales |
Price To Book |
PER 2023 |
PER 2024 |
13Y Median PER Low |
PER 2025e |
13Y Median PER High |
PER 2026e |
Last Updated |
| 0.5 |
1.6 |
8.0 |
11.6 |
10.6 |
12.8 |
21.4 |
10.7 |
15/6/25 |
AX1 Yearly Price Earnings Ratio (PER) Highs and Lows
✅
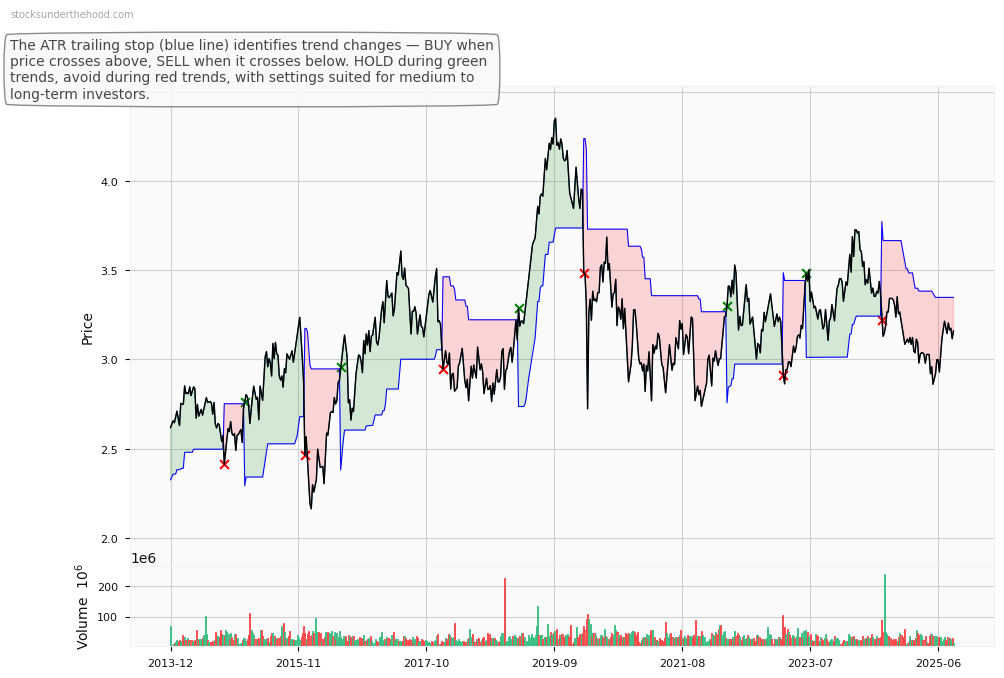
AX1 Weekly Price Chart with Average True Range (ATR) Trailing Stop (10-Year View)
Ticker code: ASX:AVJ
ASX:AVJ Red Flags & Risk Indicators
✅
⚠️ RED FLAGS: 0 identified
No red flags detected.
Income Statement
| Revenue 2024 Per Share |
Revenue 2025e Per Share |
Revenue 2026e Per Share |
Revenue 24 to 25e [%] |
Revenue 25e to 26e [%] |
EBITDA 2024 Per Share |
EBITDA 2025e Per Share |
EBITDA 2026e Per Share |
EBITDA 24 to 25e [%] |
EBITDA 25e to 26e [%] |
| None |
None |
None |
None |
None |
None |
None |
None |
None |
None |
ASX:AVJ Revenue Per Share (2012–2027)
ASX:AVJ Earnings before Interest, Tax, Depreciation and Amortisation (EBITDA) Per Share (2012–2027)
ASX:AVJ Normalised Earnings Per Share (EPS) (2012–2027)
Valuation
| Price To Sales |
Price To Book |
PER 2023 |
PER 2024 |
13Y Median PER Low |
PER 2025e |
13Y Median PER High |
PER 2026e |
Last Updated |
| 1.1 |
0.8 |
None |
None |
None |
None |
None |
None |
None |
ASX:AVJ Yearly Price Earnings Ratio (PER) Highs and Lows
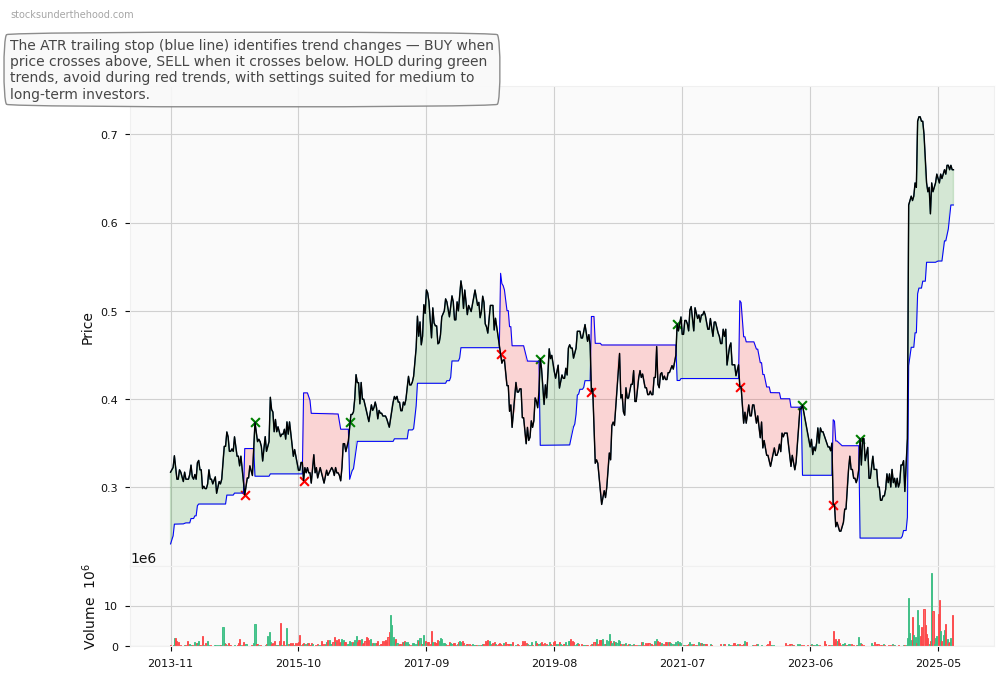
ASX:AVJ Weekly Price Chart with Average True Range (ATR) Trailing Stop (10-Year View)
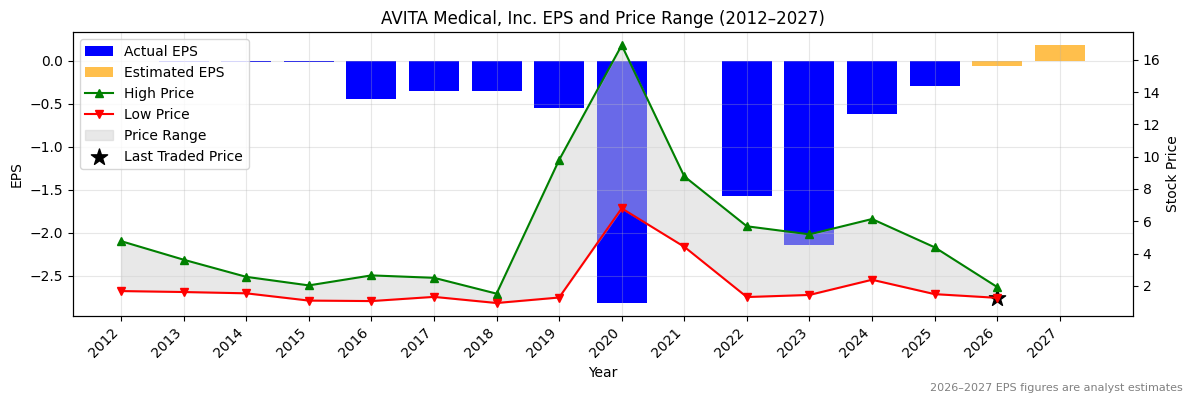
Ticker code: AVH
AVH Red Flags & Risk Indicators
❌
⚠️ RED FLAGS: 4 identified
- Negative Operating Cash Flow
- Low Operating Margin
- Negative Equity
- Risk Of Capital Raise
Income Statement
| Revenue 2024 Per Share |
Revenue 2025e Per Share |
Revenue 2026e Per Share |
Revenue 24 to 25e [%] |
Revenue 25e to 26e [%] |
EBITDA 2024 Per Share |
EBITDA 2025e Per Share |
EBITDA 2026e Per Share |
EBITDA 24 to 25e [%] |
EBITDA 25e to 26e [%] |
| 0.65748 |
0.87183 |
1.19464 |
32.6 |
37.0 |
-0.5676 |
-0.36846 |
-0.14027 |
35.1 |
61.9 |
AVH Revenue Per Share (2012–2027)
✅✅
AVH Earnings before Interest, Tax, Depreciation and Amortisation (EBITDA) Per Share (2012–2027)
✅✅
AVH Normalised Earnings Per Share (EPS) (2012–2027)
✅✅
Valuation
| Price To Sales |
Price To Book |
PER 2023 |
PER 2024 |
13Y Median PER Low |
PER 2025e |
13Y Median PER High |
PER 2026e |
Last Updated |
| 2.1 |
-2.4 |
-0.5 |
-1.9 |
None |
-4.0 |
None |
-19.2 |
31/10/25 |
AVH Yearly Price Earnings Ratio (PER) Highs and Lows
AVH Weekly Price Chart with Average True Range (ATR) Trailing Stop (10-Year View)
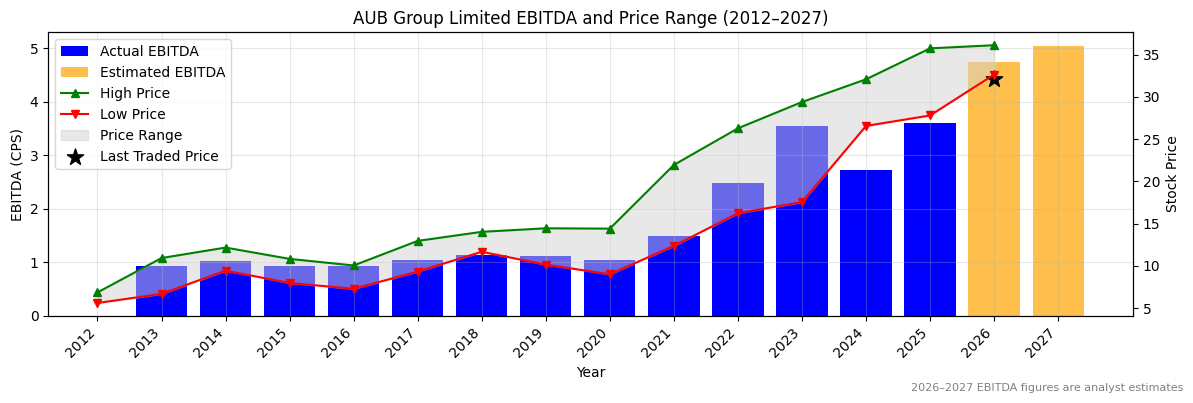
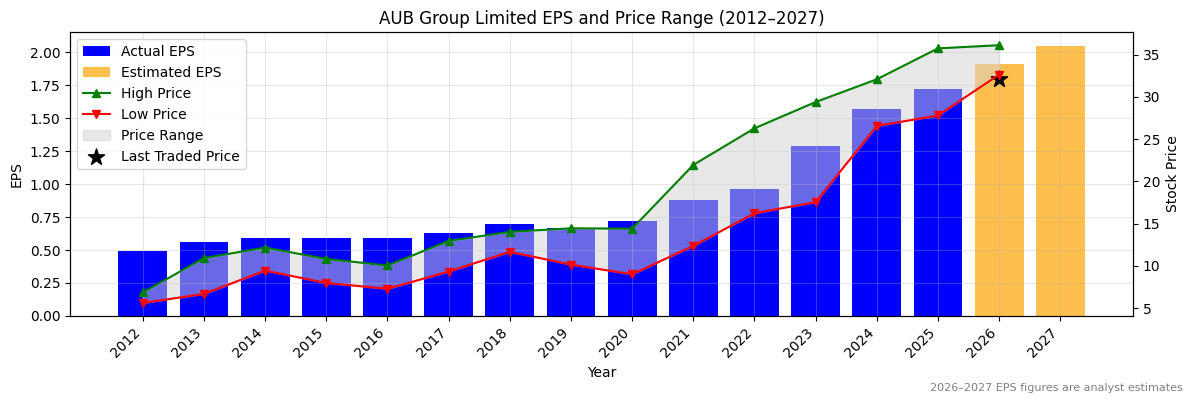
Ticker code: AUB
AUB Red Flags & Risk Indicators
⚠️
⚠️ RED FLAGS: 2 identified
- Increasing Shorts
- Falling EBITDA Margins
Income Statement
| Revenue 2024 Per Share |
Revenue 2025e Per Share |
Revenue 2026e Per Share |
Revenue 24 to 25e [%] |
Revenue 25e to 26e [%] |
EBITDA 2024 Per Share |
EBITDA 2025e Per Share |
EBITDA 2026e Per Share |
EBITDA 24 to 25e [%] |
EBITDA 25e to 26e [%] |
| 9.07768 |
12.87703 |
13.74582 |
41.9 |
6.7 |
2.72048 |
3.61094 |
4.7349 |
32.7 |
31.1 |
AUB Revenue Per Share (2012–2027)
✅✅
AUB Earnings before Interest, Tax, Depreciation and Amortisation (EBITDA) Per Share (2012–2027)
✅✅
AUB Normalised Earnings Per Share (EPS) (2012–2027)
✅
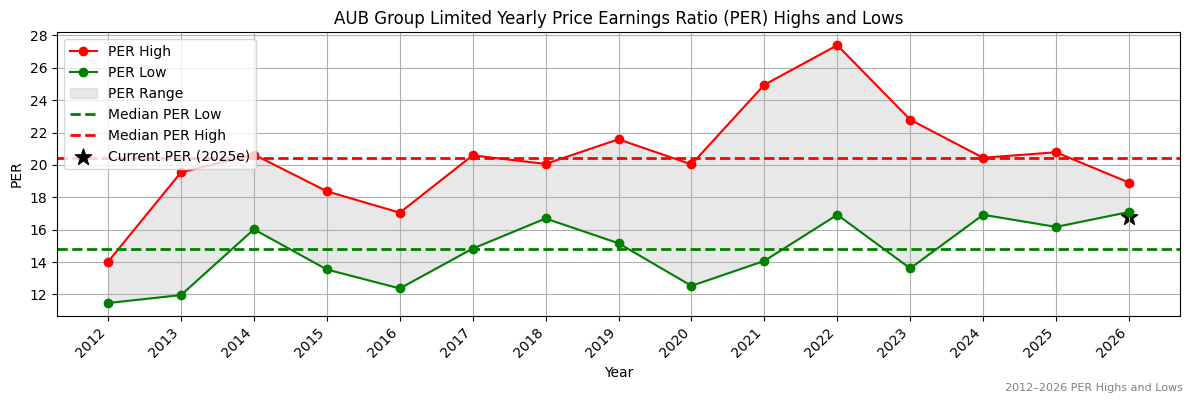
Valuation
| Price To Sales |
Price To Book |
PER 2023 |
PER 2024 |
13Y Median PER Low |
PER 2025e |
13Y Median PER High |
PER 2026e |
Last Updated |
| 3.7 |
2.5 |
28.6 |
23.5 |
14.8 |
21.5 |
20.6 |
19.3 |
31/10/25 |
AUB Yearly Price Earnings Ratio (PER) Highs and Lows
❌
AUB Weekly Price Chart with Average True Range (ATR) Trailing Stop (10-Year View)
Ticker code: ATG
ATG Red Flags & Risk Indicators
⚠️
⚠️ RED FLAGS: 2 identified
- Low Operating Margin
- Falling Earnings
Income Statement
| Revenue 2024 Per Share |
Revenue 2025e Per Share |
Revenue 2026e Per Share |
Revenue 24 to 25e [%] |
Revenue 25e to 26e [%] |
EBITDA 2024 Per Share |
EBITDA 2025e Per Share |
EBITDA 2026e Per Share |
EBITDA 24 to 25e [%] |
EBITDA 25e to 26e [%] |
| 1.49915 |
1.24265 |
1.3216 |
-17.1 |
6.4 |
0.0124 |
0.00655 |
0.05268 |
-47.2 |
704.2 |
ATG Revenue Per Share (2012–2027)
❌
ATG Earnings before Interest, Tax, Depreciation and Amortisation (EBITDA) Per Share (2012–2027)
❌
ATG Normalised Earnings Per Share (EPS) (2012–2027)
Valuation
| Price To Sales |
Price To Book |
PER 2023 |
PER 2024 |
13Y Median PER Low |
PER 2025e |
13Y Median PER High |
PER 2026e |
Last Updated |
| 0.2 |
2.0 |
None |
None |
None |
None |
None |
None |
None |
ATG Yearly Price Earnings Ratio (PER) Highs and Lows
ATG Weekly Price Chart with Average True Range (ATR) Trailing Stop (10-Year View)
Ticker code: ATA
ATA Red Flags & Risk Indicators
⚠️
⚠️ RED FLAGS: 1 identified
Income Statement
| Revenue 2024 Per Share |
Revenue 2025e Per Share |
Revenue 2026e Per Share |
Revenue 24 to 25e [%] |
Revenue 25e to 26e [%] |
EBITDA 2024 Per Share |
EBITDA 2025e Per Share |
EBITDA 2026e Per Share |
EBITDA 24 to 25e [%] |
EBITDA 25e to 26e [%] |
| 0.81414 |
0.78679 |
0.88673 |
-3.4 |
12.7 |
0.08518 |
0.07969 |
0.09122 |
-6.4 |
14.5 |
ATA Revenue Per Share (2012–2027)
❌
ATA Earnings before Interest, Tax, Depreciation and Amortisation (EBITDA) Per Share (2012–2027)
❌
ATA Normalised Earnings Per Share (EPS) (2012–2027)
❌
Valuation
| Price To Sales |
Price To Book |
PER 2023 |
PER 2024 |
13Y Median PER Low |
PER 2025e |
13Y Median PER High |
PER 2026e |
Last Updated |
| 0.9 |
1.2 |
14.4 |
14.4 |
12.6 |
14.4 |
20.1 |
12.0 |
10/11/24 |
ATA Yearly Price Earnings Ratio (PER) Highs and Lows
✅
ATA Weekly Price Chart with Average True Range (ATR) Trailing Stop (10-Year View)
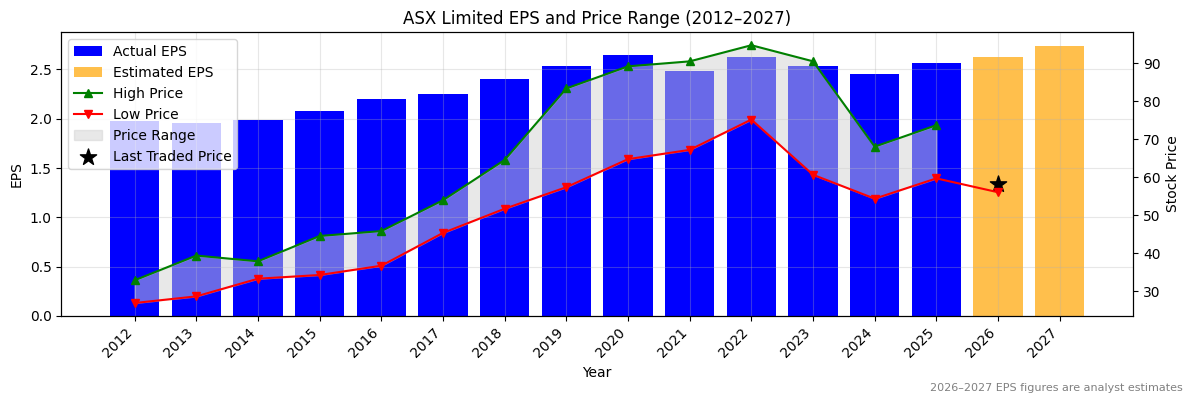
Ticker code: ASX
ASX Red Flags & Risk Indicators
❌
⚠️ RED FLAGS: 3 identified
- Negative Operating Cash Flow
- Low Operating Margin
- Increasing Shorts
Income Statement
| Revenue 2024 Per Share |
Revenue 2025e Per Share |
Revenue 2026e Per Share |
Revenue 24 to 25e [%] |
Revenue 25e to 26e [%] |
EBITDA 2024 Per Share |
EBITDA 2025e Per Share |
EBITDA 2026e Per Share |
EBITDA 24 to 25e [%] |
EBITDA 25e to 26e [%] |
| 5.33419 |
5.63347 |
5.88998 |
5.6 |
4.6 |
3.30995 |
3.50232 |
3.65101 |
5.8 |
4.2 |
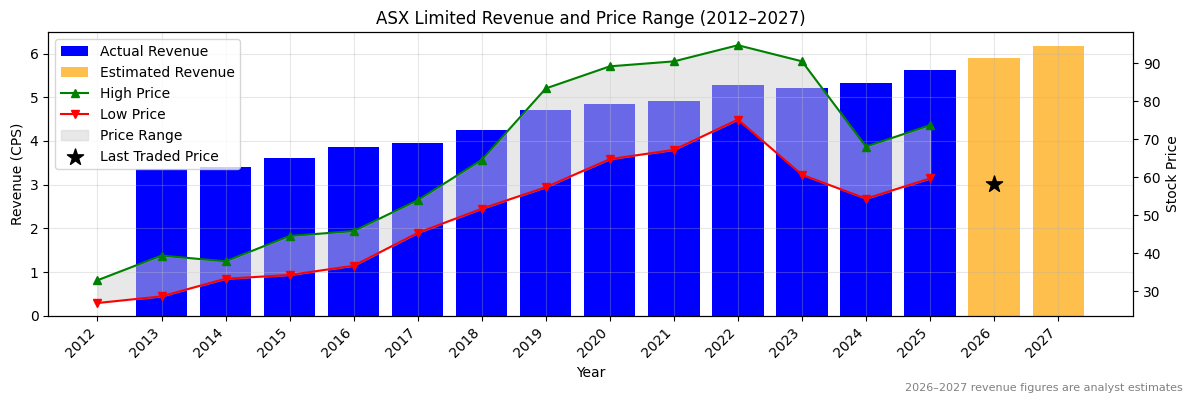
ASX Revenue Per Share (2012–2027)
✅
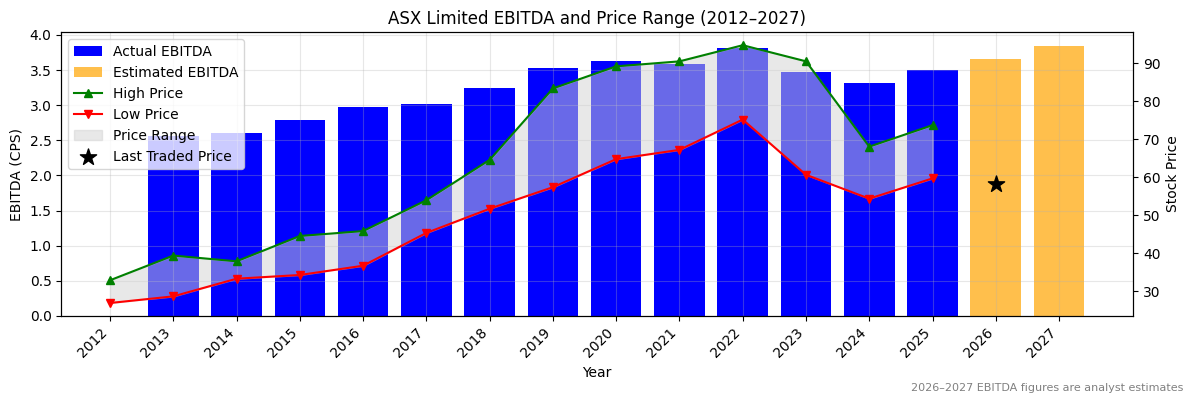
ASX Earnings before Interest, Tax, Depreciation and Amortisation (EBITDA) Per Share (2012–2027)
✅
ASX Normalised Earnings Per Share (EPS) (2012–2027)
✅
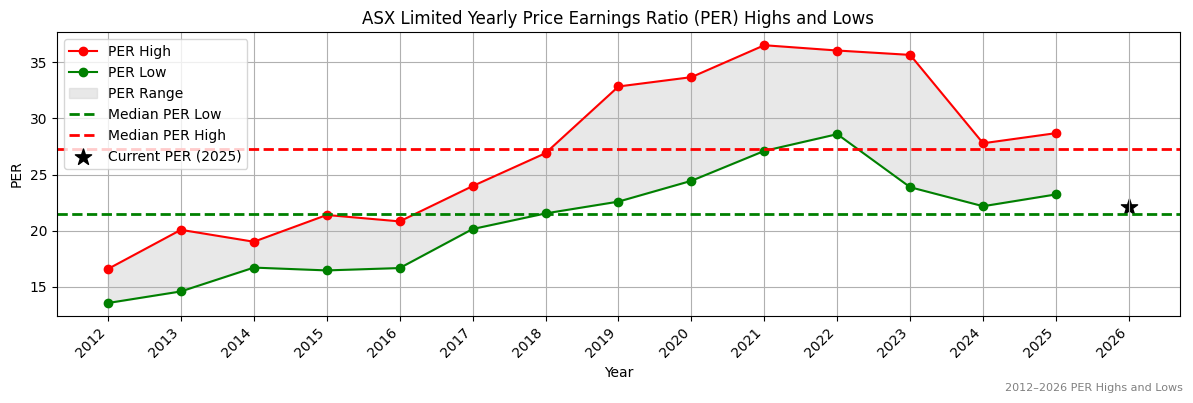
Valuation
| Price To Sales |
Price To Book |
PER 2023 |
PER 2024 |
13Y Median PER Low |
PER 2025e |
13Y Median PER High |
PER 2026e |
Last Updated |
| 9.8 |
2.8 |
22.2 |
23.0 |
21.5 |
22.0 |
27.3 |
21.5 |
29/3/25 |
ASX Yearly Price Earnings Ratio (PER) Highs and Lows
✅
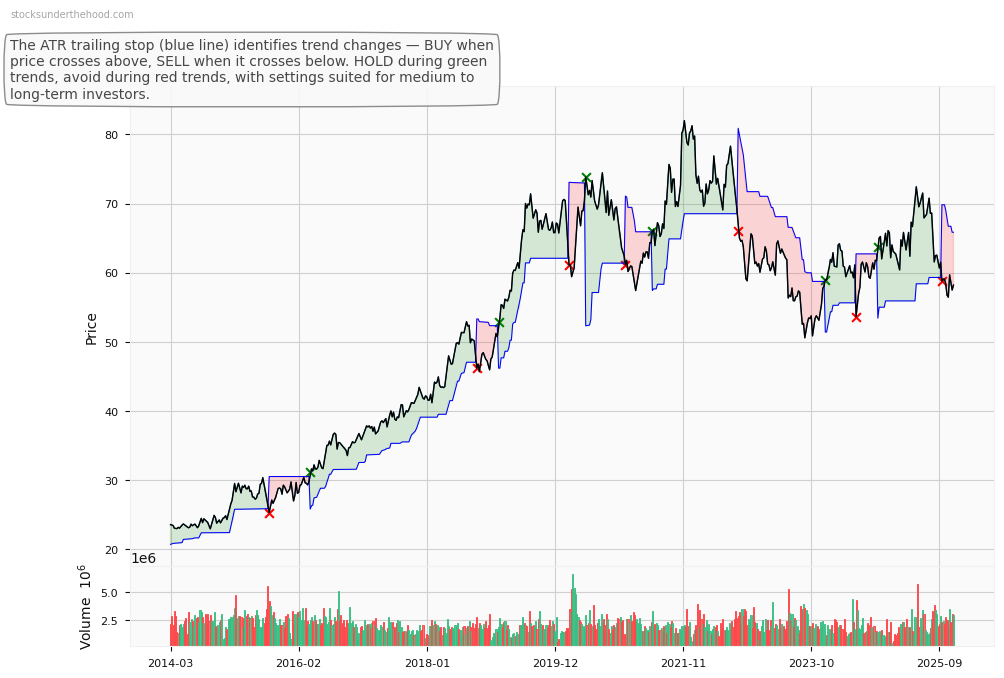
ASX Weekly Price Chart with Average True Range (ATR) Trailing Stop (10-Year View)
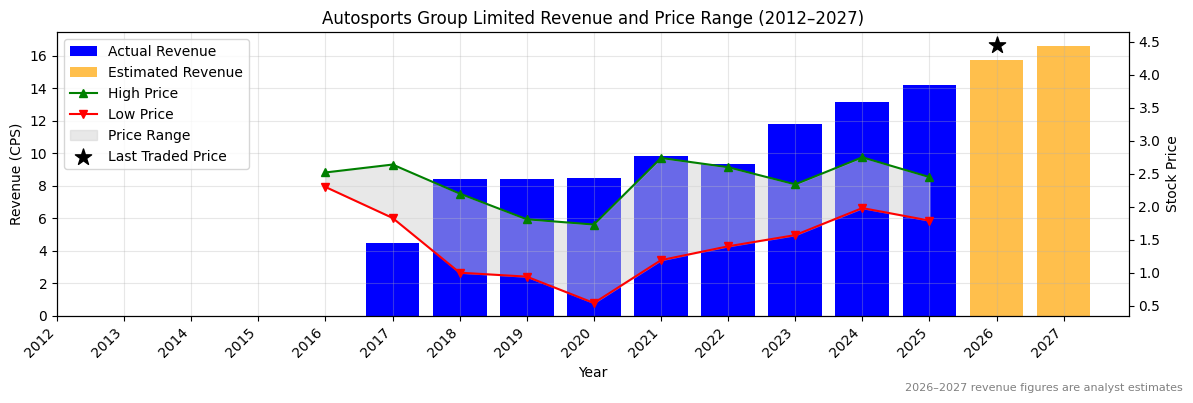
Ticker code: ASG
ASG Red Flags & Risk Indicators
❌
⚠️ RED FLAGS: 5 identified
- Increasing Shorts
- Falling Earnings
- More Net Debt Than Equity
- High Relative Valuation
- Falling EBITDA Margins
Income Statement
| Revenue 2024 Per Share |
Revenue 2025e Per Share |
Revenue 2026e Per Share |
Revenue 24 to 25e [%] |
Revenue 25e to 26e [%] |
EBITDA 2024 Per Share |
EBITDA 2025e Per Share |
EBITDA 2026e Per Share |
EBITDA 24 to 25e [%] |
EBITDA 25e to 26e [%] |
| 13.16798 |
14.20154 |
15.74441 |
7.8 |
10.9 |
1.0209 |
0.84432 |
0.98444 |
-17.3 |
16.6 |
ASG Revenue Per Share (2012–2027)
✅
ASG Earnings before Interest, Tax, Depreciation and Amortisation (EBITDA) Per Share (2012–2027)
❌
ASG Normalised Earnings Per Share (EPS) (2012–2027)
❌
Valuation
| Price To Sales |
Price To Book |
PER 2023 |
PER 2024 |
13Y Median PER Low |
PER 2025e |
13Y Median PER High |
PER 2026e |
Last Updated |
| 0.3 |
1.6 |
11.1 |
12.9 |
6.2 |
14.2 |
12.7 |
13.7 |
11/10/25 |
ASG Yearly Price Earnings Ratio (PER) Highs and Lows
❌
ASG Weekly Price Chart with Average True Range (ATR) Trailing Stop (10-Year View)
Ticker code: ASB
ASB Red Flags & Risk Indicators
⚠️
⚠️ RED FLAGS: 2 identified
- Increasing Shorts
- High Relative Valuation
Income Statement
| Revenue 2024 Per Share |
Revenue 2025e Per Share |
Revenue 2026e Per Share |
Revenue 24 to 25e [%] |
Revenue 25e to 26e [%] |
EBITDA 2024 Per Share |
EBITDA 2025e Per Share |
EBITDA 2026e Per Share |
EBITDA 24 to 25e [%] |
EBITDA 25e to 26e [%] |
| 4.06674 |
4.32912 |
5.01774 |
6.5 |
15.9 |
0.3492 |
0.44278 |
0.51193 |
26.8 |
15.6 |
ASB Revenue Per Share (2012–2027)
✅
ASB Earnings before Interest, Tax, Depreciation and Amortisation (EBITDA) Per Share (2012–2027)
✅✅
ASB Normalised Earnings Per Share (EPS) (2012–2027)
✅✅
Valuation
| Price To Sales |
Price To Book |
PER 2023 |
PER 2024 |
13Y Median PER Low |
PER 2025e |
13Y Median PER High |
PER 2026e |
Last Updated |
| 1.6 |
2.2 |
-169.7 |
169.7 |
9.2 |
29.5 |
18.6 |
32.3 |
28/9/25 |
ASB Yearly Price Earnings Ratio (PER) Highs and Lows
❌
ASB Weekly Price Chart with Average True Range (ATR) Trailing Stop (10-Year View)
Ticker code: ARF
ARF Red Flags & Risk Indicators
❌
⚠️ RED FLAGS: 3 identified
- Increasing Shorts
- Falling Earnings
- Falling EBITDA Margins
Income Statement
| Revenue 2024 Per Share |
Revenue 2025e Per Share |
Revenue 2026e Per Share |
Revenue 24 to 25e [%] |
Revenue 25e to 26e [%] |
EBITDA 2024 Per Share |
EBITDA 2025e Per Share |
EBITDA 2026e Per Share |
EBITDA 24 to 25e [%] |
EBITDA 25e to 26e [%] |
| 0.22874 |
0.22816 |
0.25141 |
-0.3 |
10.2 |
0.21409 |
0.20354 |
None |
-4.9 |
None |
ARF Revenue Per Share (2012–2027)
❌
ARF Earnings before Interest, Tax, Depreciation and Amortisation (EBITDA) Per Share (2012–2027)
❌
ARF Normalised Earnings Per Share (EPS) (2012–2027)
✅
Valuation
| Price To Sales |
Price To Book |
PER 2023 |
PER 2024 |
13Y Median PER Low |
PER 2025e |
13Y Median PER High |
PER 2026e |
Last Updated |
| 13.3 |
1.2 |
21.5 |
20.3 |
15.1 |
19.2 |
21.6 |
19.2 |
15/4/24 |
ARF Yearly Price Earnings Ratio (PER) Highs and Lows
✅
ARF Weekly Price Chart with Average True Range (ATR) Trailing Stop (10-Year View)
Ticker code: ARB
ARB Red Flags & Risk Indicators
❌
⚠️ RED FLAGS: 3 identified
- Highly Shorted
- Falling Earnings
- Falling EBITDA Margins
Income Statement
| Revenue 2024 Per Share |
Revenue 2025e Per Share |
Revenue 2026e Per Share |
Revenue 24 to 25e [%] |
Revenue 25e to 26e [%] |
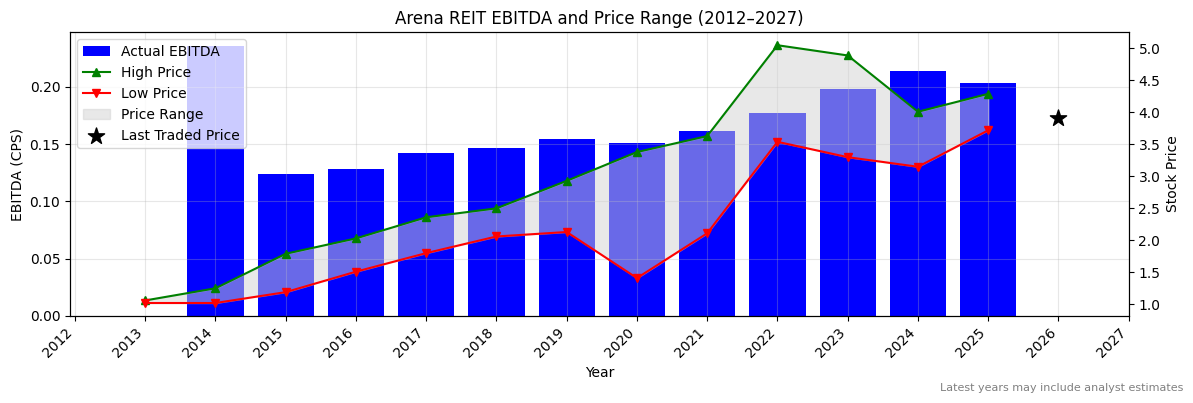
EBITDA 2024 Per Share |
EBITDA 2025e Per Share |
EBITDA 2026e Per Share |
EBITDA 24 to 25e [%] |
EBITDA 25e to 26e [%] |
| 8.44275 |
8.74658 |
9.47883 |
3.6 |
8.4 |
2.10463 |
2.01399 |
2.18847 |
-4.3 |
8.7 |
ARB Revenue Per Share (2012–2027)
✅
ARB Earnings before Interest, Tax, Depreciation and Amortisation (EBITDA) Per Share (2012–2027)
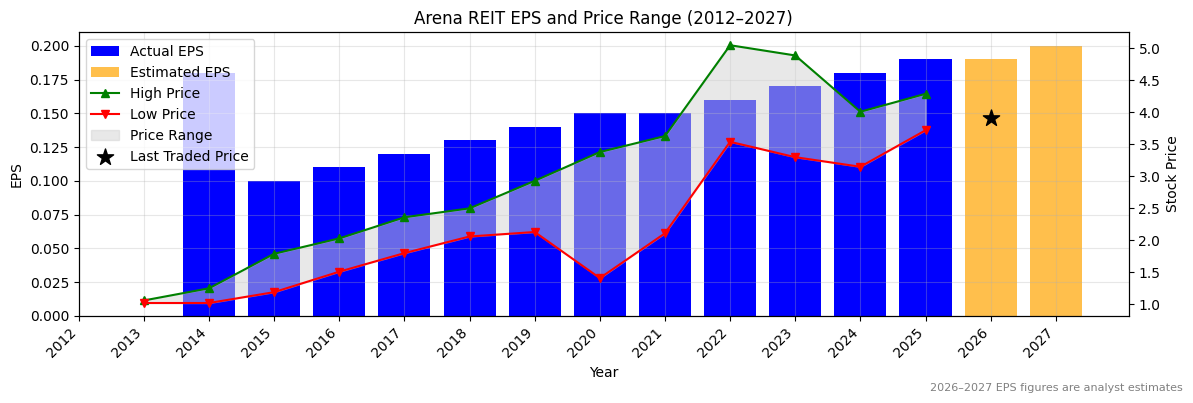
❌
ARB Normalised Earnings Per Share (EPS) (2012–2027)
❌
Valuation
| Price To Sales |
Price To Book |
PER 2023 |
PER 2024 |
13Y Median PER Low |
PER 2025e |
13Y Median PER High |
PER 2026e |
Last Updated |
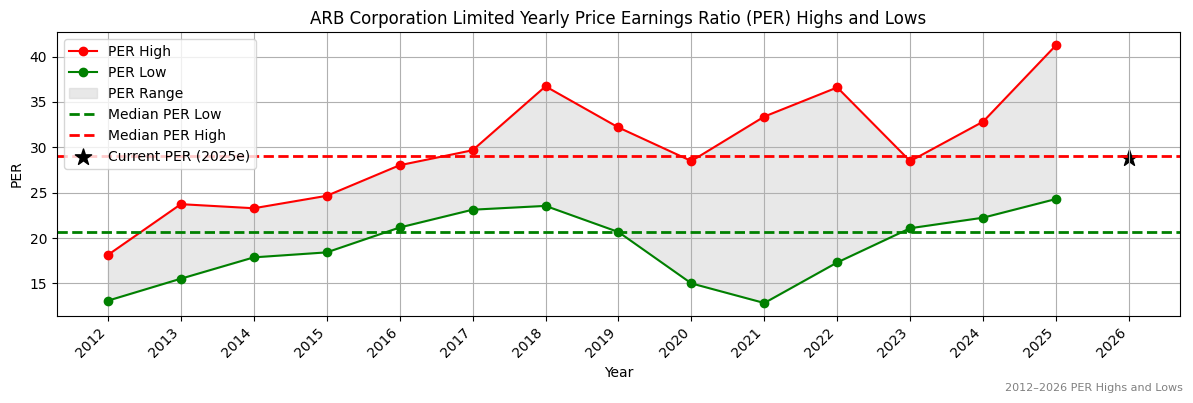
| 4.1 |
4.0 |
30.1 |
28.4 |
20.7 |
31.1 |
29.1 |
28.2 |
8/9/25 |
ARB Yearly Price Earnings Ratio (PER) Highs and Lows
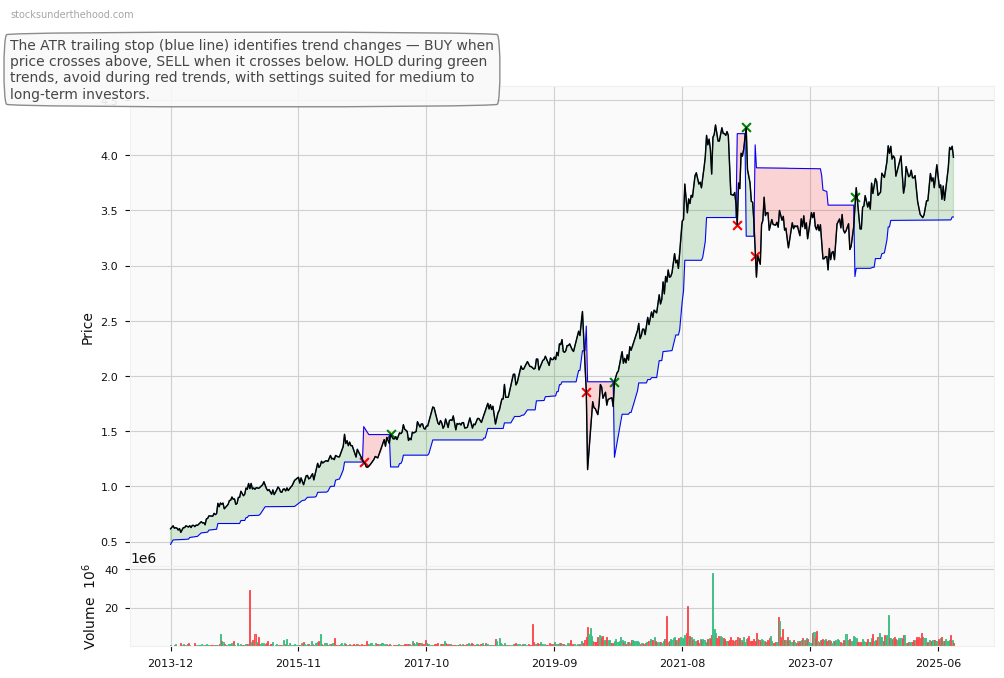
❌
ARB Weekly Price Chart with Average True Range (ATR) Trailing Stop (10-Year View)
Ticker code: AOV
AOV Red Flags & Risk Indicators
⚠️
⚠️ RED FLAGS: 2 identified
- Increasing Shorts
- Falling Earnings
Income Statement
| Revenue 2024 Per Share |
Revenue 2025e Per Share |
Revenue 2026e Per Share |
Revenue 24 to 25e [%] |
Revenue 25e to 26e [%] |
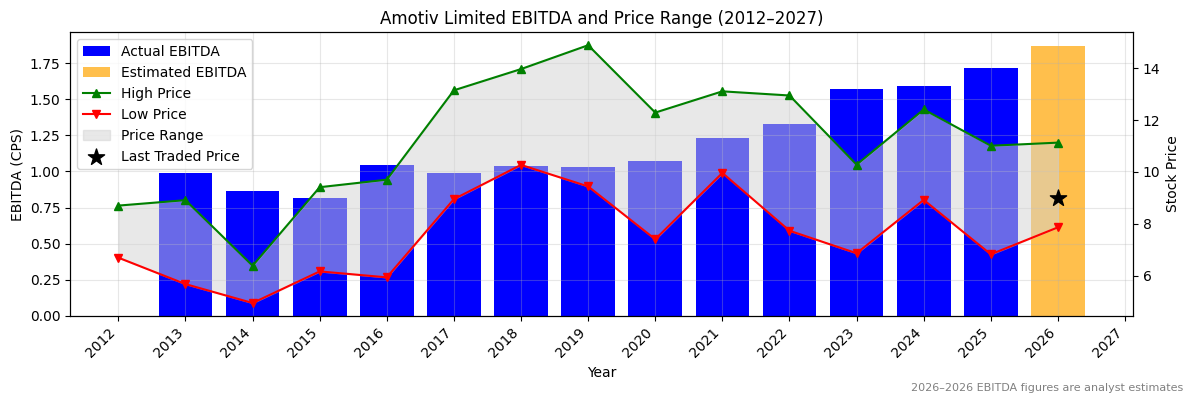
EBITDA 2024 Per Share |
EBITDA 2025e Per Share |
EBITDA 2026e Per Share |
EBITDA 24 to 25e [%] |
EBITDA 25e to 26e [%] |
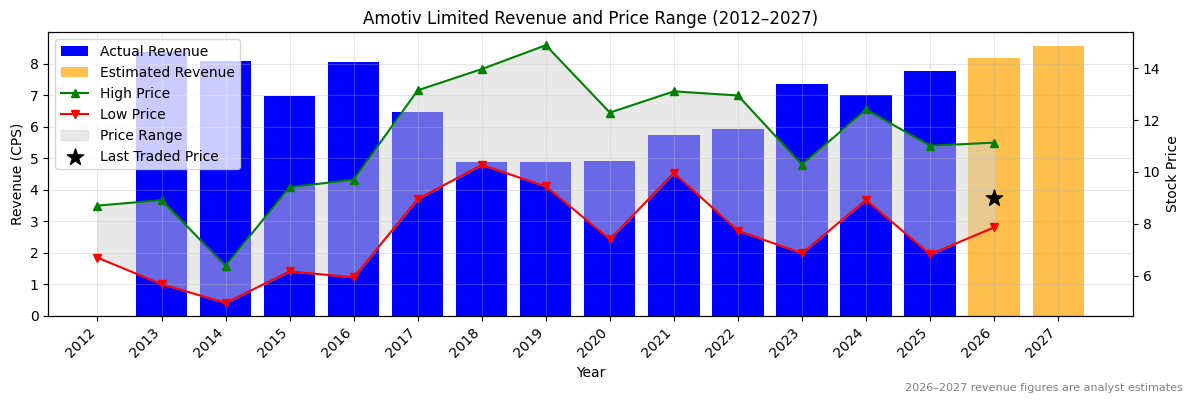
| 7.00644 |
7.75577 |
8.18865 |
10.7 |
5.6 |
1.58828 |
1.7134 |
1.86971 |
7.9 |
9.1 |
AOV Revenue Per Share (2012–2027)
✅
AOV Earnings before Interest, Tax, Depreciation and Amortisation (EBITDA) Per Share (2012–2027)
✅
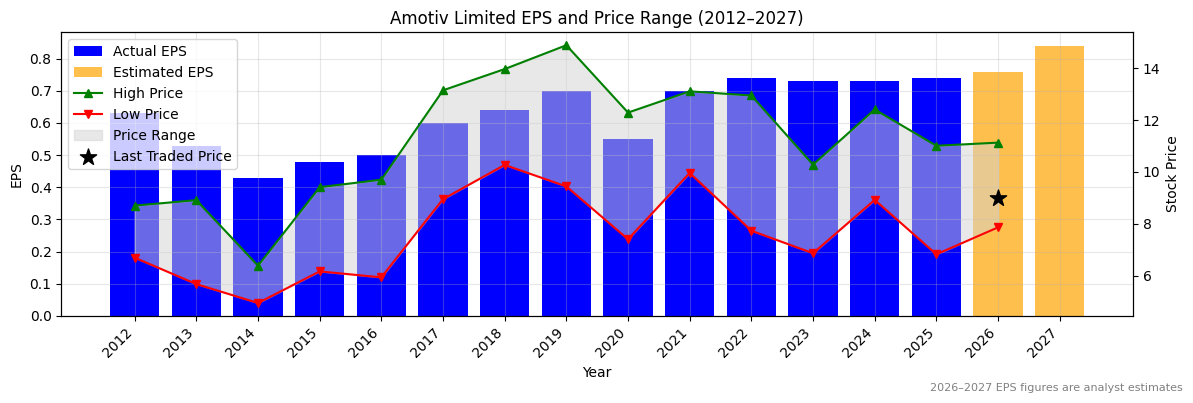
AOV Normalised Earnings Per Share (EPS) (2012–2027)
✅
Valuation
| Price To Sales |
Price To Book |
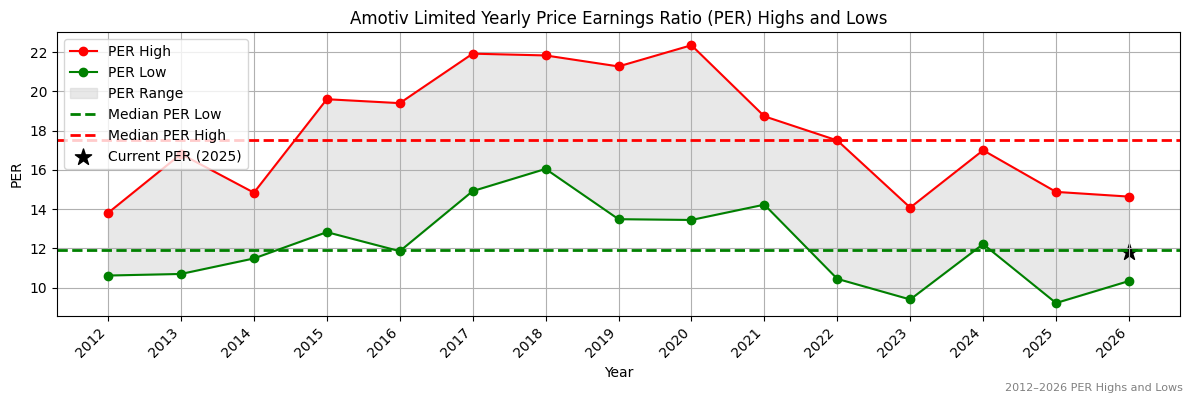
PER 2023 |
PER 2024 |
13Y Median PER Low |
PER 2025e |
13Y Median PER High |
PER 2026e |
Last Updated |
| 1.2 |
1.7 |
12.2 |
12.2 |
11.9 |
12.1 |
17.5 |
11.8 |
16/8/24 |
AOV Yearly Price Earnings Ratio (PER) Highs and Lows
✅
AOV Weekly Price Chart with Average True Range (ATR) Trailing Stop (10-Year View)