Harmoney Corp Limited (ASX:HMY) is a peer-to-peer lending platform offering personal loans in New Zealand and Australia. It provides unsecured consumer finance via an online marketplace.
Ticker code: HMY
Market Information
| Market Capitalisation |
Enterprise Value |
Shares Outstanding |
Free Float [%] |
Free Float Value |
| $82,204,806 |
$865,086,814 |
104056714 |
41.51 |
$34,125,463 |
Balance Sheet & Quality
| Equity |
Cash |
Debt |
Return On Equity (ROE) |
EBITDA 25 Margin [%] |
Net Debt / Equity [%] |
Rule of 40 |
| $34,650,886 |
$52,617,000 |
$835,499,008 |
17.8 |
7.0 |
2259.3 |
31.5 |
Technicals & Short Data
| 3EMA Status |
Volatility [%] |
Value Traded Today |
Average Daily Liquidity |
Short [%] |
Days To Cover |
| Partial |
6.7 |
$149 |
$74,098 |
0.0 |
0.0 |
Dividends
| Previous Dividend |
Last Dividend |
Franking [%] |
Ex-Div Date |
Gross Yield [%] |
| None |
None |
None |
None |
0.0 |
Price Performance Snapshot
| Last Traded Price |
Change [%] |
1 Week [%] |
1 Month [%] |
3 Months [%] |
6 Months [%] |
12 Months [%] |
| $0.790 |
0.6 |
3.3 |
-16.0 |
-1.9 |
32.8 |
116.4 |
HMY Price Chart with Volume and 3EMA
HMY Short Positions
Click HERE to understand why the above moving averages have been chosen.
Ticker code: CAT
CAT Red Flags & Risk Indicators
⚠️
⚠️ RED FLAGS: 1 identified
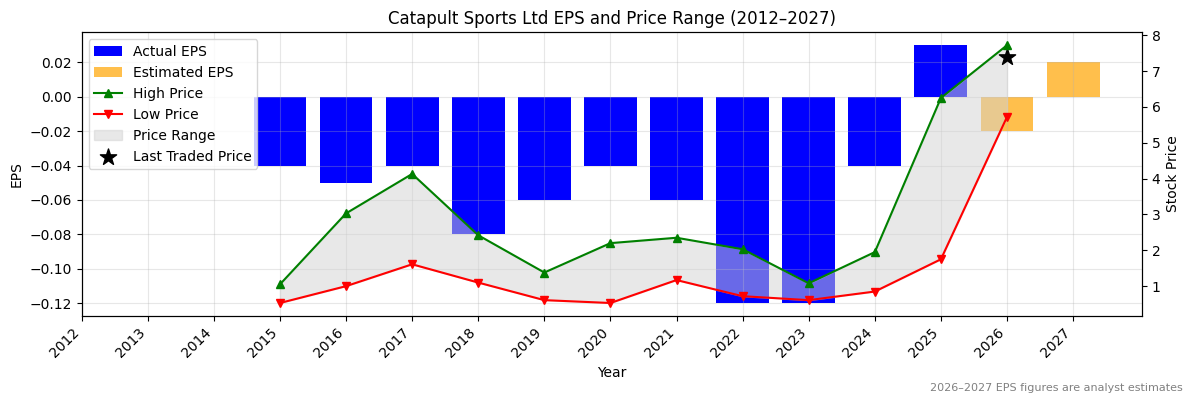
Income Statement
| Revenue 2024 Per Share |
Revenue 2025e Per Share |
Revenue 2026e Per Share |
Revenue 24 to 25e [%] |
Revenue 25e to 26e [%] |
EBITDA 2024 Per Share |
EBITDA 2025e Per Share |
EBITDA 2026e Per Share |
EBITDA 24 to 25e [%] |
EBITDA 25e to 26e [%] |
| 0.5785 |
0.6708 |
0.67942 |
16.0 |
1.3 |
0.05423 |
0.09976 |
0.14059 |
83.9 |
40.9 |
CAT Revenue Per Share (2012–2027)
✅
CAT Earnings before Interest, Tax, Depreciation and Amortisation (EBITDA) Per Share (2012–2027)
✅✅
CAT Normalised Earnings Per Share (EPS) (2012–2027)
✅✅
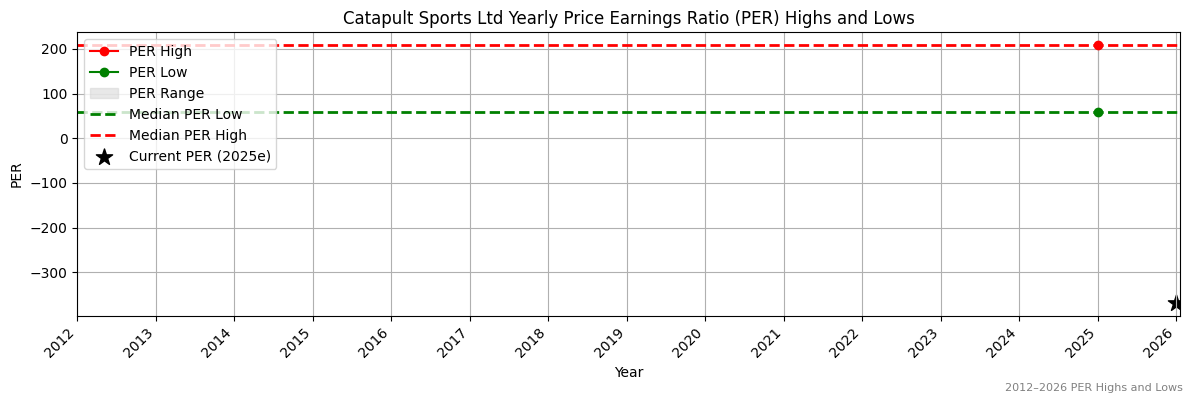
Valuation
| Price To Sales |
Price To Book |
PER 2023 |
PER 2024 |
13Y Median PER Low |
PER 2025e |
13Y Median PER High |
PER 2026e |
Last Updated |
| 17.5 |
21.6 |
-56.0 |
-168.0 |
58.3 |
224.0 |
208.3 |
-336.0 |
4/10/25 |
CAT Yearly Price Earnings Ratio (PER) Highs and Lows
❌
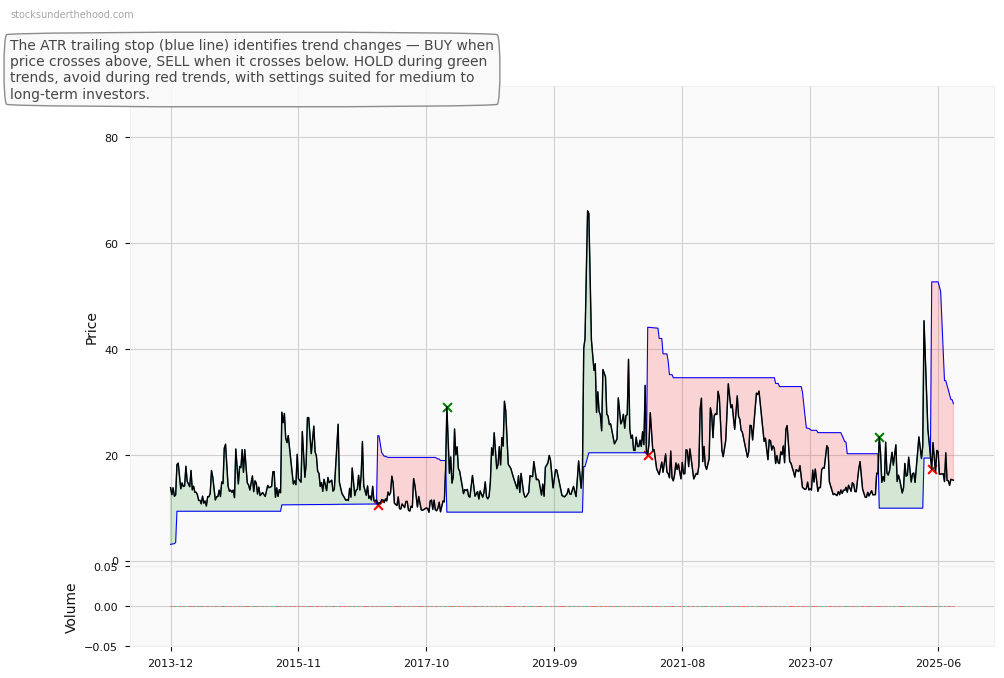
CAT Weekly Price Chart with Average True Range (ATR) Trailing Stop (10-Year View)
Catapult Group International Ltd provides performance analytics and wearable technology solutions for sports teams and athletes, enhancing performance and reducing injury risks.
Ticker code: CAT
Market Information
| Market Capitalisation |
Enterprise Value |
Shares Outstanding |
Free Float [%] |
Free Float Value |
| $1,639,075,297 |
$1,633,544,297 |
305228181 |
76.22 |
$1,249,283,298 |
Balance Sheet & Quality
| Equity |
Cash |
Debt |
Return On Equity (ROE) |
EBITDA 25 Margin [%] |
Net Debt / Equity [%] |
Rule of 40 |
| $119,954,674 |
$11,272,000 |
$5,741,000 |
6.8 |
14.9 |
-4.6 |
25.3 |
Technicals & Short Data
| 3EMA Status |
Volatility [%] |
Value Traded Today |
Average Daily Liquidity |
Short [%] |
Days To Cover |
| Negative |
16.0 |
$11,009,107 |
$12,084,352 |
None |
0.0 |
Dividends
| Previous Dividend |
Last Dividend |
Franking [%] |
Ex-Div Date |
Gross Yield [%] |
| None |
None |
None |
None |
0.0 |
Price Performance Snapshot
| Last Traded Price |
Change [%] |
1 Week [%] |
1 Month [%] |
3 Months [%] |
6 Months [%] |
12 Months [%] |
| $5.370 |
0.2 |
15.0 |
-20.1 |
-10.4 |
-7.6 |
44.7 |
CAT Price Chart with Volume and 3EMA
CAT Short Positions
Click HERE to understand why the above moving averages have been chosen.
Ticker code: KOV
KOV Red Flags & Risk Indicators
⚠️
⚠️ RED FLAGS: 2 identified
- Zero Revenue
- High Relative Valuation
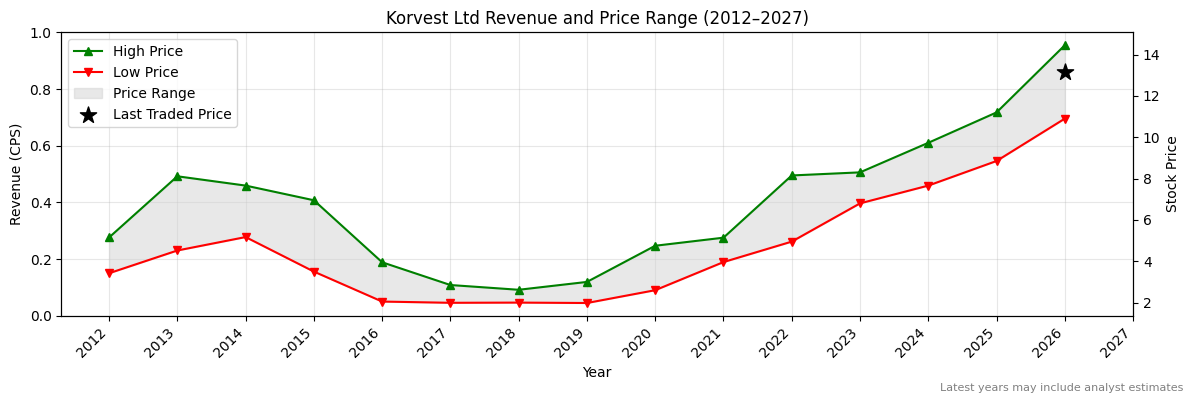
Income Statement
| Revenue 2024 Per Share |
Revenue 2025e Per Share |
Revenue 2026e Per Share |
Revenue 24 to 25e [%] |
Revenue 25e to 26e [%] |
EBITDA 2024 Per Share |
EBITDA 2025e Per Share |
EBITDA 2026e Per Share |
EBITDA 24 to 25e [%] |
EBITDA 25e to 26e [%] |
| None |
None |
None |
None |
None |
None |
1.87881 |
1.74095 |
None |
-7.3 |
KOV Revenue Per Share (2012–2027)
KOV Earnings before Interest, Tax, Depreciation and Amortisation (EBITDA) Per Share (2012–2027)
KOV Normalised Earnings Per Share (EPS) (2012–2027)
✅✅
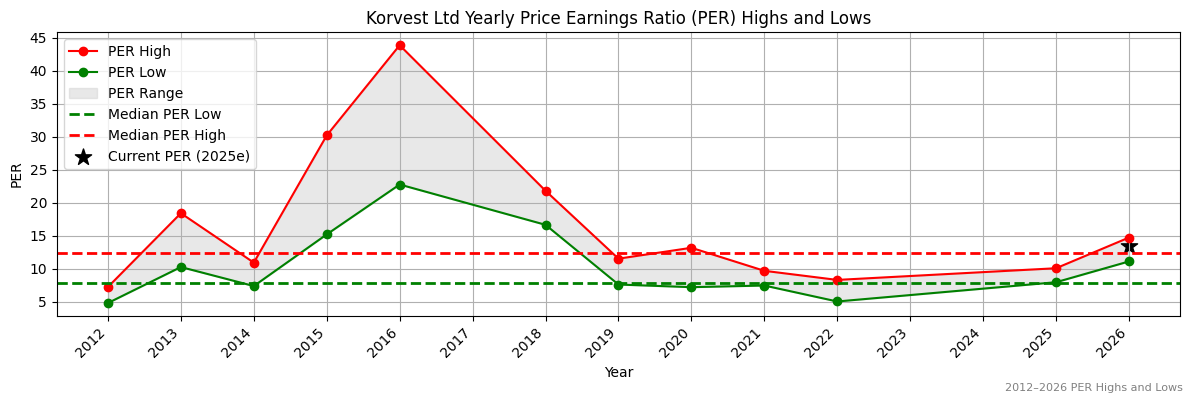
Valuation
| Price To Sales |
Price To Book |
PER 2023 |
PER 2024 |
13Y Median PER Low |
PER 2025e |
13Y Median PER High |
PER 2026e |
Last Updated |
| 1.3 |
2.5 |
None |
None |
7.8 |
11.9 |
12.4 |
13.4 |
28/9/25 |
KOV Yearly Price Earnings Ratio (PER) Highs and Lows
✅
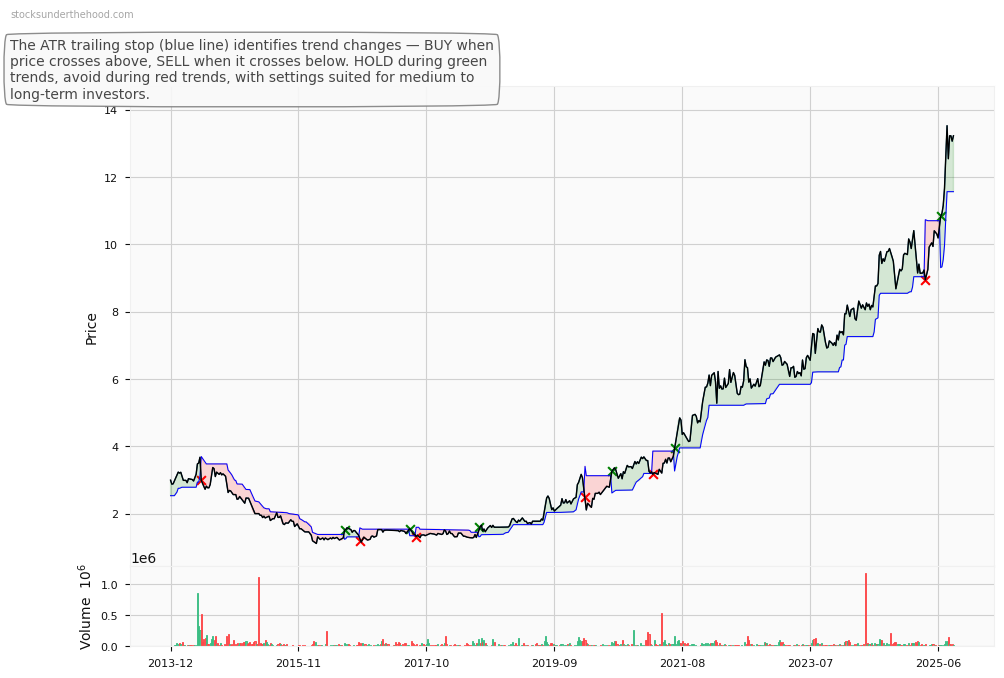
KOV Weekly Price Chart with Average True Range (ATR) Trailing Stop (10-Year View)
Korvest Ltd (ASX:KOV) manufactures galvanized steel, sheet metal, and cable/pipe support systems in Australia. Its EzyStrut brand serves infrastructure, mining, and utilities sectors.
Ticker code: KOV
Market Information
| Market Capitalisation |
Enterprise Value |
Shares Outstanding |
Free Float [%] |
Free Float Value |
| $161,988,125 |
$158,565,125 |
11832588 |
80.06 |
$129,682,176 |
Balance Sheet & Quality
| Equity |
Cash |
Debt |
Return On Equity (ROE) |
EBITDA 25 Margin [%] |
Net Debt / Equity [%] |
Rule of 40 |
| $61,198,145 |
$13,305,000 |
$9,882,000 |
21.4 |
None |
-5.6 |
None |
Technicals & Short Data
| 3EMA Status |
Volatility [%] |
Value Traded Today |
Average Daily Liquidity |
Short [%] |
Days To Cover |
| Positive |
2.6 |
$113,901 |
$80,607 |
0.0 |
0.0 |
Dividends
| Previous Dividend |
Last Dividend |
Franking [%] |
Ex-Div Date |
Gross Yield [%] |
| $0.250 |
$0.500 |
None |
2025-08-14 |
3.7 |
Price Performance Snapshot
| Last Traded Price |
Change [%] |
1 Week [%] |
1 Month [%] |
3 Months [%] |
6 Months [%] |
12 Months [%] |
| $13.690 |
0.5 |
-0.4 |
4.7 |
4.0 |
32.6 |
47.6 |
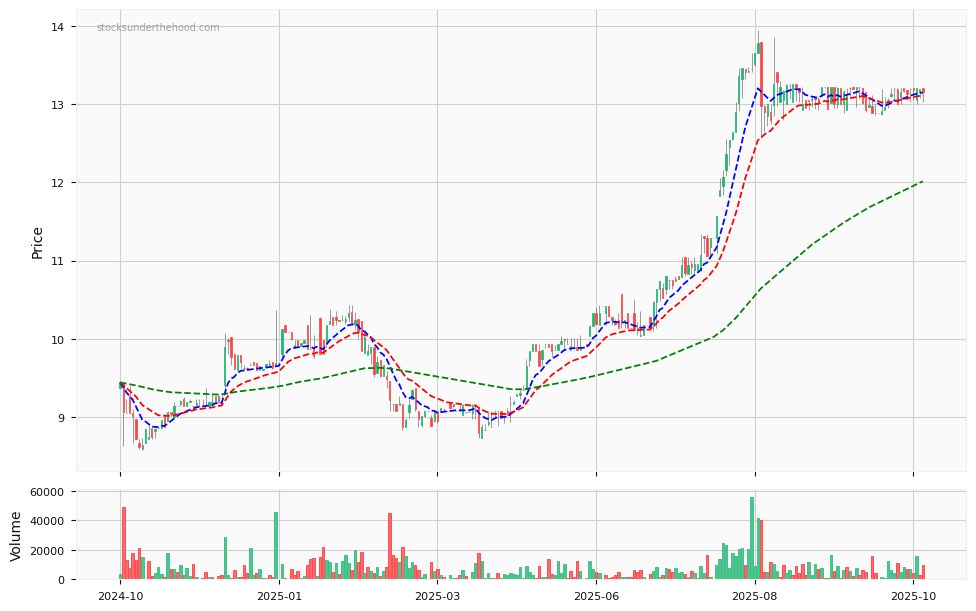
KOV Price Chart with Volume and 3EMA
KOV Short Positions
Click HERE to understand why the above moving averages have been chosen.
Ticker code: None
None Red Flags & Risk Indicators
⚠️
⚠️ RED FLAGS: 2 identified
- Zero Revenue
- High Price to Book vs ROE
Income Statement
| Revenue 2024 Per Share |
Revenue 2025e Per Share |
Revenue 2026e Per Share |
Revenue 24 to 25e [%] |
Revenue 25e to 26e [%] |
EBITDA 2024 Per Share |
EBITDA 2025e Per Share |
EBITDA 2026e Per Share |
EBITDA 24 to 25e [%] |
EBITDA 25e to 26e [%] |
| None |
None |
None |
None |
None |
None |
1.87881 |
0.05612 |
None |
-97.0 |
None Revenue Per Share (2012–2027)
None Earnings before Interest, Tax, Depreciation and Amortisation (EBITDA) Per Share (2012–2027)
None Normalised Earnings Per Share (EPS) (2012–2027)
✅✅
Valuation
| Price To Sales |
Price To Book |
PER 2023 |
PER 2024 |
13Y Median PER Low |
PER 2025e |
13Y Median PER High |
PER 2026e |
Last Updated |
| 49.4 |
None |
None |
None |
7.6 |
None |
11.5 |
None |
5/8/25 |
None Yearly Price Earnings Ratio (PER) Highs and Lows
None Weekly Price Chart with Average True Range (ATR) Trailing Stop (10-Year View)
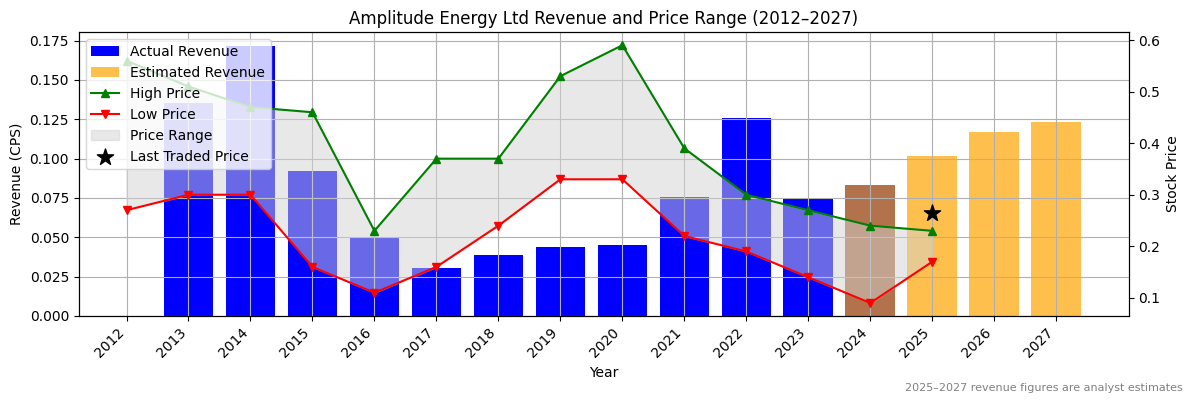
Ticker code: ASX:AEL
ASX:AEL Red Flags & Risk Indicators
⚠️
⚠️ RED FLAGS: 2 identified
- Low Operating Margin
- Increasing Shorts
Income Statement
| Revenue 2024 Per Share |
Revenue 2025e Per Share |
Revenue 2026e Per Share |
Revenue 24 to 25e [%] |
Revenue 25e to 26e [%] |
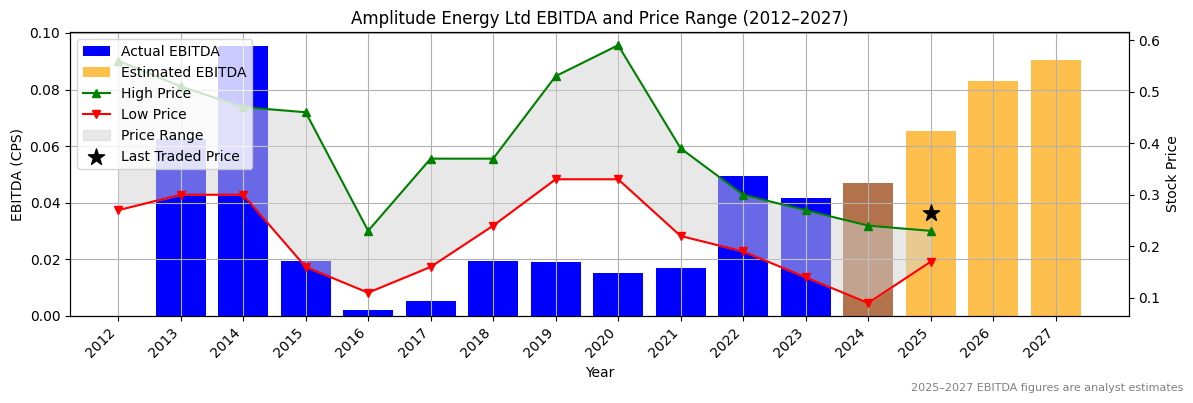
EBITDA 2024 Per Share |
EBITDA 2025e Per Share |
EBITDA 2026e Per Share |
EBITDA 24 to 25e [%] |
EBITDA 25e to 26e [%] |
| 0.08299 |
0.1014 |
0.11733 |
22.2 |
15.7 |
0.04689 |
0.06689 |
0.08386 |
42.6 |
25.4 |
ASX:AEL Revenue Per Share (2012–2027)
✅✅
ASX:AEL Earnings before Interest, Tax, Depreciation and Amortisation (EBITDA) Per Share (2012–2027)
✅✅
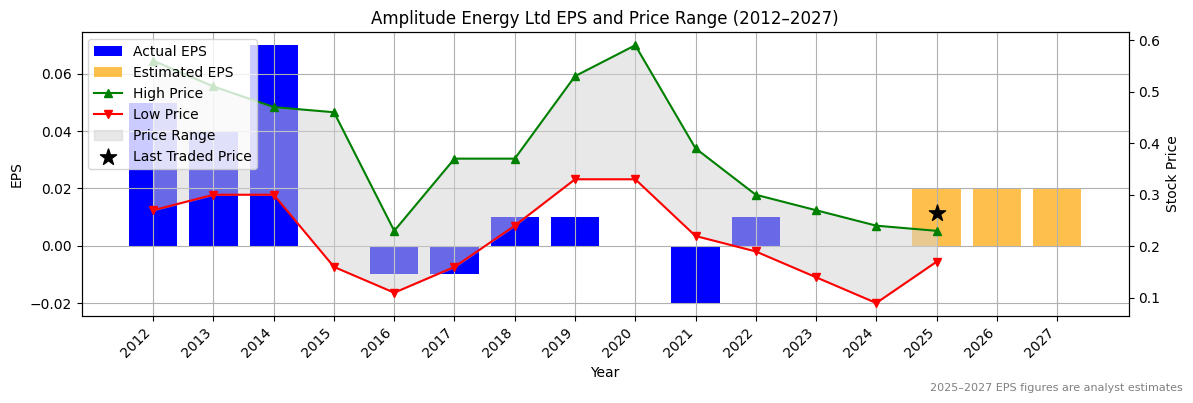
ASX:AEL Normalised Earnings Per Share (EPS) (2012–2027)
✅✅
Valuation
| Price To Sales |
Price To Book |
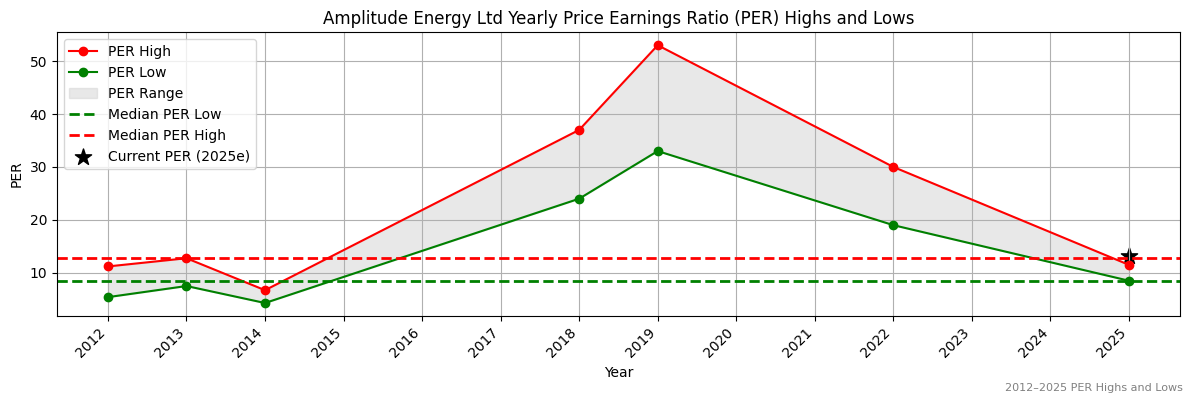
PER 2023 |
PER 2024 |
13Y Median PER Low |
PER 2025e |
13Y Median PER High |
PER 2026e |
Last Updated |
| 2.7 |
1.6 |
None |
None |
8.5 |
12.5 |
12.8 |
12.5 |
18/7/25 |
ASX:AEL Yearly Price Earnings Ratio (PER) Highs and Lows
✅
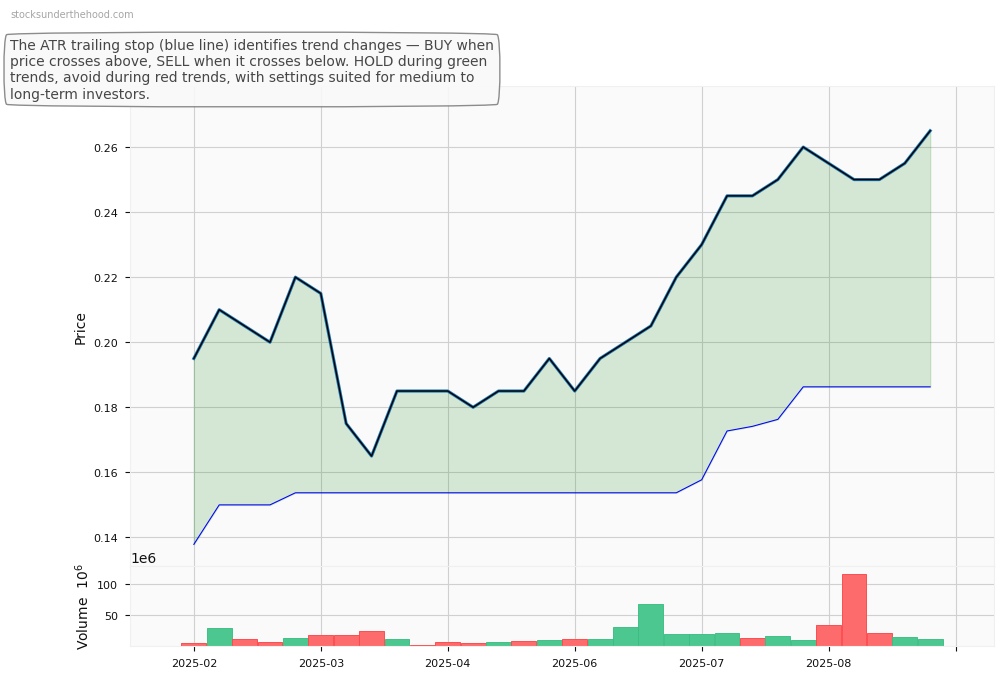
ASX:AEL Weekly Price Chart with Average True Range (ATR) Trailing Stop (10-Year View)
None
Ticker code: None
Market Information
| Market Capitalisation |
Enterprise Value |
Shares Outstanding |
Free Float [%] |
Free Float Value |
| $94,400 |
$7,130,822 |
367049984 |
53.34 |
$50,357 |
Balance Sheet & Quality
| Equity |
Cash |
Debt |
Return On Equity (ROE) |
EBITDA 24 Margin [%] |
Net Debt / Equity [%] |
Rule of 40 |
| None |
$93,351 |
$4,287,773 |
0.0 |
None |
0.0 |
None |
Technicals & Short Data
| 3EMA Status |
Volatility [%] |
Value Traded Today |
Average Daily Liquidity |
Short [%] |
Days To Cover |
| None |
None |
None |
None |
None |
0.0 |
Dividends
| Previous Dividend |
Last Dividend |
Franking [%] |
Ex-Div Date |
Gross Yield [%] |
| $0.400 |
$0.250 |
None |
2025-02-13 |
0.0 |
Price Performance Snapshot
| Last Traded Price |
Change [%] |
1 Week [%] |
1 Month [%] |
3 Months [%] |
6 Months [%] |
12 Months [%] |
| None |
None |
None |
None |
None |
None |
None |
None Price Chart with Volume and 3EMA
None Short Positions
Click HERE to understand why the above moving averages have been chosen.
Ticker code: CAF
CAF Red Flags & Risk Indicators
❌
⚠️ RED FLAGS: 3 identified
- Low Operating Margin
- Falling Earnings
- High Relative Valuation
Income Statement
| Revenue 2024 Per Share |
Revenue 2025e Per Share |
Revenue 2026e Per Share |
Revenue 24 to 25e [%] |
Revenue 25e to 26e [%] |
EBITDA 2024 Per Share |
EBITDA 2025e Per Share |
EBITDA 2026e Per Share |
EBITDA 24 to 25e [%] |
EBITDA 25e to 26e [%] |
| 1.45017 |
None |
None |
None |
None |
0.03877 |
None |
None |
None |
None |
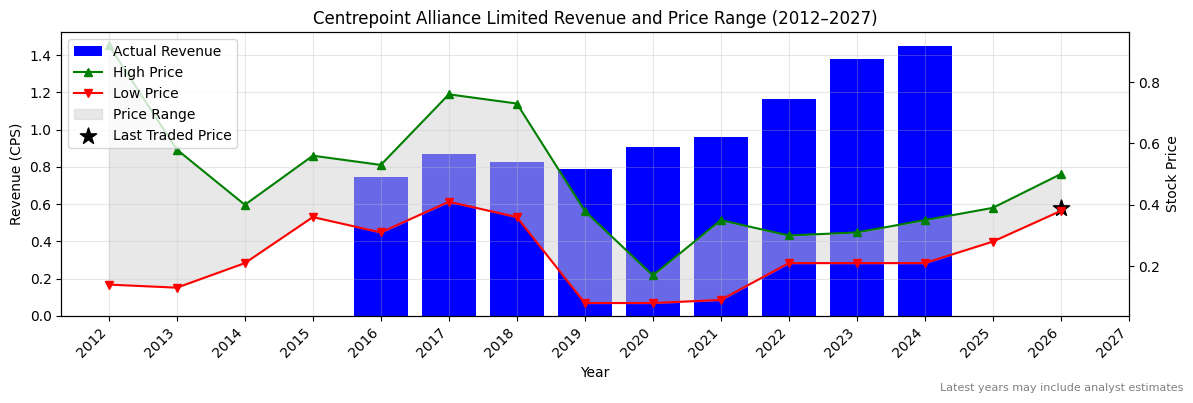
CAF Revenue Per Share (2012–2027)
CAF Earnings before Interest, Tax, Depreciation and Amortisation (EBITDA) Per Share (2012–2027)
CAF Normalised Earnings Per Share (EPS) (2012–2027)
Valuation
| Price To Sales |
Price To Book |
PER 2023 |
PER 2024 |
13Y Median PER Low |
PER 2025e |
13Y Median PER High |
PER 2026e |
Last Updated |
| 0.2 |
2.3 |
13.0 |
9.7 |
7.4 |
None |
11.8 |
None |
8/9/25 |
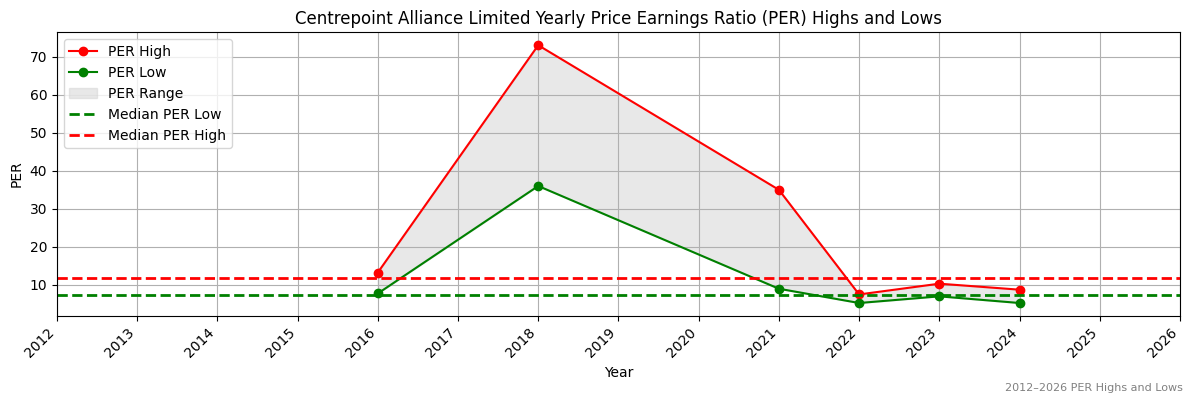
CAF Yearly Price Earnings Ratio (PER) Highs and Lows
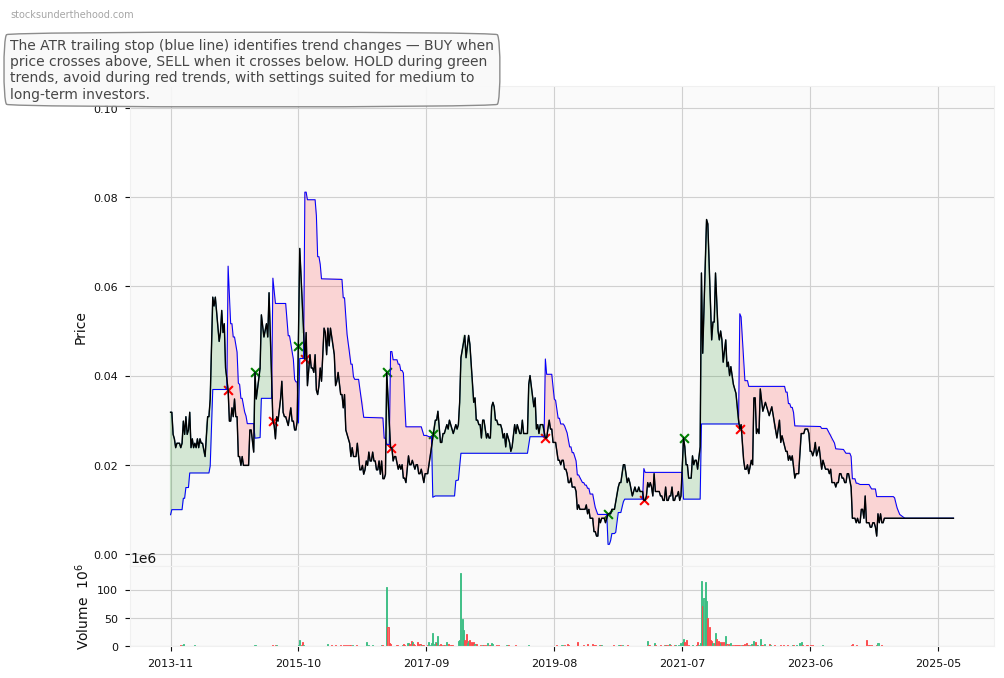
CAF Weekly Price Chart with Average True Range (ATR) Trailing Stop (10-Year View)
Centrepoint Alliance Limited (ASX:CAF) offers licensing, advice support, and funds management to financial advisers and clients in Australia. It serves through segments for mortgage broking, financial planning, and consulting for self-licensed advisers.
Ticker code: CAF
Market Information
| Market Capitalisation |
Enterprise Value |
Shares Outstanding |
Free Float [%] |
Free Float Value |
| $73,874,372 |
$65,491,372 |
205206580.0 |
54.52 |
$40,277,880 |
Balance Sheet & Quality
| Equity |
Cash |
Debt |
Return On Equity (ROE) |
EBITDA 25 Margin [%] |
Net Debt / Equity [%] |
Rule of 40 |
| $34,679,914 |
$13,741,000 |
$5,358,000 |
0.0 |
None |
-24.2 |
None |
Technicals & Short Data
| 3EMA Status |
Volatility [%] |
Value Traded Today |
Average Daily Liquidity |
Short [%] |
Days To Cover |
| Negative |
4.5 |
$13,065 |
$31,277 |
None |
0.0 |
Dividends
| Previous Dividend |
Last Dividend |
Franking [%] |
Ex-Div Date |
Gross Yield [%] |
| $0.013 |
$0.018 |
None |
2025-09-18 |
0.0 |
Price Performance Snapshot
| Last Traded Price |
Change [%] |
1 Week [%] |
1 Month [%] |
3 Months [%] |
6 Months [%] |
12 Months [%] |
| $0.360 |
1.4 |
None |
-7.7 |
-22.8 |
4.0 |
25.4 |
CAF Price Chart with Volume and 3EMA
CAF Short Positions
No chart available for this company.
Click HERE to understand why the above moving averages have been chosen.
Ticker code: MTM
MTM Red Flags & Risk Indicators
✅
⚠️ RED FLAGS: 0 identified
No red flags detected.
Income Statement
| Revenue 2024 Per Share |
Revenue 2025e Per Share |
Revenue 2026e Per Share |
Revenue 24 to 25e [%] |
Revenue 25e to 26e [%] |
EBITDA 2024 Per Share |
EBITDA 2025e Per Share |
EBITDA 2026e Per Share |
EBITDA 24 to 25e [%] |
EBITDA 25e to 26e [%] |
| None |
None |
None |
None |
None |
None |
None |
None |
None |
None |
MTM Revenue Per Share (2012–2027)
MTM Earnings before Interest, Tax, Depreciation and Amortisation (EBITDA) Per Share (2012–2027)
MTM Normalised Earnings Per Share (EPS) (2012–2027)
Valuation
| Price To Sales |
Price To Book |
PER 2023 |
PER 2024 |
13Y Median PER Low |
PER 2025e |
13Y Median PER High |
PER 2026e |
Last Updated |
| 5146.8 |
15.0 |
None |
None |
None |
None |
None |
None |
None |
MTM Yearly Price Earnings Ratio (PER) Highs and Lows
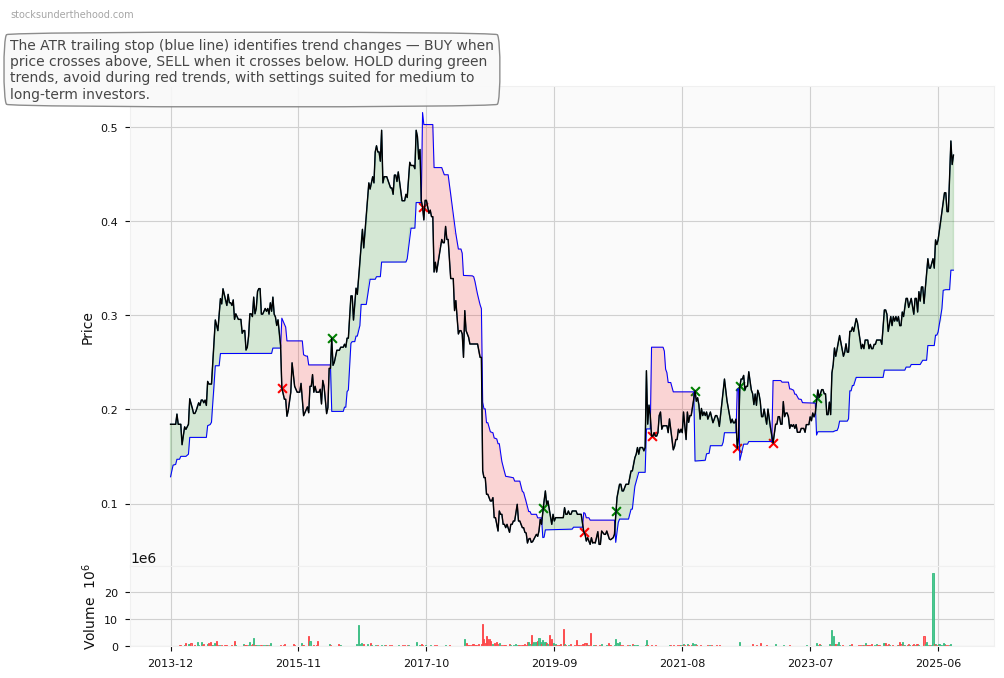
MTM Weekly Price Chart with Average True Range (ATR) Trailing Stop (10-Year View)
Ticker code: ^VIX
^VIX Red Flags & Risk Indicators
✅
⚠️ RED FLAGS: 0 identified
No red flags detected.
Income Statement
| Revenue 2024 Per Share |
Revenue 2025e Per Share |
Revenue 2026e Per Share |
Revenue 24 to 25e [%] |
Revenue 25e to 26e [%] |
EBITDA 2024 Per Share |
EBITDA 2025e Per Share |
EBITDA 2026e Per Share |
EBITDA 24 to 25e [%] |
EBITDA 25e to 26e [%] |
| None |
None |
None |
None |
None |
None |
None |
None |
None |
None |
^VIX Revenue Per Share (2012–2027)
^VIX Earnings before Interest, Tax, Depreciation and Amortisation (EBITDA) Per Share (2012–2027)
^VIX Normalised Earnings Per Share (EPS) (2012–2027)
Valuation
| Price To Sales |
Price To Book |
PER 2023 |
PER 2024 |
13Y Median PER Low |
PER 2025e |
13Y Median PER High |
PER 2026e |
Last Updated |
| None |
None |
None |
None |
None |
None |
None |
None |
None |
^VIX Yearly Price Earnings Ratio (PER) Highs and Lows
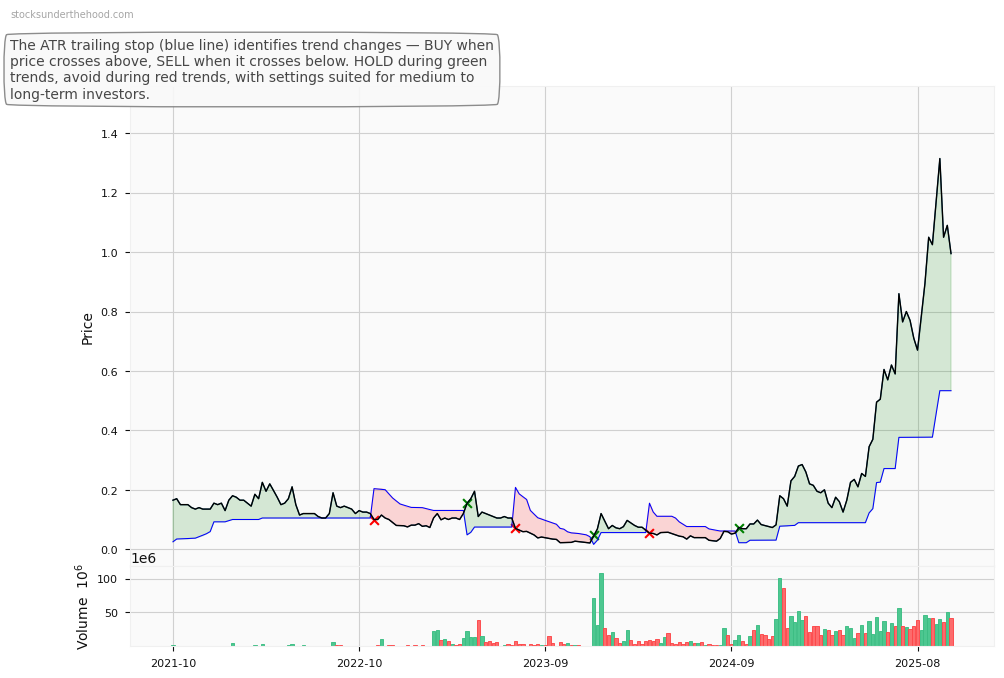
^VIX Weekly Price Chart with Average True Range (ATR) Trailing Stop (10-Year View)
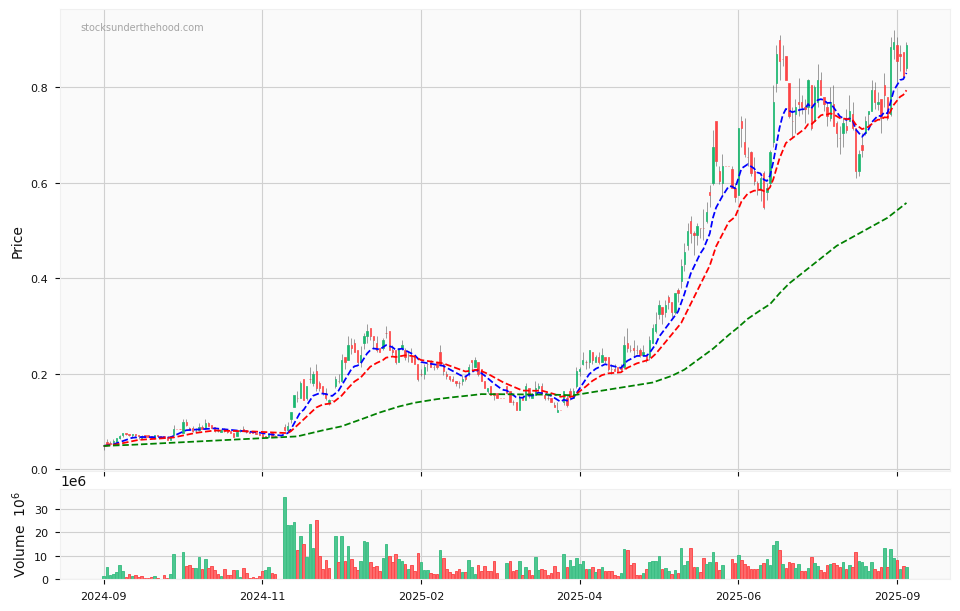
MTM Critical Metals Limited (ASX:MTM) is an Australian exploration company focusing on niobium and rare earth elements in Western Australia and Quebec. The company is also developing innovative technologies to enhance metal recovery from ores and waste materials.
Ticker code: MTM
Market Information
| Market Capitalisation |
Enterprise Value |
Shares Outstanding |
Free Float [%] |
Free Float Value |
| $636,429,888 |
$623,630,912 |
623950905.0 |
88.57 |
$563,688,388 |
Balance Sheet & Quality
| Equity |
Cash |
Debt |
Return On Equity (ROE) |
EBITDA 25 Margin [%] |
Net Debt / Equity [%] |
Rule of 40 |
| $34,941,251 |
$7,342,545 |
$5,972,443 |
None |
None |
-3.9 |
None |
Technicals & Short Data
| 3EMA Status |
Volatility [%] |
Value Traded Today |
Average Daily Liquidity |
Short [%] |
Days To Cover |
| Positive |
16.3 |
$8,722,333 |
$8,103,068 |
None |
0.0 |
Dividends
| Previous Dividend |
Last Dividend |
Franking [%] |
Ex-Div Date |
Gross Yield [%] |
| None |
None |
None |
None |
None |
Price Performance Snapshot
| Last Traded Price |
Change [%] |
1 Week [%] |
1 Month [%] |
3 Months [%] |
6 Months [%] |
12 Months [%] |
| $1.020 |
7.4 |
48.9 |
21.4 |
38.8 |
140.0 |
580.0 |
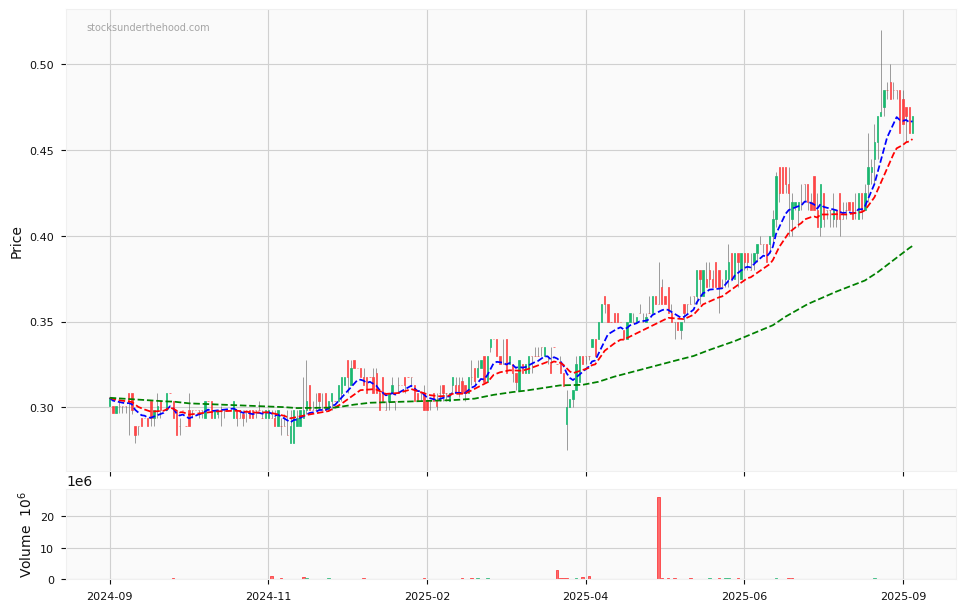
MTM Price Chart with Volume and 3EMA
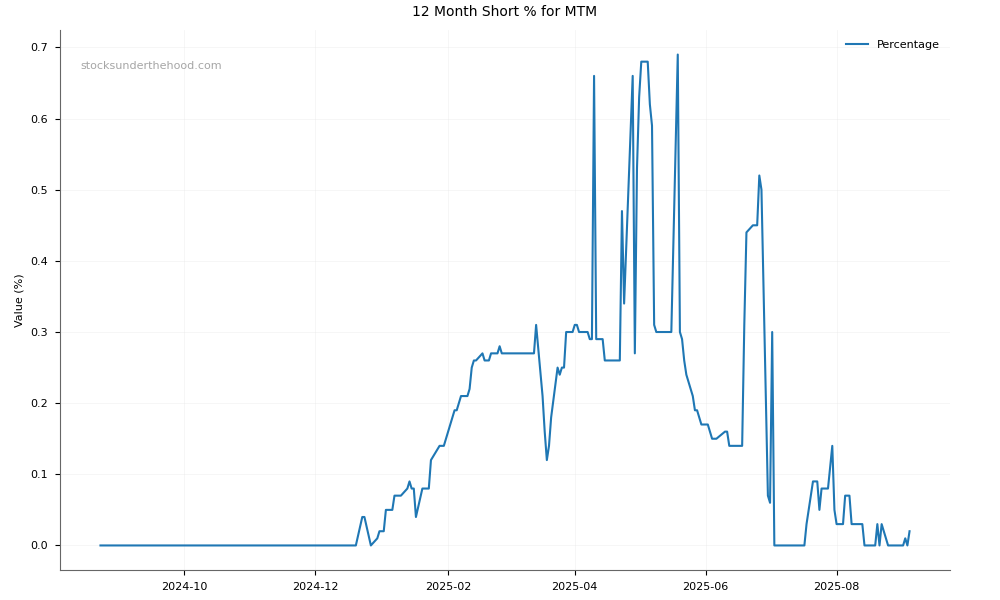
MTM Short Positions
Click HERE to understand why the above moving averages have been chosen.
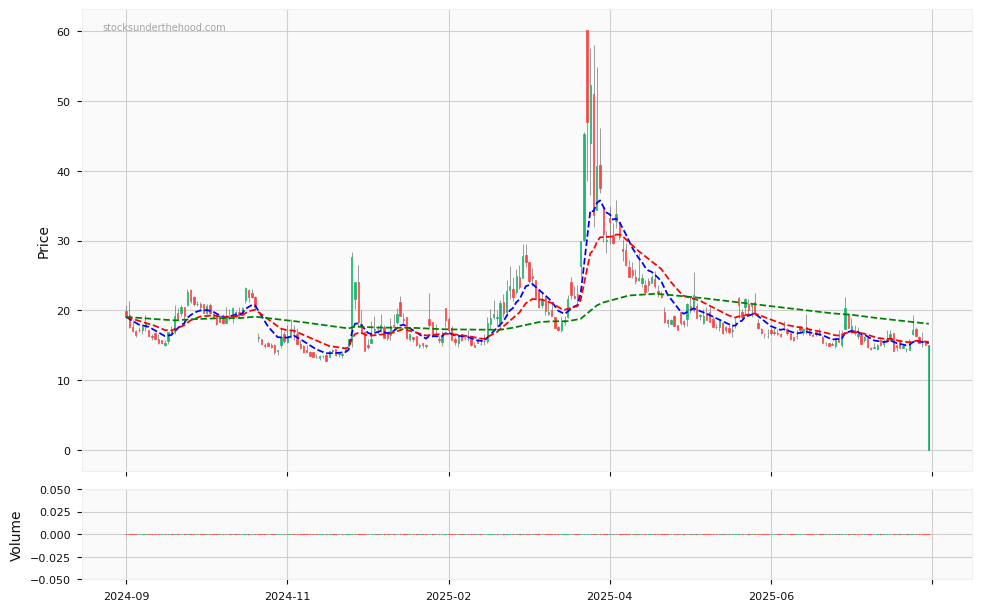
CBOE Volatility Index measures the stock market’s expectation of volatility based on S&P 500 index options.
Ticker code: ^VIX
Sector: Volatility | Industry: Index | Website: N/A
Market Information
| Market Capitalisation |
Enterprise Value |
Shares Outstanding |
Free Float [%] |
Free Float Value |
| None |
None |
None |
0.0 |
None |
Balance Sheet & Quality
| Equity |
Cash |
Debt |
Return On Equity (ROE) |
EBITDA 25 Margin [%] |
Net Debt / Equity [%] |
Rule of 40 |
| None |
None |
None |
None |
None |
0.0 |
None |
Technicals & Short Data
| 3EMA Status |
Volatility [%] |
Value Traded Today |
Average Daily Liquidity |
Short [%] |
Days To Cover |
| None |
None |
$0 |
$0 |
None |
0.0 |
Dividends
| Previous Dividend |
Last Dividend |
Franking [%] |
Ex-Div Date |
Gross Yield [%] |
| None |
None |
None |
None |
None |
Price Performance Snapshot
| Last Traded Price |
Change [%] |
1 Week [%] |
1 Month [%] |
3 Months [%] |
6 Months [%] |
12 Months [%] |
| $26.420 |
11.7 |
33.2 |
42.0 |
77.0 |
5.0 |
29.8 |
^VIX Price Chart with Volume and 3EMA
^VIX Short Positions
No chart available for this company.
Click HERE to understand why the above moving averages have been chosen.
Ticker code: KYP
KYP Red Flags & Risk Indicators
⚠️
⚠️ RED FLAGS: 1 identified
- High Price to Book vs ROE
Income Statement
| Revenue 2024 Per Share |
Revenue 2025e Per Share |
Revenue 2026e Per Share |
Revenue 24 to 25e [%] |
Revenue 25e to 26e [%] |
EBITDA 2024 Per Share |
EBITDA 2025e Per Share |
EBITDA 2026e Per Share |
EBITDA 24 to 25e [%] |
EBITDA 25e to 26e [%] |
| 0.06952 |
0.07676 |
0.08672 |
10.4 |
13.0 |
0.00874 |
0.01039 |
0.01524 |
18.9 |
46.7 |
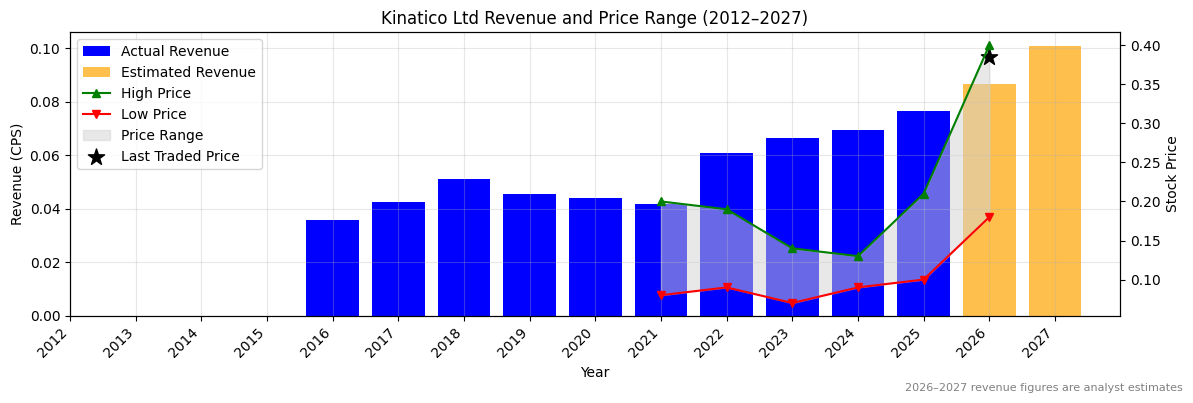
KYP Revenue Per Share (2012–2027)
✅
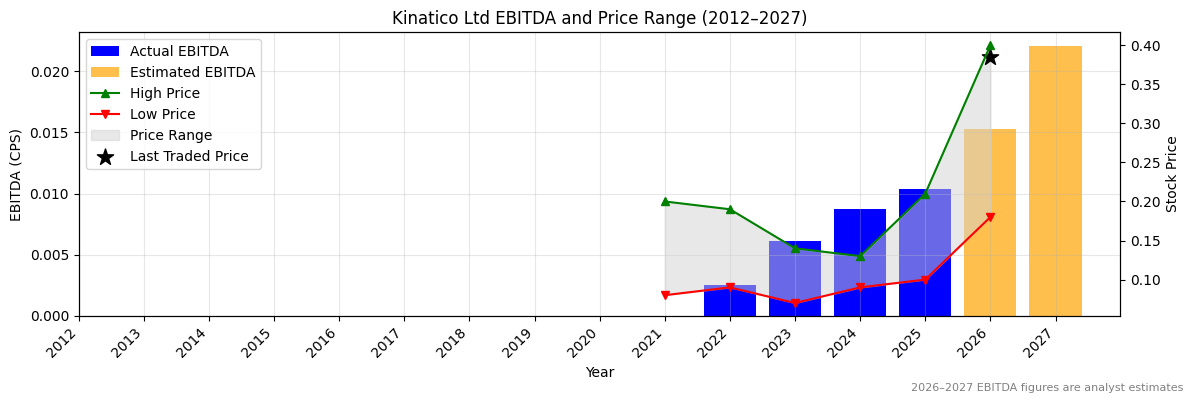
KYP Earnings before Interest, Tax, Depreciation and Amortisation (EBITDA) Per Share (2012–2027)
✅
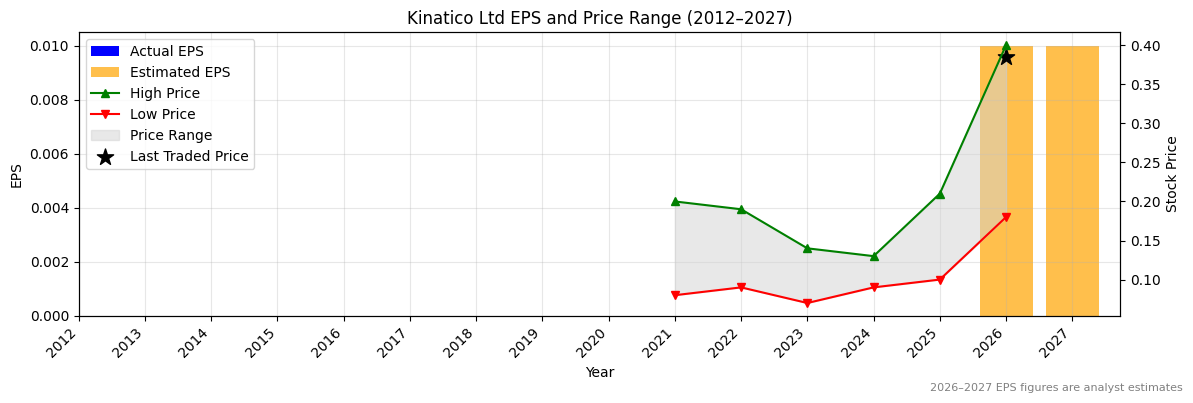
KYP Normalised Earnings Per Share (EPS) (2012–2027)
Valuation
| Price To Sales |
Price To Book |
PER 2023 |
PER 2024 |
13Y Median PER Low |
PER 2025e |
13Y Median PER High |
PER 2026e |
Last Updated |
| 4.6 |
5.6 |
None |
None |
18.0 |
None |
41.5 |
35.5 |
11/10/25 |
KYP Yearly Price Earnings Ratio (PER) Highs and Lows
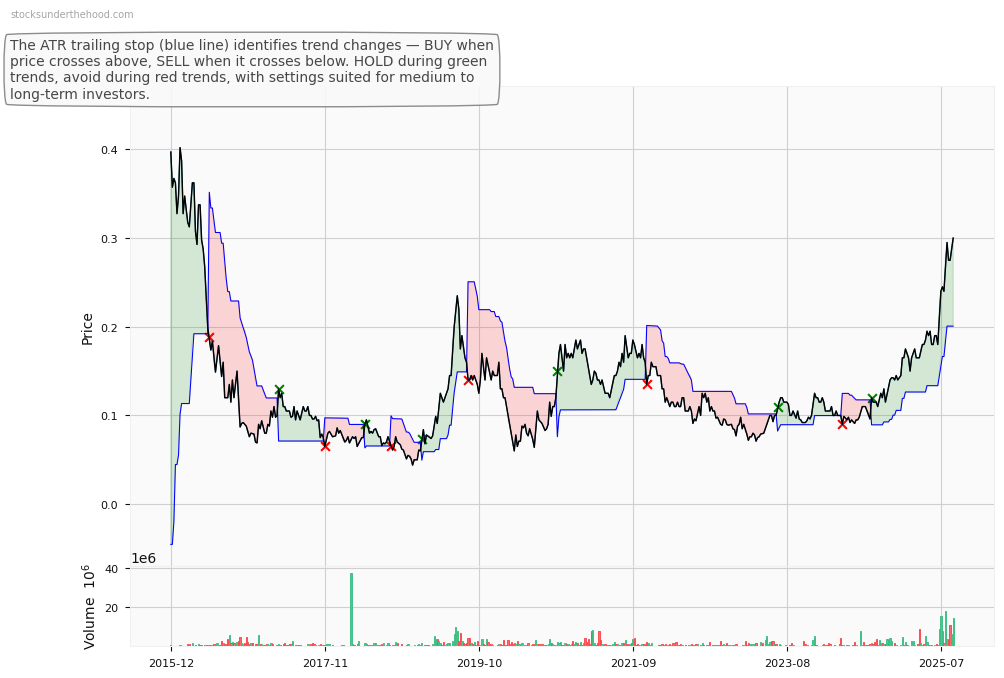
KYP Weekly Price Chart with Average True Range (ATR) Trailing Stop (10-Year View)
Kinatico Ltd (ASX:KYP) provides screening, verification, and SaaS-based workforce compliance solutions in Australia and New Zealand. Its software, including CVCheck and Cited, enables real-time compliance monitoring for employers across various industries.
Ticker code: KYP
Market Information
| Market Capitalisation |
Enterprise Value |
Shares Outstanding |
Free Float [%] |
Free Float Value |
| $125,306,672 |
$115,799,955 |
432091984.0 |
74.12 |
$92,879,811 |
Balance Sheet & Quality
| Equity |
Cash |
Debt |
Return On Equity (ROE) |
EBITDA 25 Margin [%] |
Net Debt / Equity [%] |
Rule of 40 |
| $27,221,798 |
$10,218,007 |
$711,290 |
0.0 |
13.5 |
-34.9 |
23.0 |
Technicals & Short Data
| 3EMA Status |
Volatility [%] |
Value Traded Today |
Average Daily Liquidity |
Short [%] |
Days To Cover |
| Partial |
11.1 |
$28,330 |
$362,198 |
None |
0.0 |
Dividends
| Previous Dividend |
Last Dividend |
Franking [%] |
Ex-Div Date |
Gross Yield [%] |
| None |
None |
None |
None |
0.0 |
Price Performance Snapshot
| Last Traded Price |
Change [%] |
1 Week [%] |
1 Month [%] |
3 Months [%] |
6 Months [%] |
12 Months [%] |
| $0.290 |
None |
-4.9 |
-18.3 |
3.6 |
56.8 |
96.6 |
KYP Price Chart with Volume and 3EMA
KYP Short Positions
No chart available for this company.
Click HERE to understand why the above moving averages have been chosen.
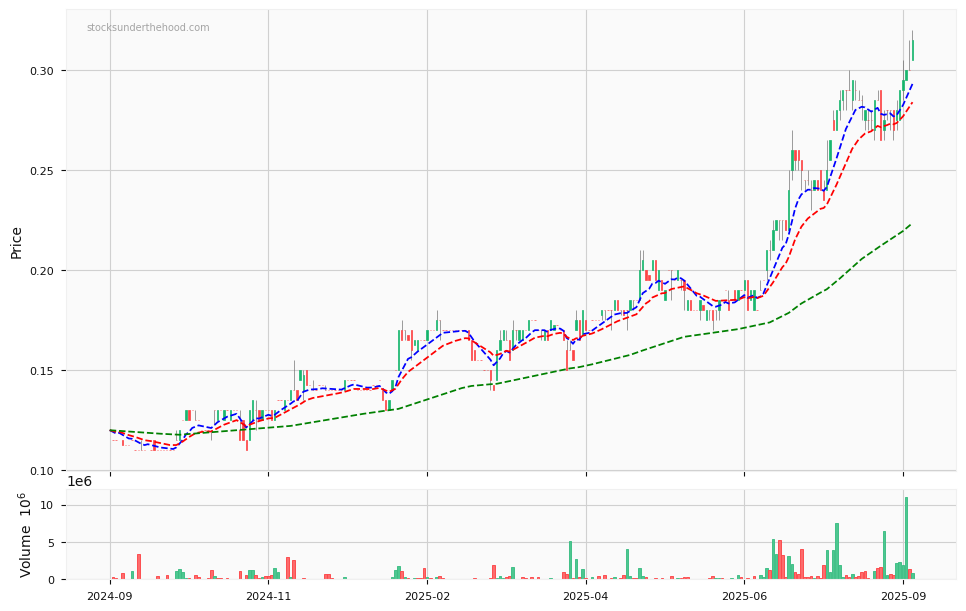
Ticker code: MRE
MRE Red Flags & Risk Indicators
❌
⚠️ RED FLAGS: 4 identified
- Large Share Issuance
- Zero Revenue
- Falling Earnings
- Market Cap < Liabilities
Income Statement
| Revenue 2024 Per Share |
Revenue 2025e Per Share |
Revenue 2026e Per Share |
Revenue 24 to 25e [%] |
Revenue 25e to 26e [%] |
EBITDA 2024 Per Share |
EBITDA 2025e Per Share |
EBITDA 2026e Per Share |
EBITDA 24 to 25e [%] |
EBITDA 25e to 26e [%] |
| None |
None |
None |
None |
None |
None |
None |
None |
None |
None |
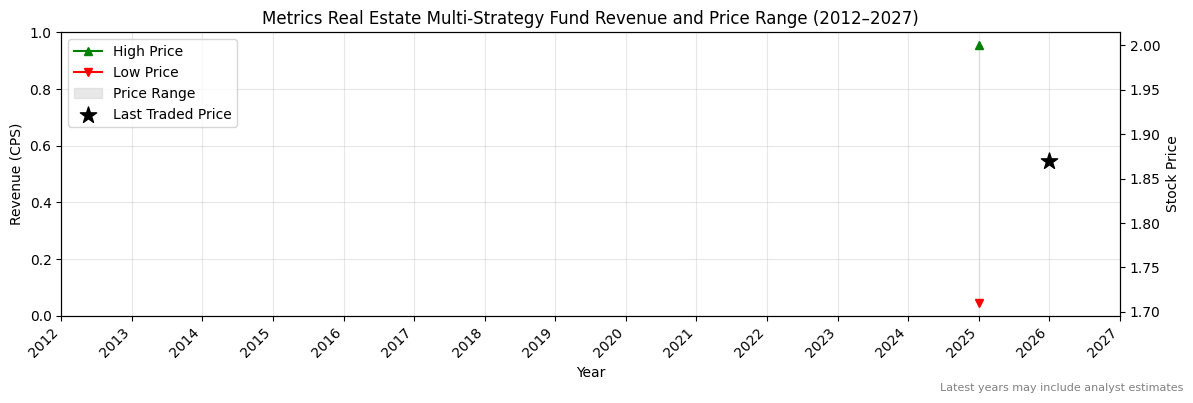
MRE Revenue Per Share (2012–2027)
MRE Earnings before Interest, Tax, Depreciation and Amortisation (EBITDA) Per Share (2012–2027)
MRE Normalised Earnings Per Share (EPS) (2012–2027)
Valuation
| Price To Sales |
Price To Book |
PER 2023 |
PER 2024 |
13Y Median PER Low |
PER 2025e |
13Y Median PER High |
PER 2026e |
Last Updated |
| None |
None |
None |
None |
None |
None |
None |
None |
8/7/25 |
MRE Yearly Price Earnings Ratio (PER) Highs and Lows
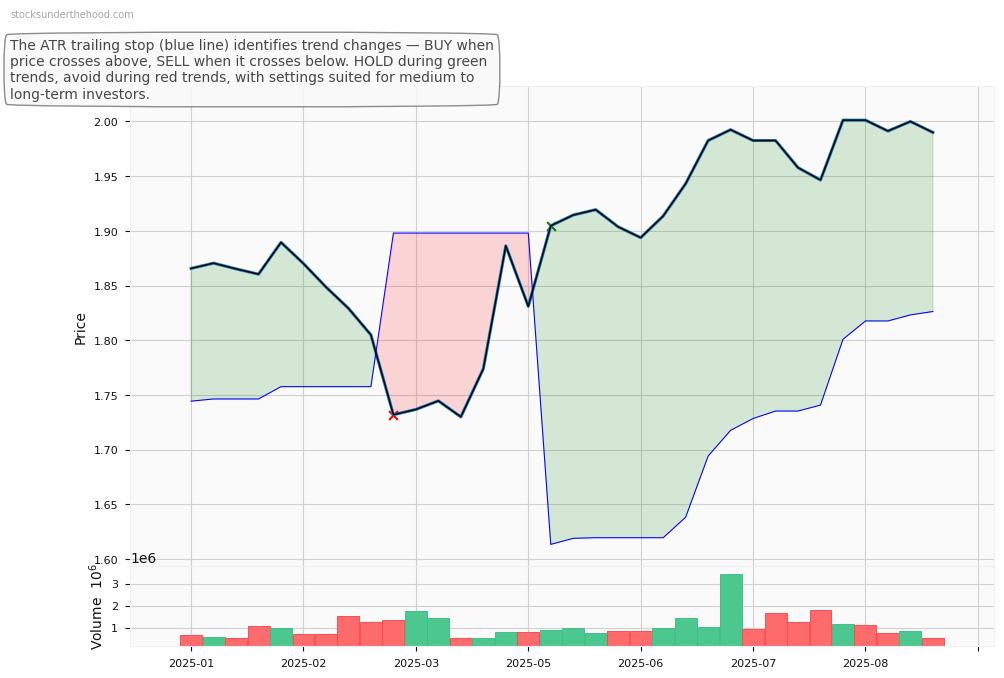
MRE Weekly Price Chart with Average True Range (ATR) Trailing Stop (10-Year View)
Ticker code: ^AXTJ
^AXTJ Red Flags & Risk Indicators
✅
⚠️ RED FLAGS: 0 identified
No red flags detected.
Income Statement
| Revenue 2024 Per Share |
Revenue 2025e Per Share |
Revenue 2026e Per Share |
Revenue 24 to 25e [%] |
Revenue 25e to 26e [%] |
EBITDA 2024 Per Share |
EBITDA 2025e Per Share |
EBITDA 2026e Per Share |
EBITDA 24 to 25e [%] |
EBITDA 25e to 26e [%] |
| None |
None |
None |
None |
None |
None |
None |
None |
None |
None |
^AXTJ Revenue Per Share (2012–2027)
^AXTJ Earnings before Interest, Tax, Depreciation and Amortisation (EBITDA) Per Share (2012–2027)
^AXTJ Normalised Earnings Per Share (EPS) (2012–2027)
Valuation
| Price To Sales |
Price To Book |
PER 2023 |
PER 2024 |
13Y Median PER Low |
PER 2025e |
13Y Median PER High |
PER 2026e |
Last Updated |
| None |
None |
None |
None |
None |
None |
None |
None |
None |
^AXTJ Yearly Price Earnings Ratio (PER) Highs and Lows
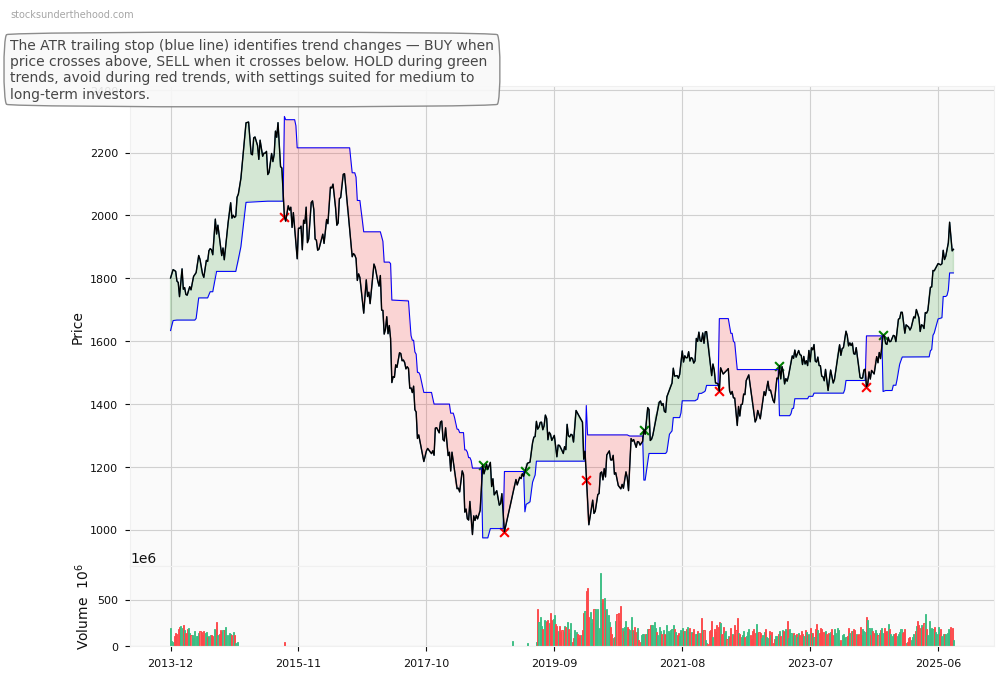
^AXTJ Weekly Price Chart with Average True Range (ATR) Trailing Stop (10-Year View)
Ticker code: ^AXIJ
^AXIJ Red Flags & Risk Indicators
✅
⚠️ RED FLAGS: 0 identified
No red flags detected.
Income Statement
| Revenue 2024 Per Share |
Revenue 2025e Per Share |
Revenue 2026e Per Share |
Revenue 24 to 25e [%] |
Revenue 25e to 26e [%] |
EBITDA 2024 Per Share |
EBITDA 2025e Per Share |
EBITDA 2026e Per Share |
EBITDA 24 to 25e [%] |
EBITDA 25e to 26e [%] |
| None |
None |
None |
None |
None |
None |
None |
None |
None |
None |
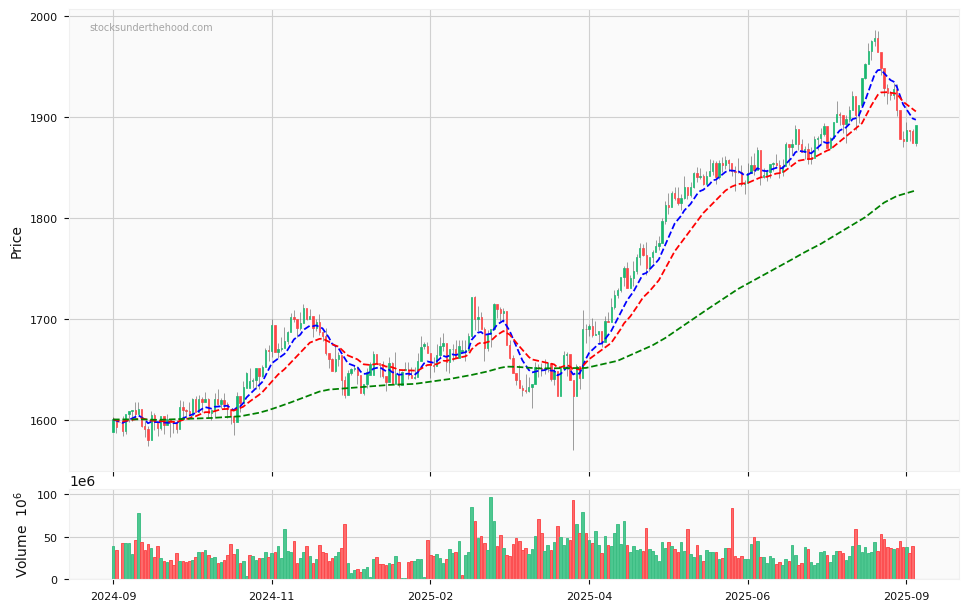
^AXIJ Revenue Per Share (2012–2027)
^AXIJ Earnings before Interest, Tax, Depreciation and Amortisation (EBITDA) Per Share (2012–2027)
^AXIJ Normalised Earnings Per Share (EPS) (2012–2027)
Valuation
| Price To Sales |
Price To Book |
PER 2023 |
PER 2024 |
13Y Median PER Low |
PER 2025e |
13Y Median PER High |
PER 2026e |
Last Updated |
| None |
None |
None |
None |
None |
None |
None |
None |
None |
^AXIJ Yearly Price Earnings Ratio (PER) Highs and Lows
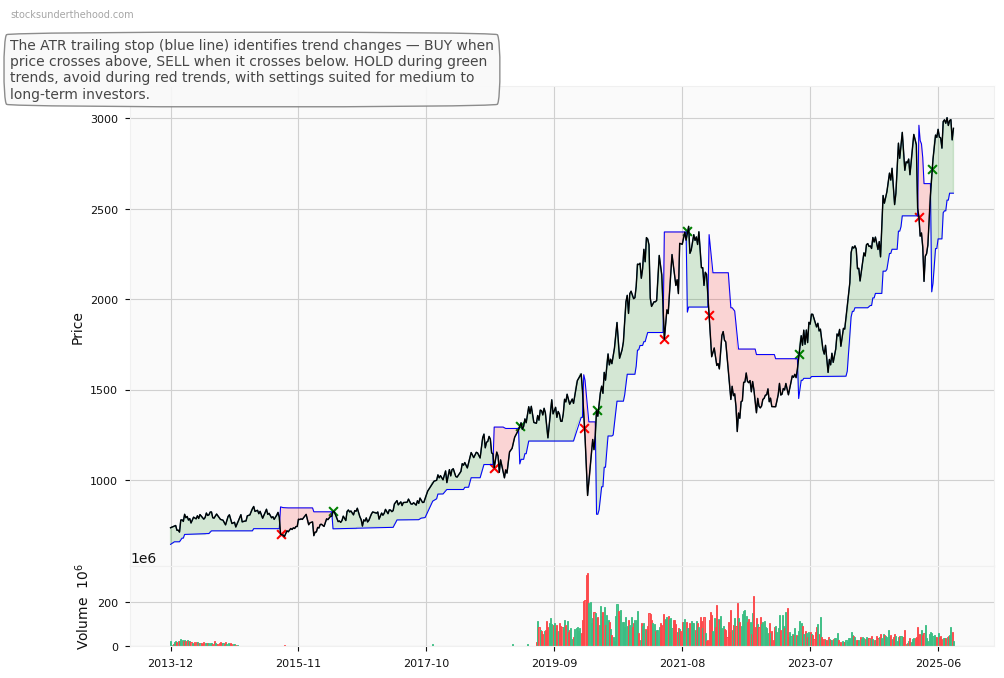
^AXIJ Weekly Price Chart with Average True Range (ATR) Trailing Stop (10-Year View)
S&P/ASX 200 Telecommunication Services Index tracks telecom sector companies on the ASX.
Ticker code: ^AXTJ
Sector: Communication Services | Industry: Index | Website: N/A
Market Information
| Market Capitalisation |
Enterprise Value |
Shares Outstanding |
Free Float [%] |
Free Float Value |
| None |
None |
None |
0.0 |
None |
Balance Sheet & Quality
| Equity |
Cash |
Debt |
Return On Equity (ROE) |
EBITDA 25 Margin [%] |
Net Debt / Equity [%] |
Rule of 40 |
| None |
None |
None |
None |
None |
0.0 |
None |
Technicals & Short Data
| 3EMA Status |
Volatility [%] |
Value Traded Today |
Average Daily Liquidity |
Short [%] |
Days To Cover |
| None |
None |
$0 |
$63,533,220,960 |
None |
0.0 |
Dividends
| Previous Dividend |
Last Dividend |
Franking [%] |
Ex-Div Date |
Gross Yield [%] |
| None |
None |
None |
None |
None |
Price Performance Snapshot
| Last Traded Price |
Change [%] |
1 Week [%] |
1 Month [%] |
3 Months [%] |
6 Months [%] |
12 Months [%] |
| $1,776.000 |
None |
-1.5 |
-4.5 |
-4.5 |
3.7 |
10.2 |
^AXTJ Price Chart with Volume and 3EMA
^AXTJ Short Positions
No chart available for this company.
Click HERE to understand why the above moving averages have been chosen.