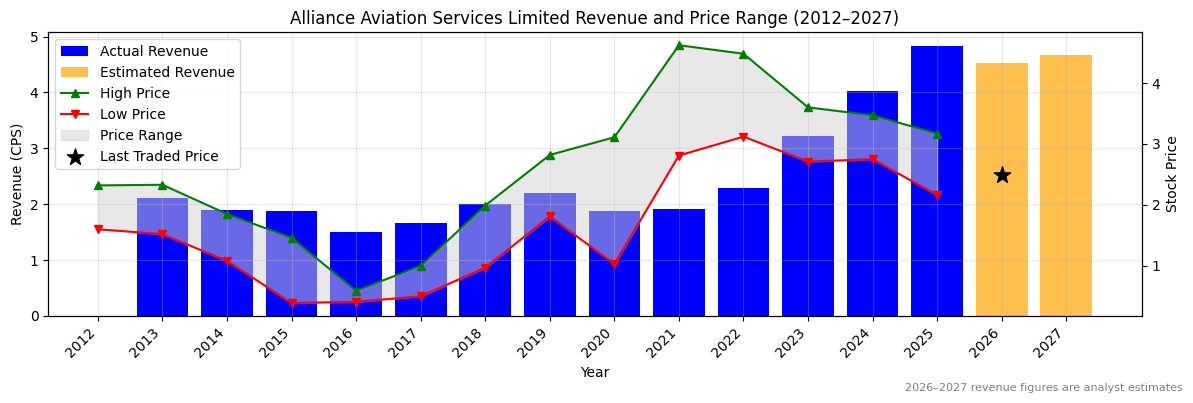
Ticker code: AQZ
AQZ Red Flags & Risk Indicators
❌
⚠️ RED FLAGS: 3 identified
- Negative Operating Cash Flow
- Low Operating Margin
- Falling EBITDA Margins
Income Statement
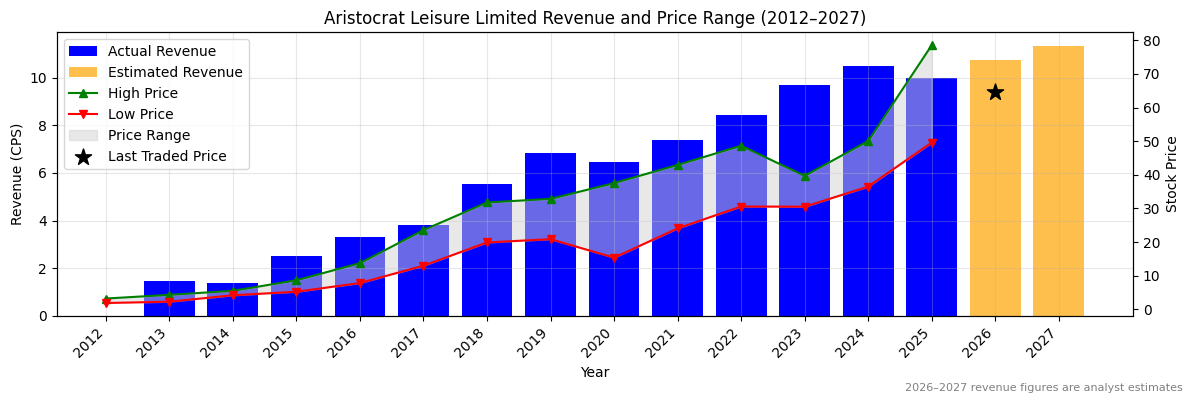
| Revenue 2024 Per Share |
Revenue 2025e Per Share |
Revenue 2026e Per Share |
Revenue 24 to 25e [%] |
Revenue 25e to 26e [%] |
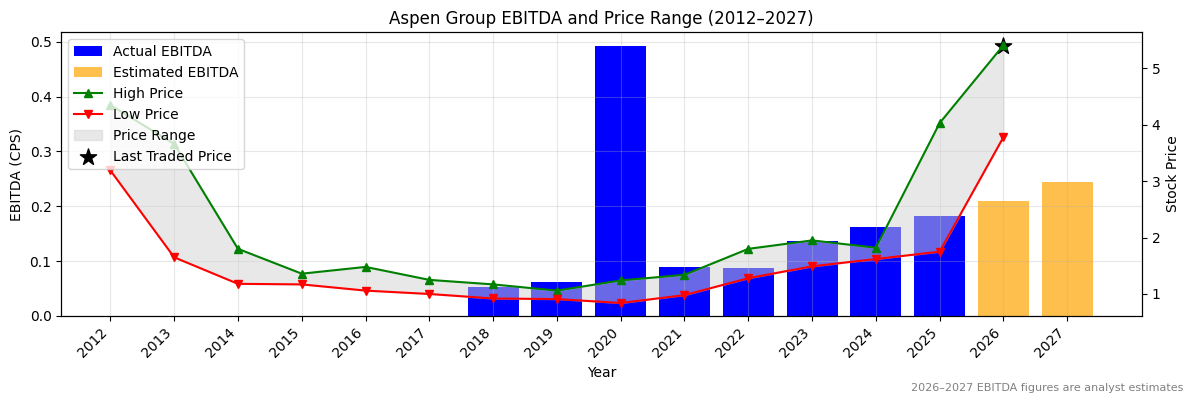
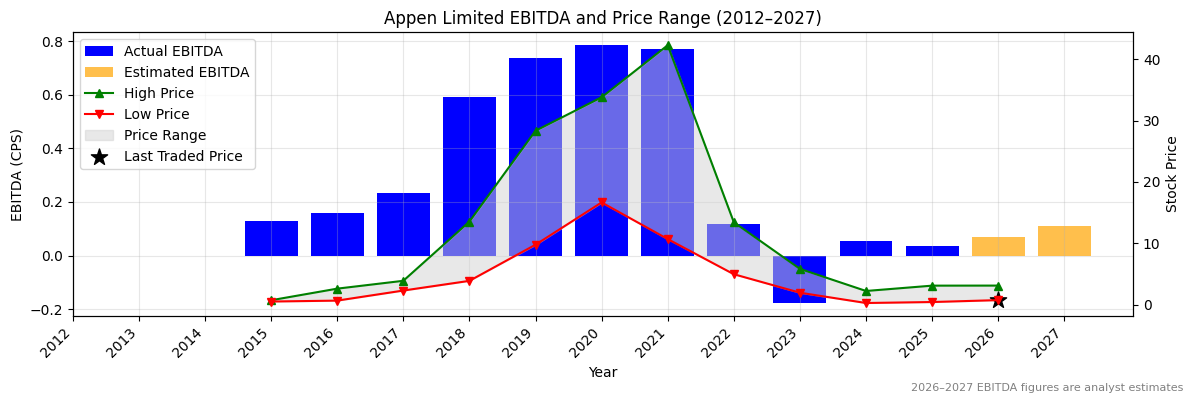
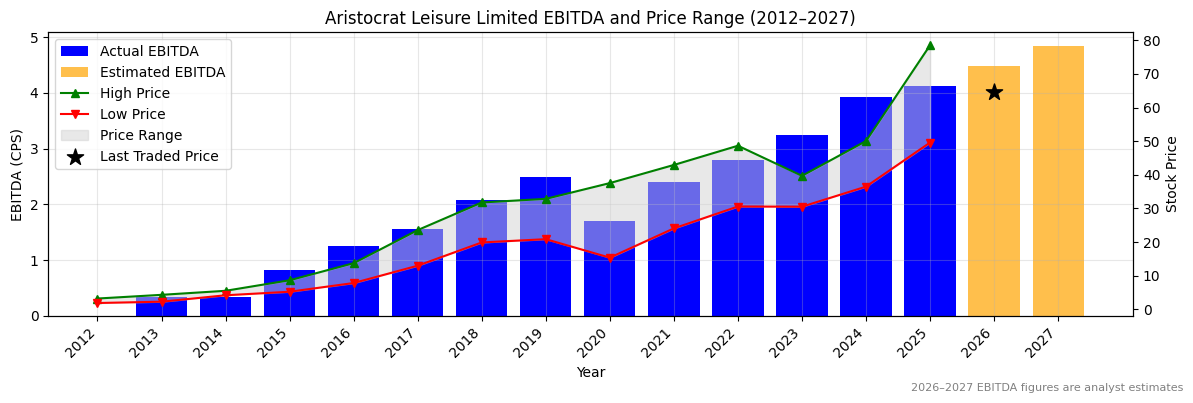
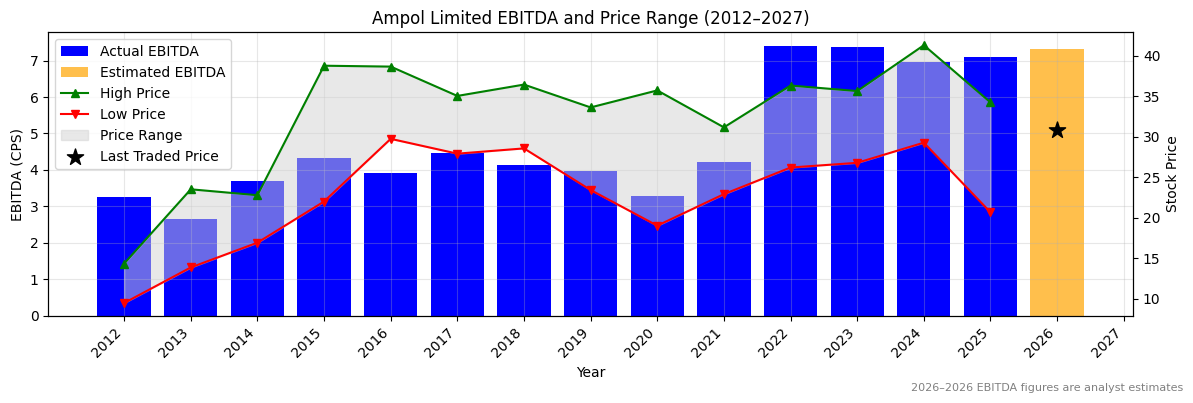
EBITDA 2024 Per Share |
EBITDA 2025e Per Share |
EBITDA 2026e Per Share |
EBITDA 24 to 25e [%] |
EBITDA 25e to 26e [%] |
| 4.02384 |
4.83418 |
4.52384 |
20.1 |
-6.4 |
1.1099 |
1.29288 |
1.3422 |
16.5 |
3.8 |
AQZ Revenue Per Share (2012–2027)
✅✅
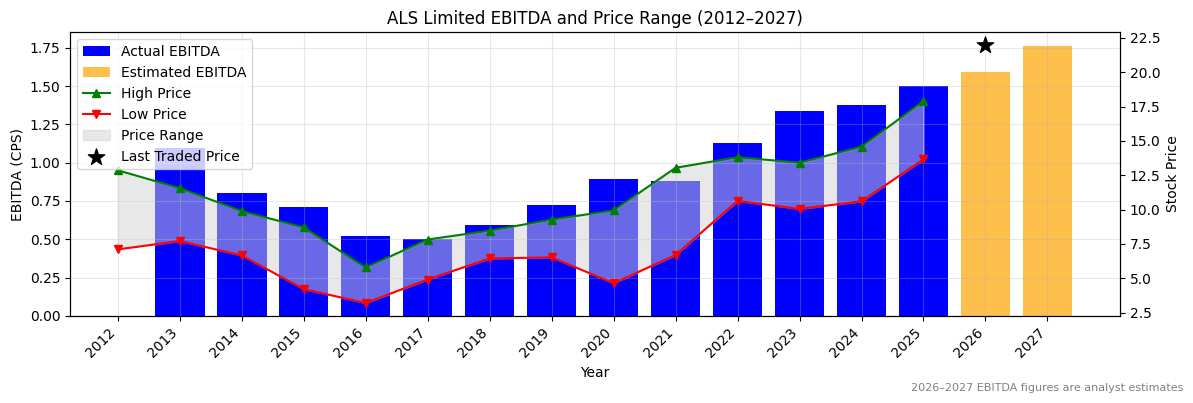
AQZ Earnings before Interest, Tax, Depreciation and Amortisation (EBITDA) Per Share (2012–2027)
✅
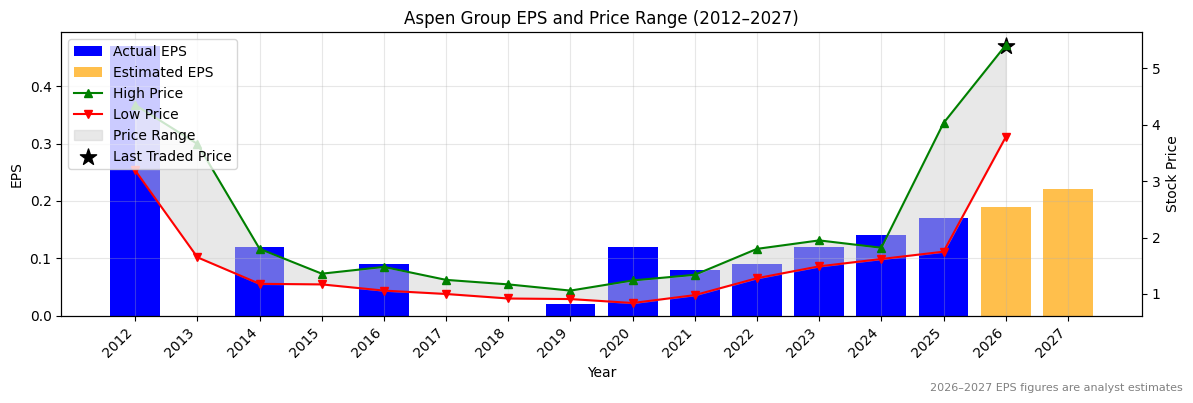
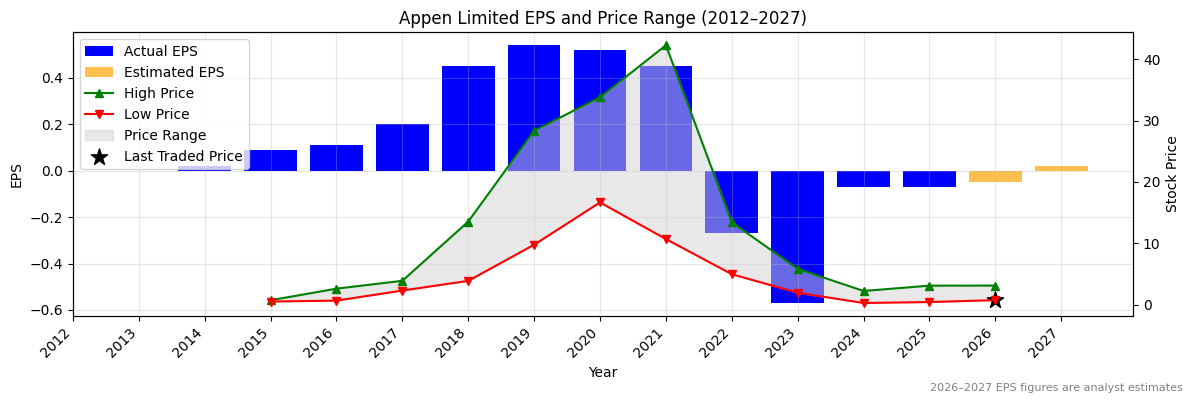
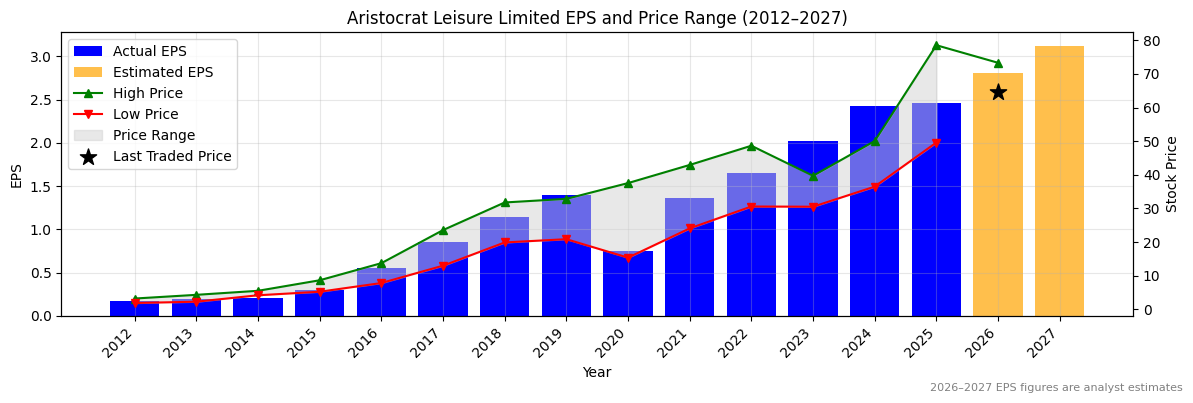
AQZ Normalised Earnings Per Share (EPS) (2012–2027)
❌
Valuation
| Price To Sales |
Price To Book |
PER 2023 |
PER 2024 |
13Y Median PER Low |
PER 2025e |
13Y Median PER High |
PER 2026e |
Last Updated |
| 0.5 |
0.9 |
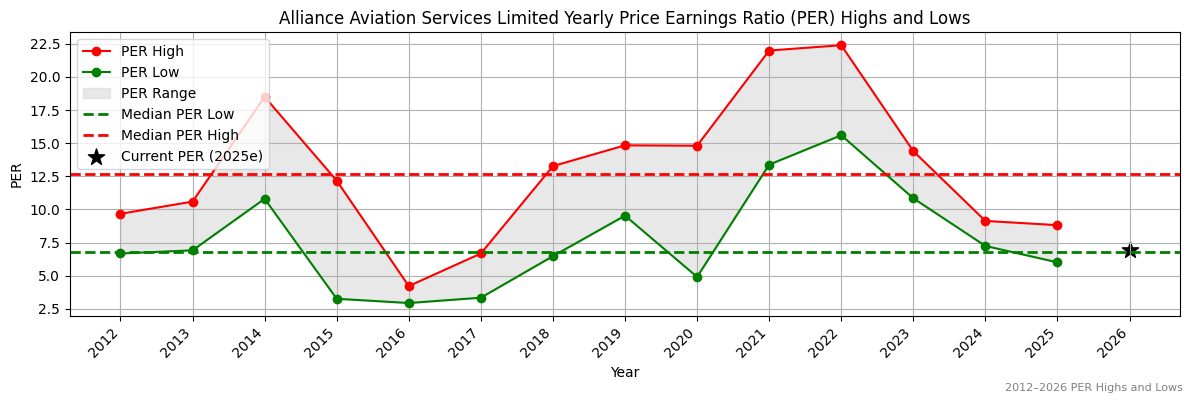
10.1 |
6.7 |
6.8 |
7.0 |
12.7 |
7.0 |
2/8/25 |
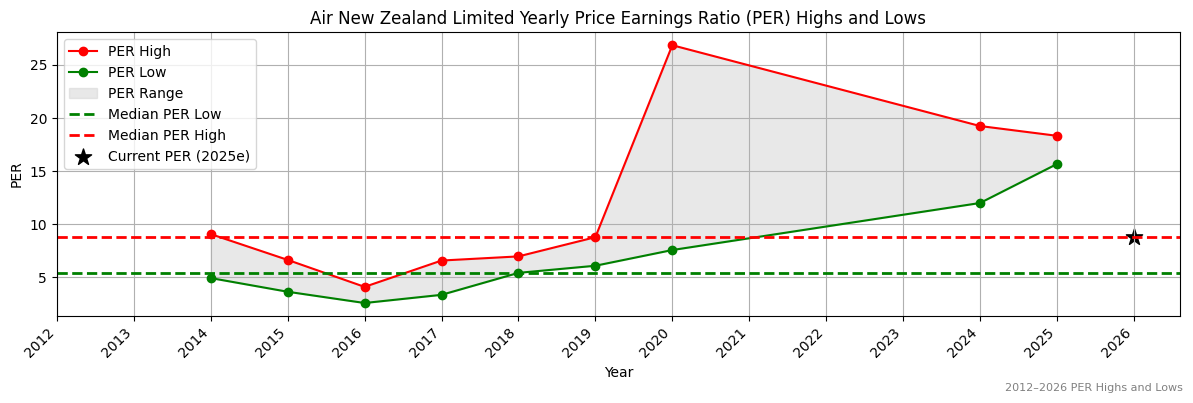
AQZ Yearly Price Earnings Ratio (PER) Highs and Lows
✅
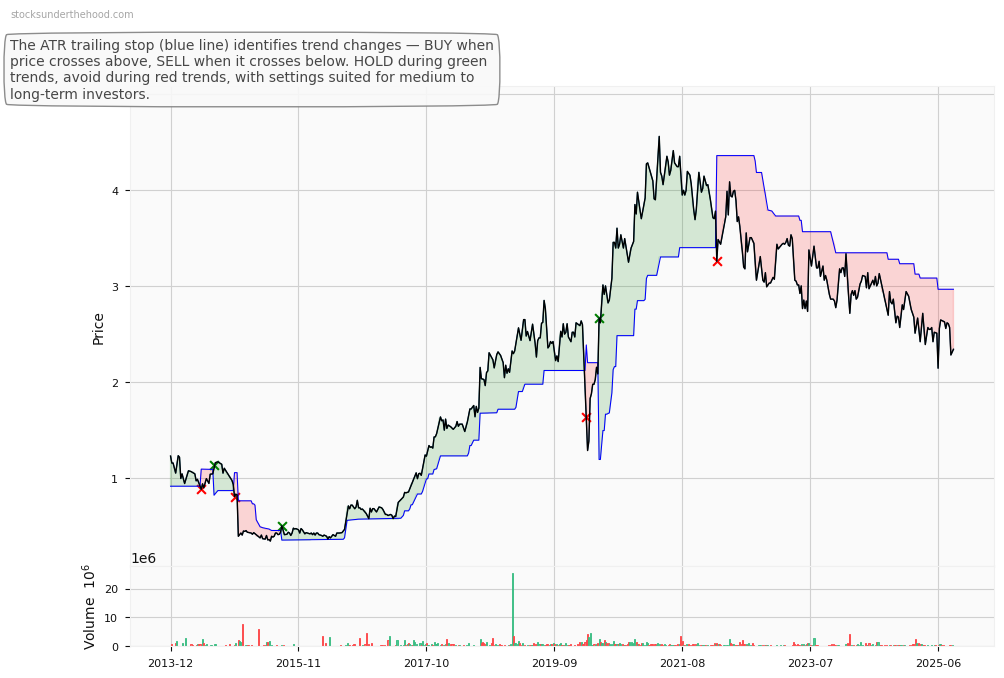
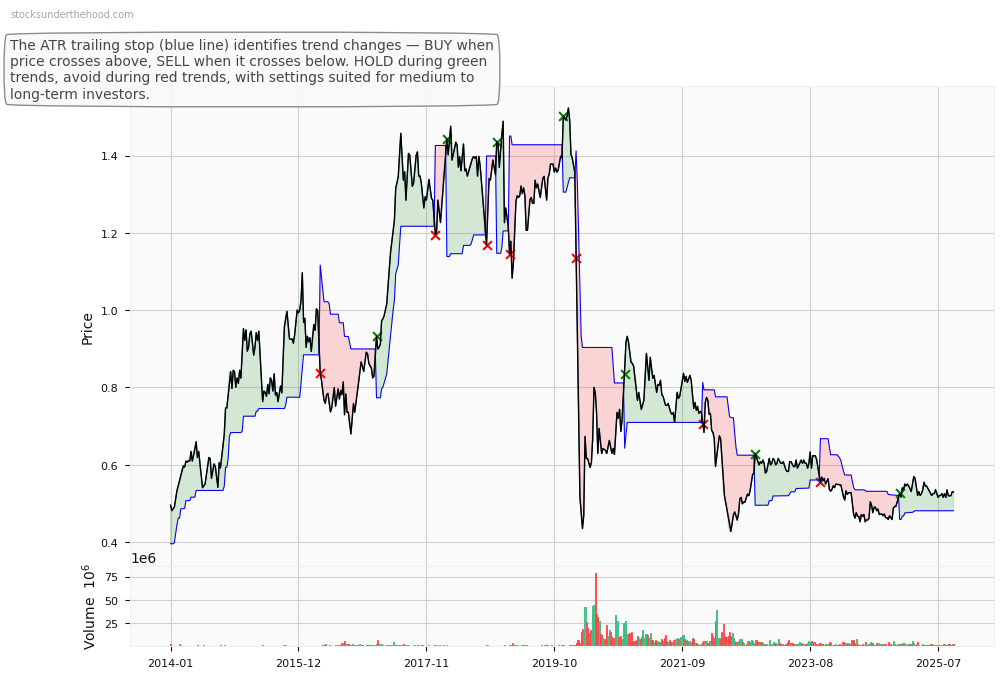
AQZ Weekly Price Chart with Average True Range (ATR) Trailing Stop (10-Year View)
Ticker code: APZ
APZ Red Flags & Risk Indicators
⚠️
⚠️ RED FLAGS: 1 identified
Income Statement
| Revenue 2024 Per Share |
Revenue 2025e Per Share |
Revenue 2026e Per Share |
Revenue 24 to 25e [%] |
Revenue 25e to 26e [%] |
EBITDA 2024 Per Share |
EBITDA 2025e Per Share |
EBITDA 2026e Per Share |
EBITDA 24 to 25e [%] |
EBITDA 25e to 26e [%] |
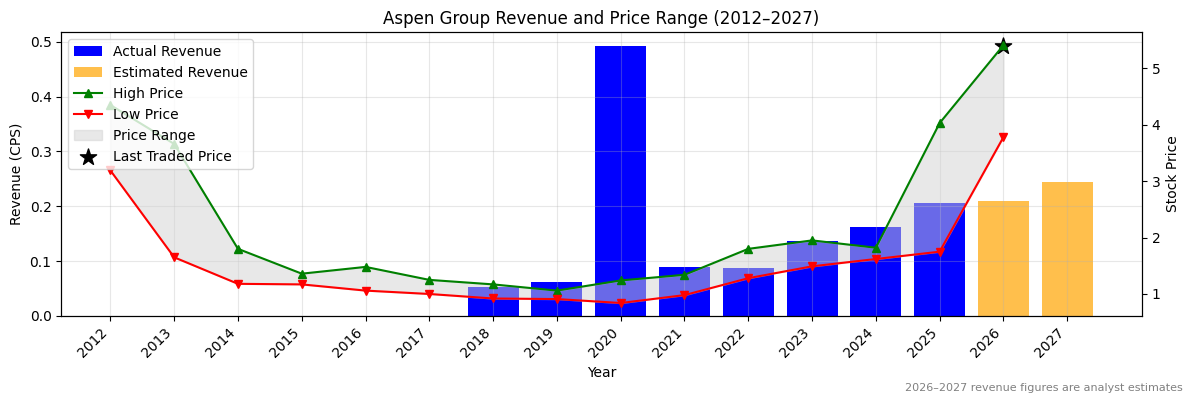
| 0.16167 |
0.20612 |
0.20996 |
27.5 |
1.9 |
0.16167 |
0.18283 |
0.20996 |
13.1 |
14.8 |
APZ Revenue Per Share (2012–2027)
✅✅
APZ Earnings before Interest, Tax, Depreciation and Amortisation (EBITDA) Per Share (2012–2027)
✅
APZ Normalised Earnings Per Share (EPS) (2012–2027)
✅✅
Valuation
| Price To Sales |
Price To Book |
PER 2023 |
PER 2024 |
13Y Median PER Low |
PER 2025e |
13Y Median PER High |
PER 2026e |
Last Updated |
| 11.1 |
2.2 |
44.0 |
37.7 |
11.8 |
31.1 |
16.4 |
27.8 |
8/9/25 |
APZ Yearly Price Earnings Ratio (PER) Highs and Lows
❌
APZ Weekly Price Chart with Average True Range (ATR) Trailing Stop (10-Year View)
Ticker code: APX
APX Red Flags & Risk Indicators
❌
⚠️ RED FLAGS: 7 identified
- Negative Operating Cash Flow
- Low Operating Margin
- Increasing Shorts
- Falling Earnings
- Falling Revenues
- Risk Of Capital Raise
- Falling EBITDA Margins
Income Statement
| Revenue 2024 Per Share |
Revenue 2025e Per Share |
Revenue 2026e Per Share |
Revenue 24 to 25e [%] |
Revenue 25e to 26e [%] |
EBITDA 2024 Per Share |
EBITDA 2025e Per Share |
EBITDA 2026e Per Share |
EBITDA 24 to 25e [%] |
EBITDA 25e to 26e [%] |
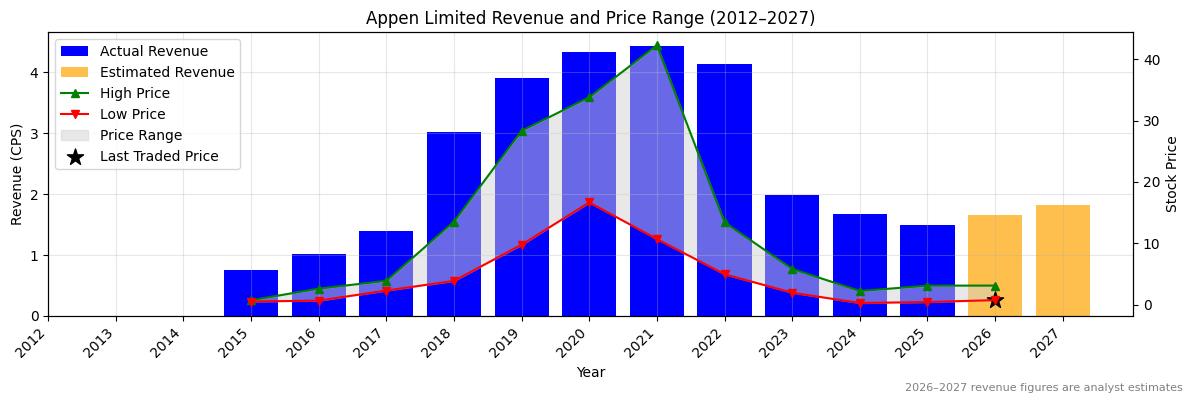
| 1.67324 |
1.49098 |
1.65359 |
-10.9 |
10.9 |
0.05551 |
0.0356 |
0.07078 |
-35.9 |
98.8 |
APX Revenue Per Share (2012–2027)
❌
APX Earnings before Interest, Tax, Depreciation and Amortisation (EBITDA) Per Share (2012–2027)
❌
APX Normalised Earnings Per Share (EPS) (2012–2027)
❌
Valuation
| Price To Sales |
Price To Book |
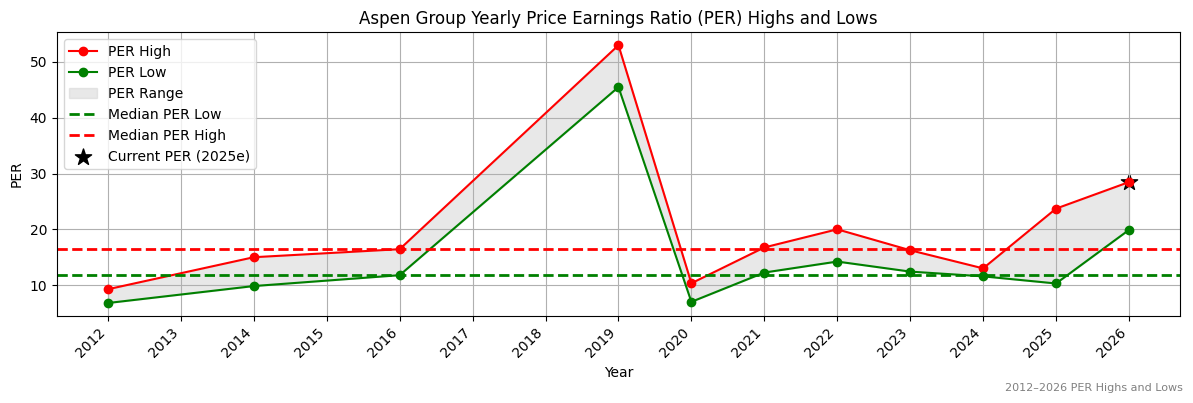
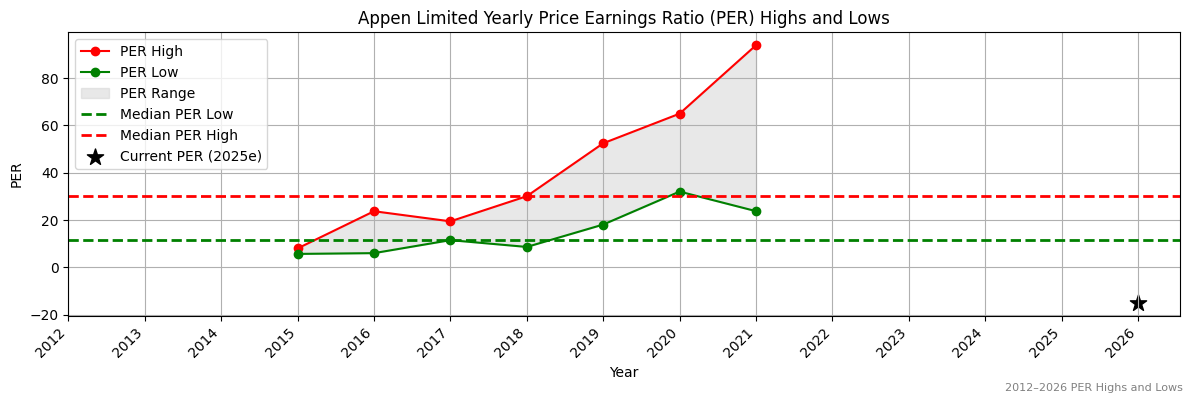
PER 2023 |
PER 2024 |
13Y Median PER Low |
PER 2025e |
13Y Median PER High |
PER 2026e |
Last Updated |
| 0.9 |
2.1 |
-1.4 |
-11.1 |
11.5 |
-11.1 |
30.1 |
-15.5 |
4/10/25 |
APX Yearly Price Earnings Ratio (PER) Highs and Lows
✅✅
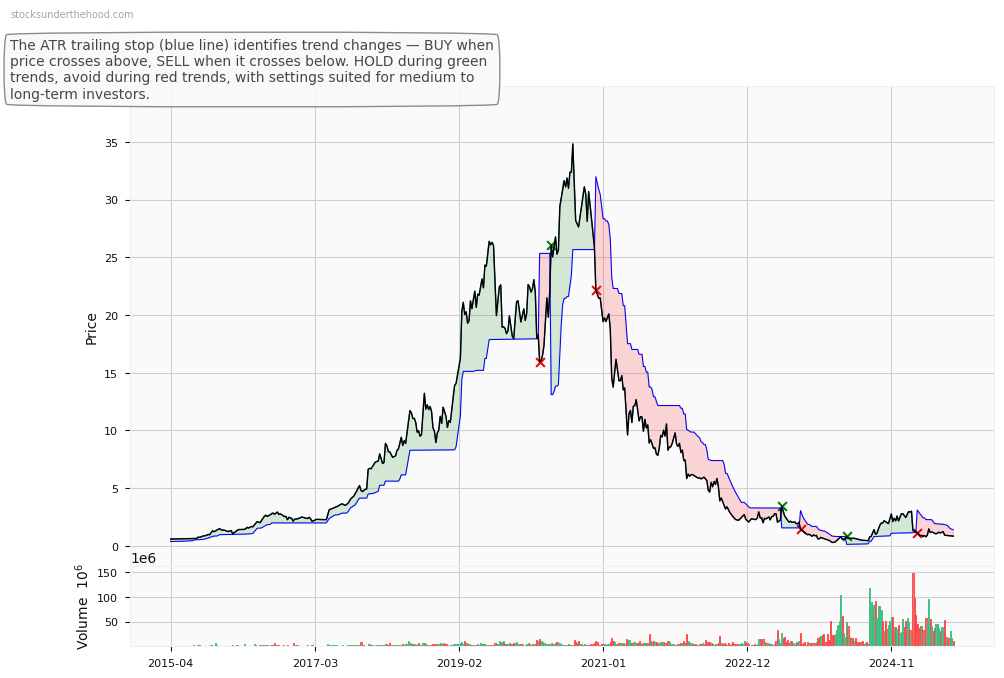
APX Weekly Price Chart with Average True Range (ATR) Trailing Stop (10-Year View)
Ticker code: APE
APE Red Flags & Risk Indicators
❌
⚠️ RED FLAGS: 3 identified
- Low Operating Margin
- More Net Debt Than Equity
- High Relative Valuation
Income Statement
| Revenue 2024 Per Share |
Revenue 2025e Per Share |
Revenue 2026e Per Share |
Revenue 24 to 25e [%] |
Revenue 25e to 26e [%] |
EBITDA 2024 Per Share |
EBITDA 2025e Per Share |
EBITDA 2026e Per Share |
EBITDA 24 to 25e [%] |
EBITDA 25e to 26e [%] |
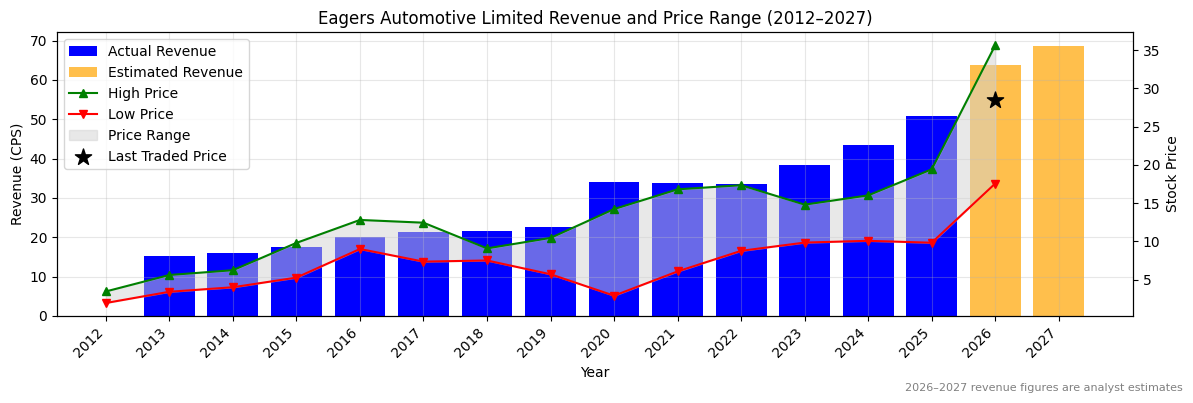
| 43.37415 |
50.73436 |
67.22898 |
17.0 |
32.5 |
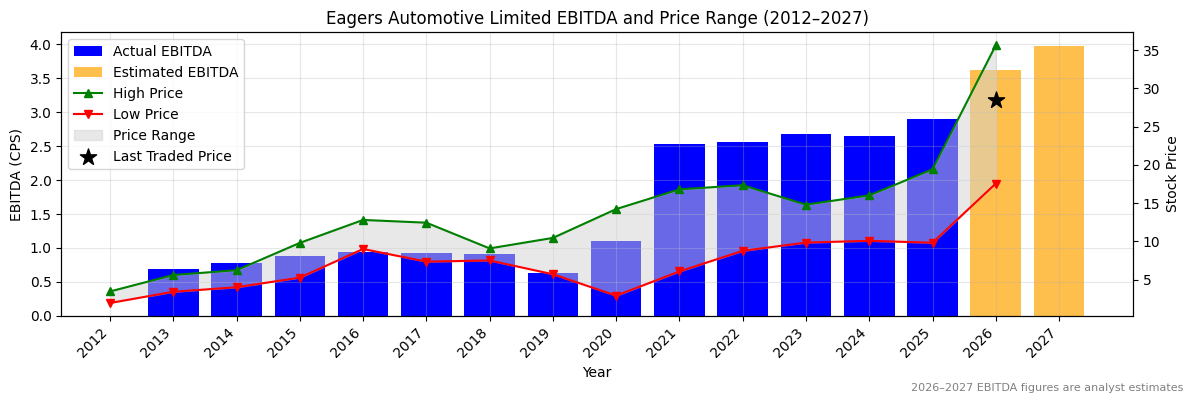
2.65315 |
2.89851 |
3.81712 |
9.2 |
31.7 |
APE Revenue Per Share (2012–2027)
✅
APE Earnings before Interest, Tax, Depreciation and Amortisation (EBITDA) Per Share (2012–2027)
✅
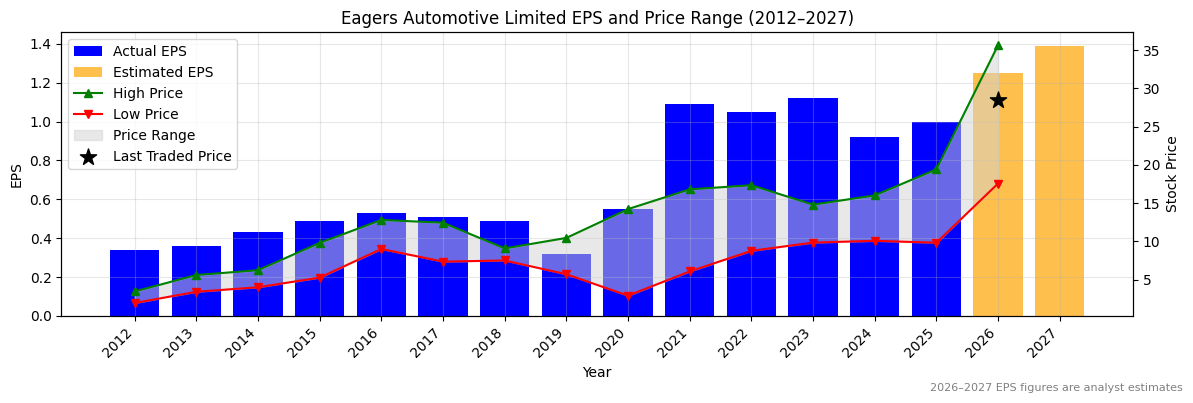
APE Normalised Earnings Per Share (EPS) (2012–2027)
✅
Valuation
| Price To Sales |
Price To Book |
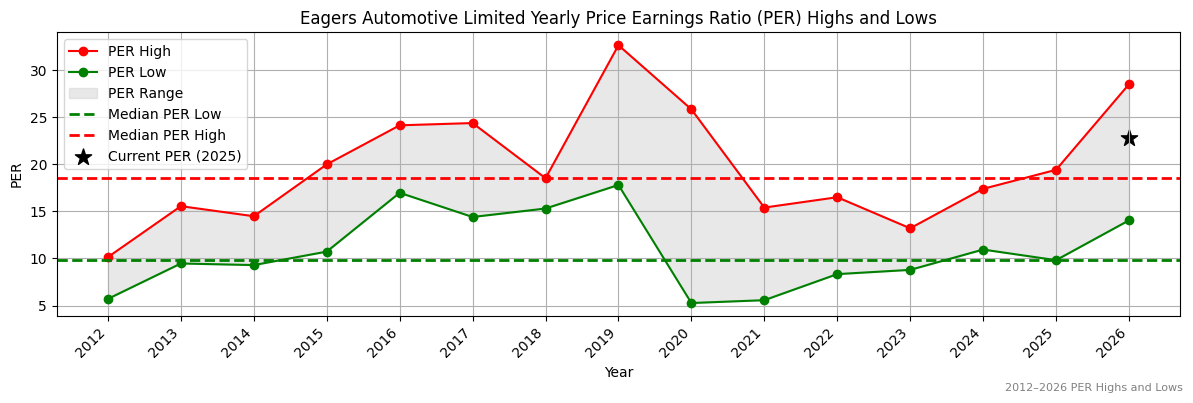
PER 2023 |
PER 2024 |
13Y Median PER Low |
PER 2025e |
13Y Median PER High |
PER 2026e |
Last Updated |
| 0.7 |
6.7 |
30.4 |
37.0 |
9.8 |
34.1 |
18.5 |
27.2 |
20/10/25 |
APE Yearly Price Earnings Ratio (PER) Highs and Lows
❌
APE Weekly Price Chart with Average True Range (ATR) Trailing Stop (10-Year View)
Ticker code: APA
APA Red Flags & Risk Indicators
❌
⚠️ RED FLAGS: 3 identified
- Falling Earnings
- Falling Revenues
- More Net Debt Than Equity
Income Statement
| Revenue 2024 Per Share |
Revenue 2025e Per Share |
Revenue 2026e Per Share |
Revenue 24 to 25e [%] |
Revenue 25e to 26e [%] |
EBITDA 2024 Per Share |
EBITDA 2025e Per Share |
EBITDA 2026e Per Share |
EBITDA 24 to 25e [%] |
EBITDA 25e to 26e [%] |
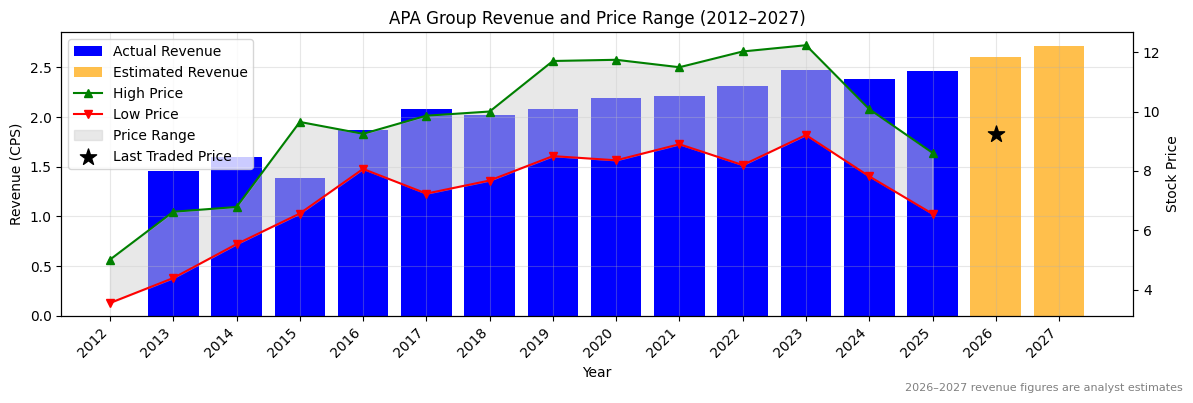
| 2.38741 |
2.46658 |
2.60289 |
3.3 |
5.5 |
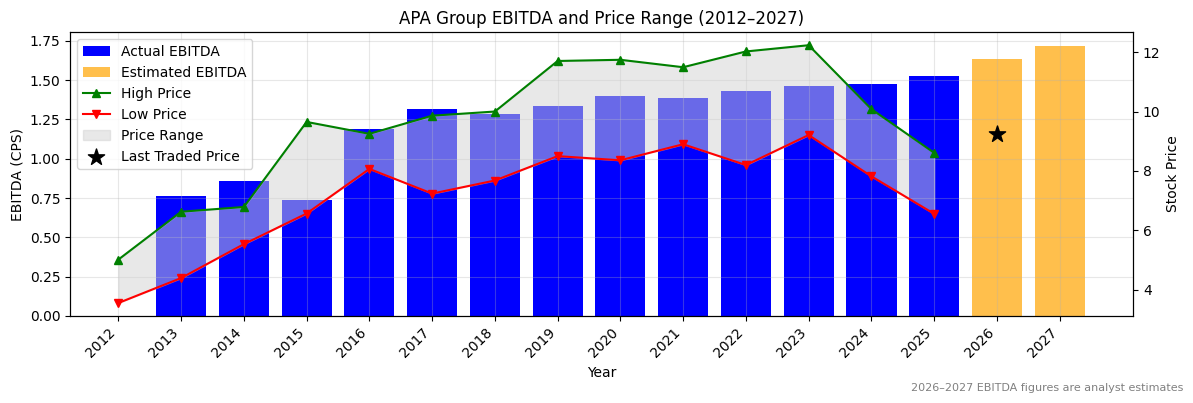
1.47499 |
1.52886 |
1.63409 |
3.7 |
6.9 |
APA Revenue Per Share (2012–2027)
✅
APA Earnings before Interest, Tax, Depreciation and Amortisation (EBITDA) Per Share (2012–2027)
✅
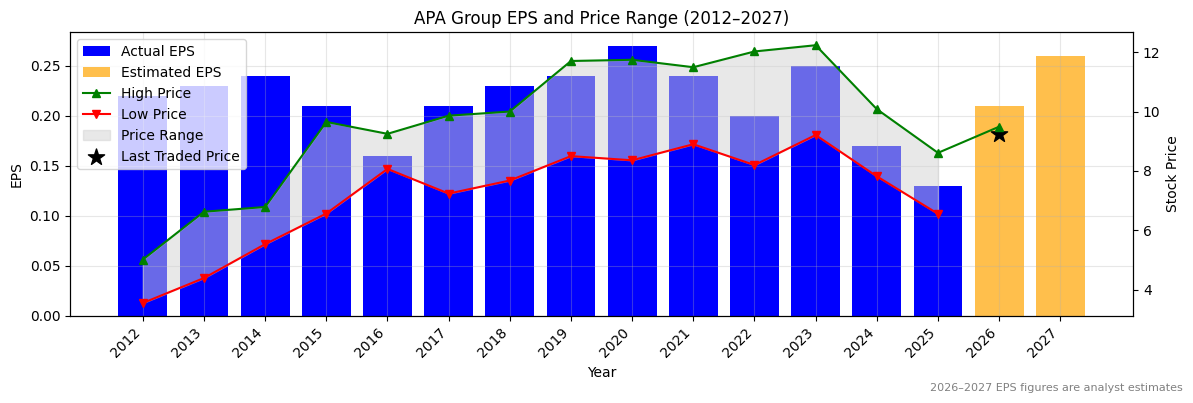
APA Normalised Earnings Per Share (EPS) (2012–2027)
❌
Valuation
| Price To Sales |
Price To Book |
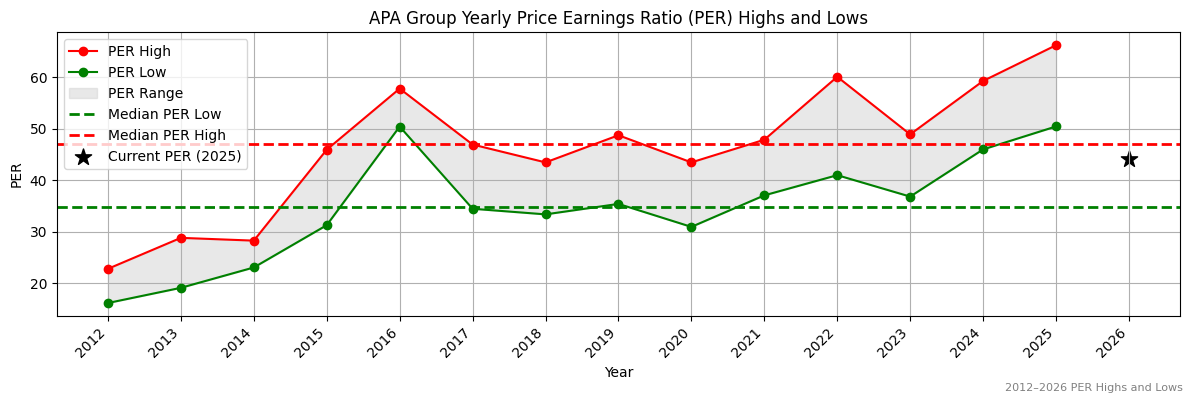
PER 2023 |
PER 2024 |
13Y Median PER Low |
PER 2025e |
13Y Median PER High |
PER 2026e |
Last Updated |
| 3.8 |
4.5 |
36.7 |
54.0 |
34.9 |
70.6 |
47.0 |
43.7 |
19/5/25 |
APA Yearly Price Earnings Ratio (PER) Highs and Lows
❌
APA Weekly Price Chart with Average True Range (ATR) Trailing Stop (10-Year View)
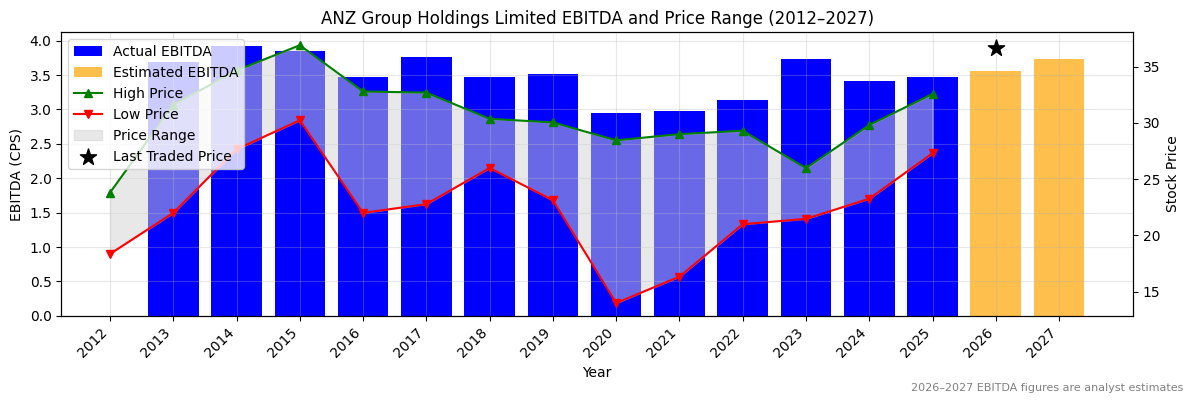
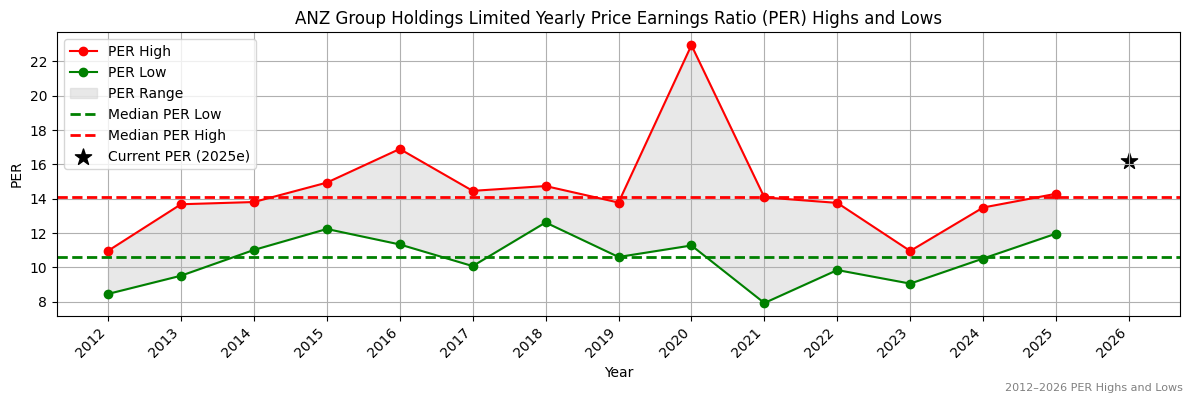
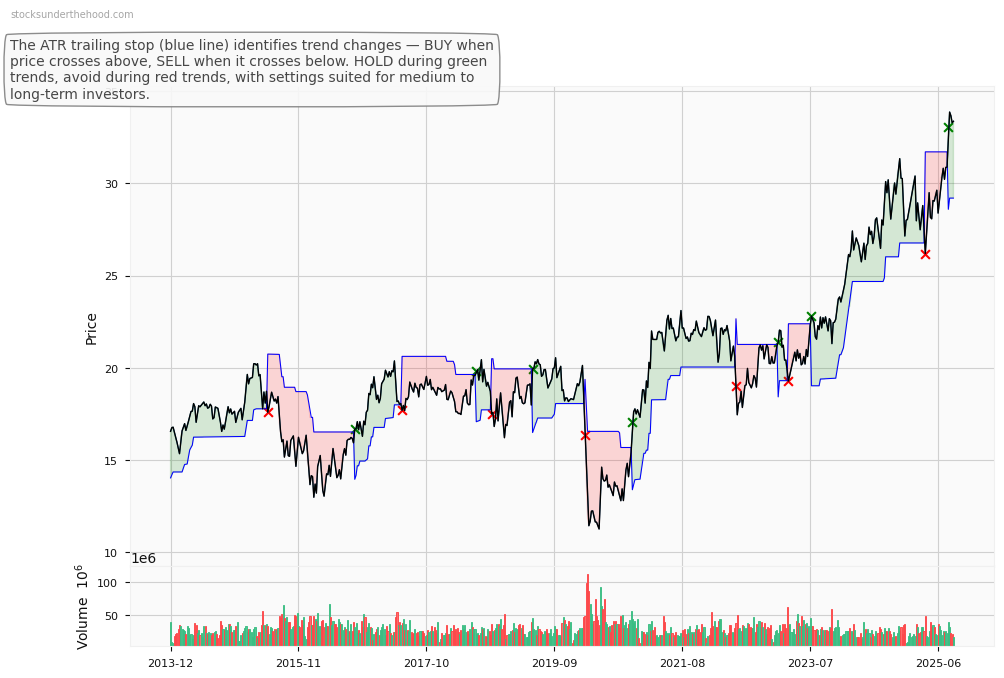
Ticker code: ANZ
ANZ Red Flags & Risk Indicators
❌
⚠️ RED FLAGS: 3 identified
- Falling Earnings
- High Relative Valuation
- Falling EBITDA Margins
Income Statement
| Revenue 2024 Per Share |
Revenue 2025e Per Share |
Revenue 2026e Per Share |
Revenue 24 to 25e [%] |
Revenue 25e to 26e [%] |
EBITDA 2024 Per Share |
EBITDA 2025e Per Share |
EBITDA 2026e Per Share |
EBITDA 24 to 25e [%] |
EBITDA 25e to 26e [%] |
| 7.04399 |
7.45243 |
7.63706 |
5.8 |
2.5 |
3.40809 |
3.46841 |
3.55882 |
1.8 |
2.6 |
ANZ Revenue Per Share (2012–2027)
✅
ANZ Earnings before Interest, Tax, Depreciation and Amortisation (EBITDA) Per Share (2012–2027)
✅
ANZ Normalised Earnings Per Share (EPS) (2012–2027)
✅
Valuation
| Price To Sales |
Price To Book |
PER 2023 |
PER 2024 |
13Y Median PER Low |
PER 2025e |
13Y Median PER High |
PER 2026e |
Last Updated |
| 5.2 |
1.5 |
15.5 |
16.6 |
10.6 |
16.1 |
14.1 |
16.2 |
8/7/25 |
ANZ Yearly Price Earnings Ratio (PER) Highs and Lows
❌
ANZ Weekly Price Chart with Average True Range (ATR) Trailing Stop (10-Year View)
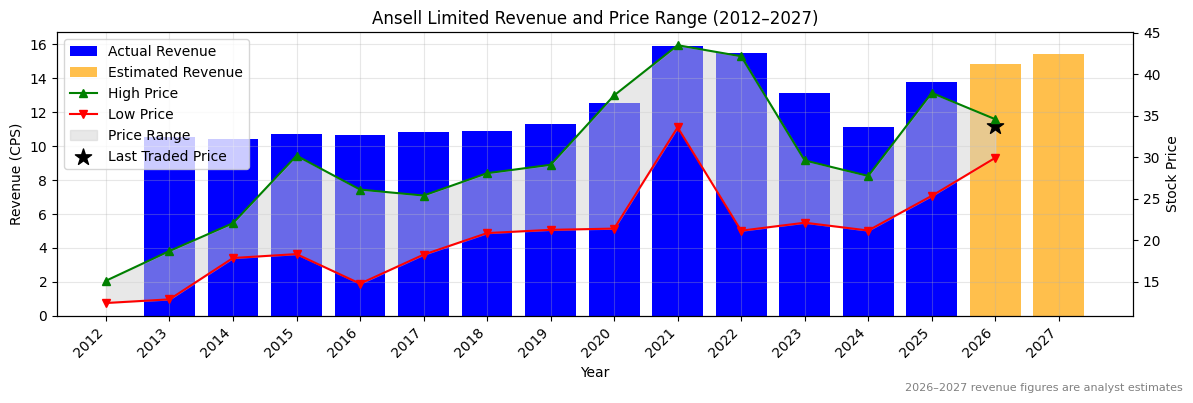
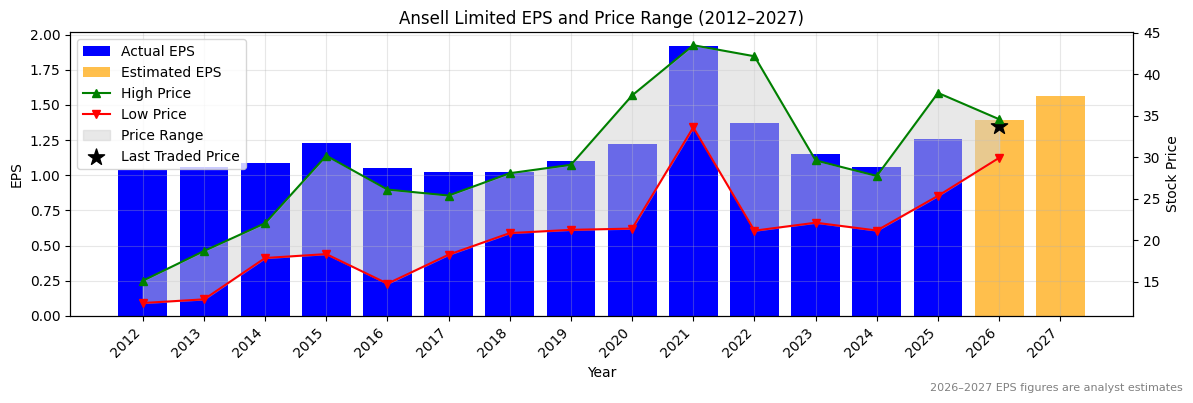
Ticker code: ANN
ANN Red Flags & Risk Indicators
⚠️
⚠️ RED FLAGS: 2 identified
- Increasing Shorts
- High Relative Valuation
Income Statement
| Revenue 2024 Per Share |
Revenue 2025e Per Share |
Revenue 2026e Per Share |
Revenue 24 to 25e [%] |
Revenue 25e to 26e [%] |
EBITDA 2024 Per Share |
EBITDA 2025e Per Share |
EBITDA 2026e Per Share |
EBITDA 24 to 25e [%] |
EBITDA 25e to 26e [%] |
| 11.14453 |
13.79208 |
14.84912 |
23.8 |
7.7 |
1.84515 |
2.45799 |
2.6979 |
33.2 |
9.8 |
ANN Revenue Per Share (2012–2027)
✅✅
ANN Earnings before Interest, Tax, Depreciation and Amortisation (EBITDA) Per Share (2012–2027)
✅✅
ANN Normalised Earnings Per Share (EPS) (2012–2027)
✅
Valuation
| Price To Sales |
Price To Book |
PER 2023 |
PER 2024 |
13Y Median PER Low |
PER 2025e |
13Y Median PER High |
PER 2026e |
Last Updated |
| 2.6 |
2.7 |
31.7 |
34.4 |
17.6 |
29.0 |
24.9 |
26.3 |
26/10/25 |
ANN Yearly Price Earnings Ratio (PER) Highs and Lows
❌
ANN Weekly Price Chart with Average True Range (ATR) Trailing Stop (10-Year View)
Ticker code: ANG
ANG Red Flags & Risk Indicators
❌
⚠️ RED FLAGS: 4 identified
- Negative Operating Cash Flow
- Increasing Shorts
- Falling Earnings
- Falling EBITDA Margins
Income Statement
| Revenue 2024 Per Share |
Revenue 2025e Per Share |
Revenue 2026e Per Share |
Revenue 24 to 25e [%] |
Revenue 25e to 26e [%] |
EBITDA 2024 Per Share |
EBITDA 2025e Per Share |
EBITDA 2026e Per Share |
EBITDA 24 to 25e [%] |
EBITDA 25e to 26e [%] |
| 0.53403 |
0.58906 |
0.61656 |
10.3 |
4.7 |
0.08139 |
0.08364 |
0.09465 |
2.8 |
13.2 |
ANG Revenue Per Share (2012–2027)
✅
ANG Earnings before Interest, Tax, Depreciation and Amortisation (EBITDA) Per Share (2012–2027)
✅
ANG Normalised Earnings Per Share (EPS) (2012–2027)
✅
Valuation
| Price To Sales |
Price To Book |
PER 2023 |
PER 2024 |
13Y Median PER Low |
PER 2025e |
13Y Median PER High |
PER 2026e |
Last Updated |
| 0.4 |
1.1 |
26.5 |
5.3 |
6.0 |
4.4 |
17.4 |
5.3 |
15/6/25 |
ANG Yearly Price Earnings Ratio (PER) Highs and Lows
✅✅
ANG Weekly Price Chart with Average True Range (ATR) Trailing Stop (10-Year View)
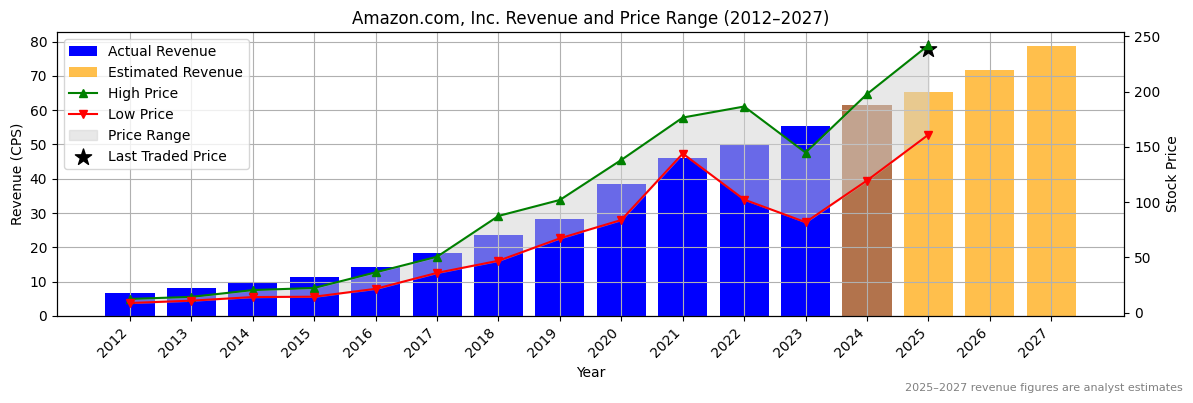
Ticker code: AMZN
AMZN Red Flags & Risk Indicators
✅
⚠️ RED FLAGS: 0 identified
No red flags detected.
Income Statement
| Revenue 2024 Per Share |
Revenue 2025e Per Share |
Revenue 2026e Per Share |
Revenue 24 to 25e [%] |
Revenue 25e to 26e [%] |
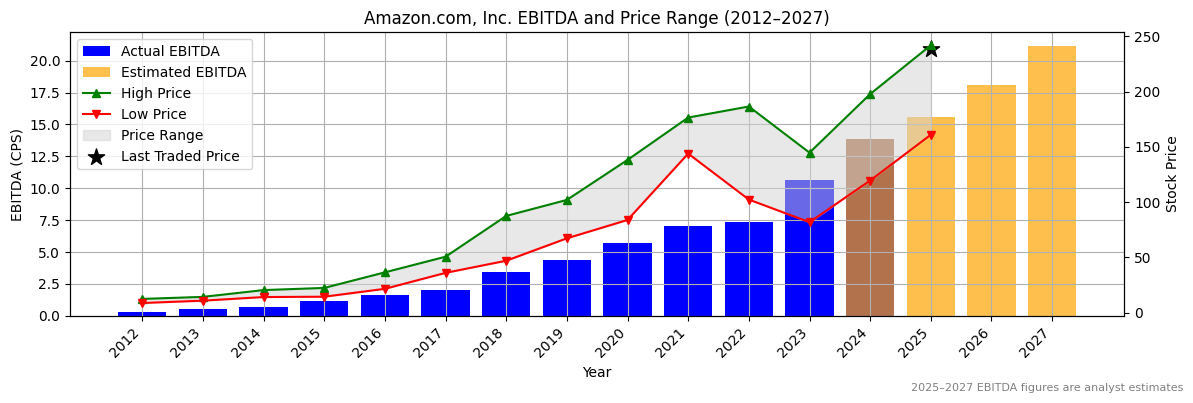
EBITDA 2024 Per Share |
EBITDA 2025e Per Share |
EBITDA 2026e Per Share |
EBITDA 24 to 25e [%] |
EBITDA 25e to 26e [%] |
| 61.41674 |
65.25332 |
71.79616 |
6.2 |
10.0 |
13.87857 |
15.58612 |
18.09767 |
12.3 |
16.1 |
AMZN Revenue Per Share (2012–2027)
✅
AMZN Earnings before Interest, Tax, Depreciation and Amortisation (EBITDA) Per Share (2012–2027)
✅
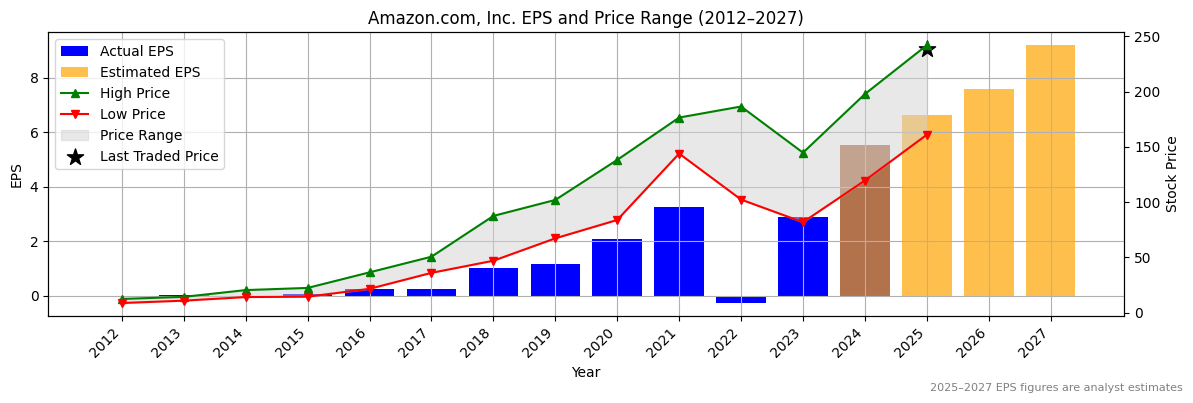
AMZN Normalised Earnings Per Share (EPS) (2012–2027)
✅
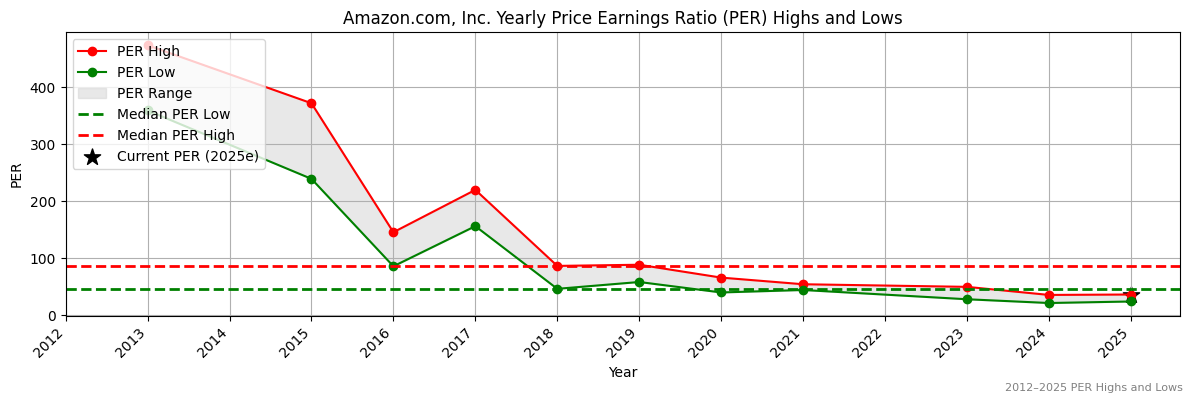
Valuation
| Price To Sales |
Price To Book |
PER 2023 |
PER 2024 |
13Y Median PER Low |
PER 2025e |
13Y Median PER High |
PER 2026e |
Last Updated |
| 3.5 |
7.1 |
76.8 |
40.3 |
46.5 |
33.6 |
76.4 |
29.4 |
21/4/25 |
AMZN Yearly Price Earnings Ratio (PER) Highs and Lows
✅✅
AMZN Weekly Price Chart with Average True Range (ATR) Trailing Stop (10-Year View)
Ticker code: AMP
AMP Red Flags & Risk Indicators
⚠️
⚠️ RED FLAGS: 2 identified
- Falling Revenues
- More Net Debt Than Equity
Income Statement
| Revenue 2024 Per Share |
Revenue 2025e Per Share |
Revenue 2026e Per Share |
Revenue 24 to 25e [%] |
Revenue 25e to 26e [%] |
EBITDA 2024 Per Share |
EBITDA 2025e Per Share |
EBITDA 2026e Per Share |
EBITDA 24 to 25e [%] |
EBITDA 25e to 26e [%] |
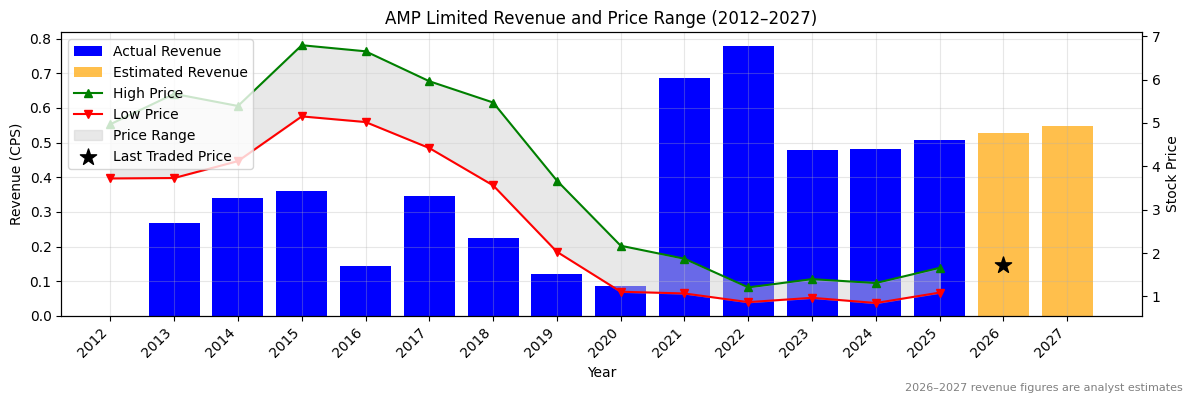
| 0.48211 |
0.50637 |
0.52844 |
5.0 |
4.4 |
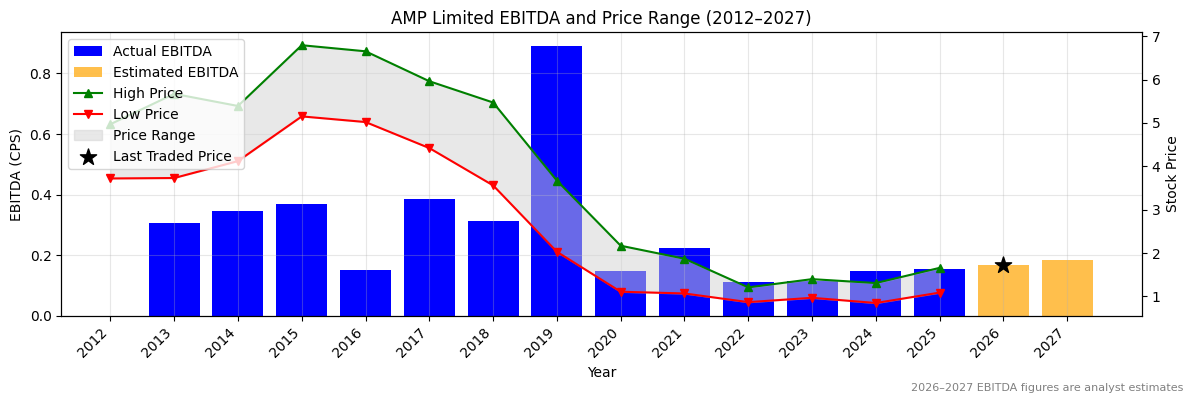
0.14748 |
0.15316 |
0.16893 |
3.8 |
10.3 |
AMP Revenue Per Share (2012–2027)
✅
AMP Earnings before Interest, Tax, Depreciation and Amortisation (EBITDA) Per Share (2012–2027)
✅
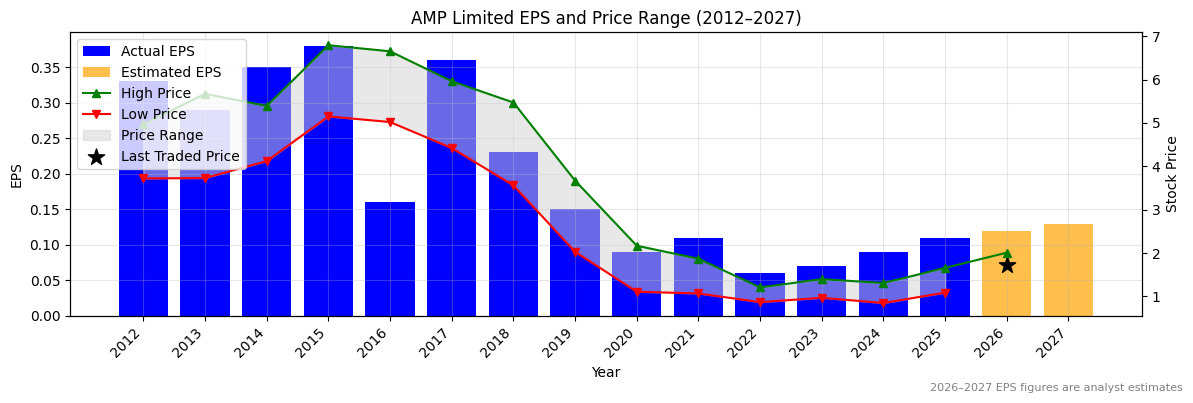
AMP Normalised Earnings Per Share (EPS) (2012–2027)
✅✅
Valuation
| Price To Sales |
Price To Book |
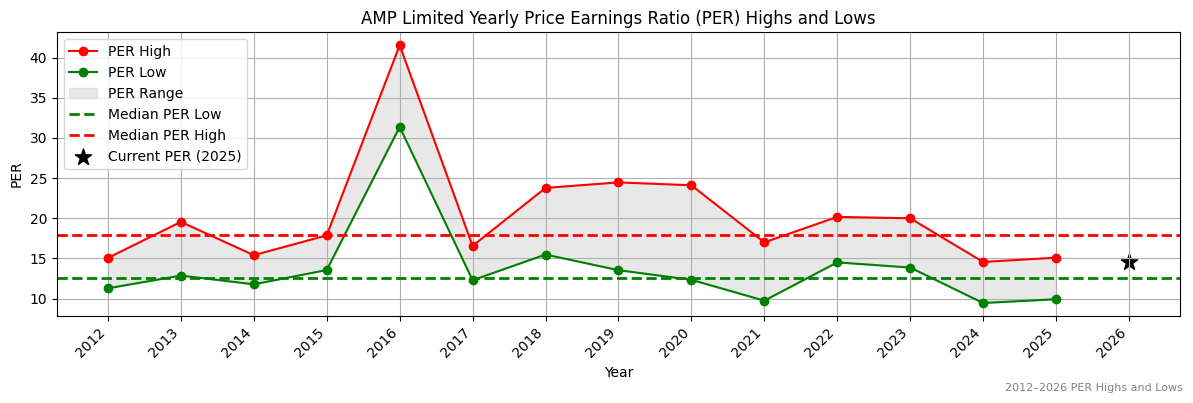
PER 2023 |
PER 2024 |
13Y Median PER Low |
PER 2025e |
13Y Median PER High |
PER 2026e |
Last Updated |
| 1.6 |
1.2 |
25.5 |
19.8 |
12.6 |
16.2 |
17.9 |
14.9 |
20/10/25 |
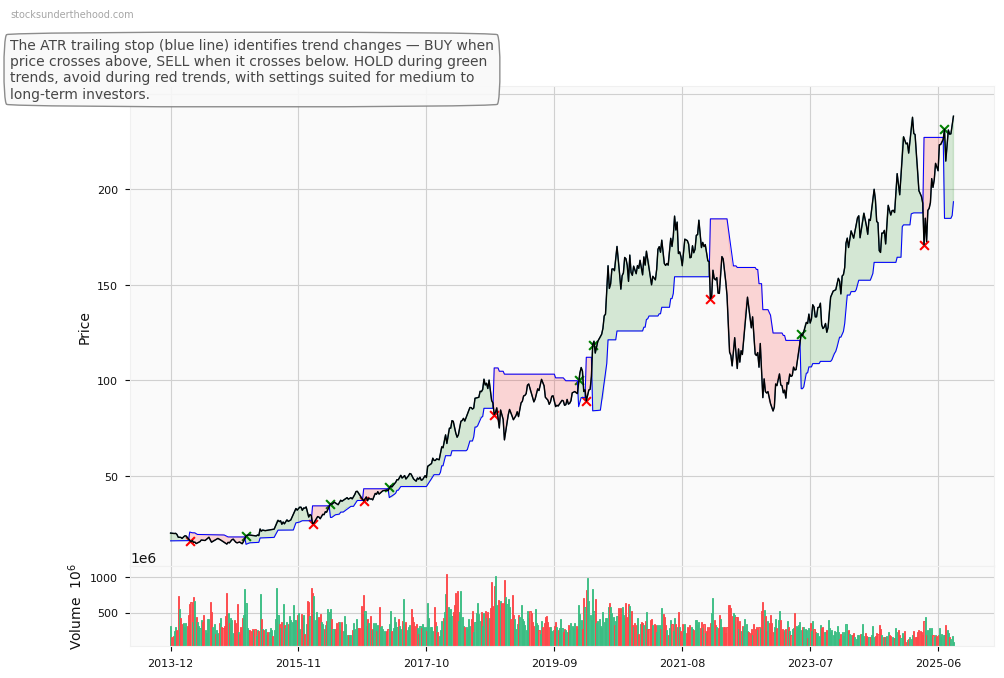
AMP Yearly Price Earnings Ratio (PER) Highs and Lows
✅
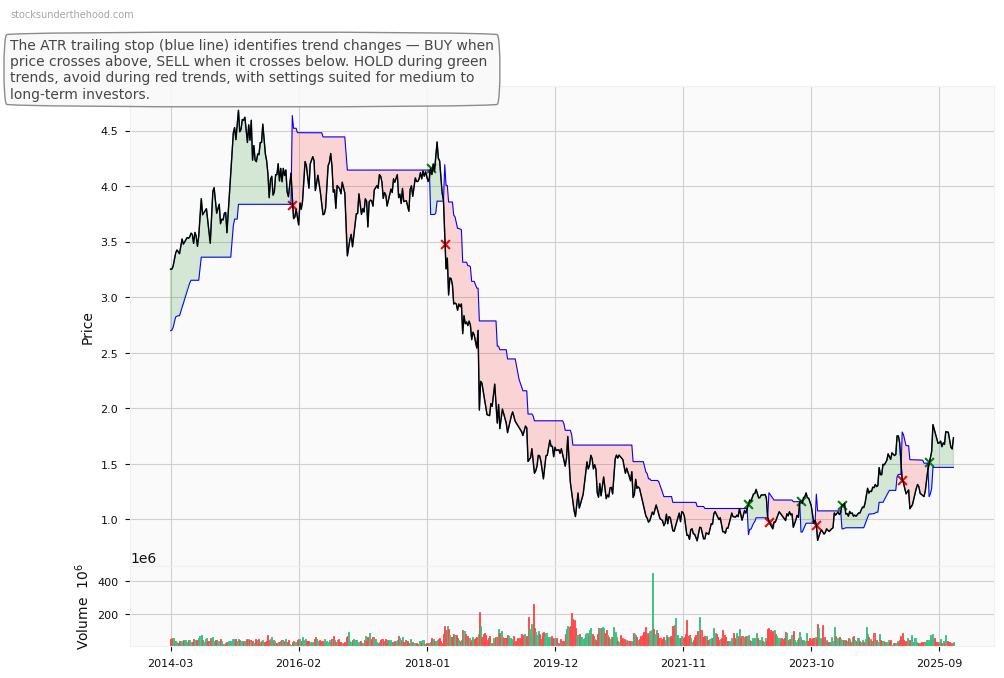
AMP Weekly Price Chart with Average True Range (ATR) Trailing Stop (10-Year View)
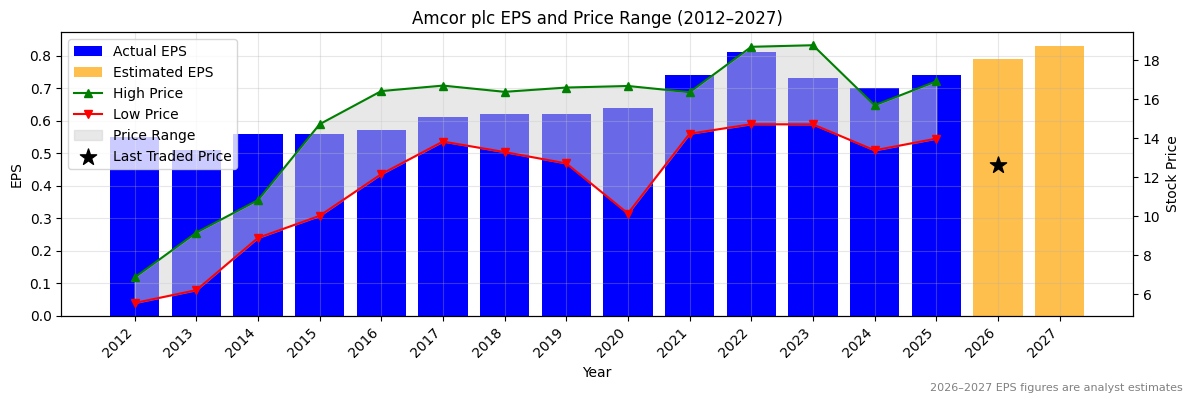
Ticker code: AMC
AMC Red Flags & Risk Indicators
⚠️
⚠️ RED FLAGS: 2 identified
- Increasing Shorts
- More Net Debt Than Equity
Income Statement
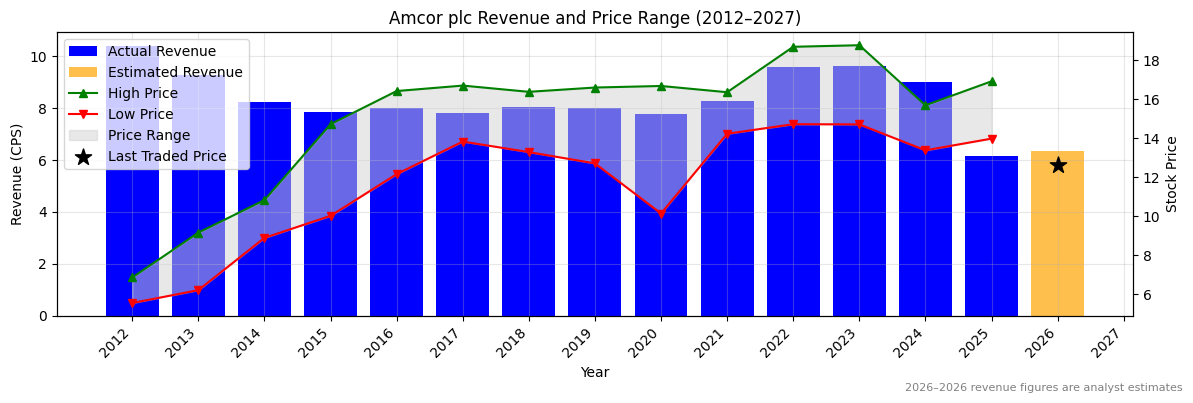
| Revenue 2024 Per Share |
Revenue 2025e Per Share |
Revenue 2026e Per Share |
Revenue 24 to 25e [%] |
Revenue 25e to 26e [%] |
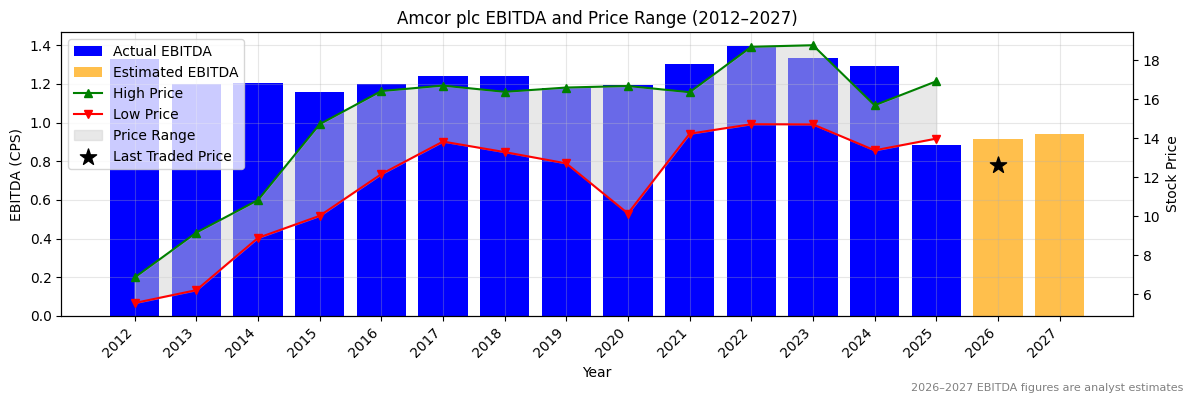
EBITDA 2024 Per Share |
EBITDA 2025e Per Share |
EBITDA 2026e Per Share |
EBITDA 24 to 25e [%] |
EBITDA 25e to 26e [%] |
| 8.99736 |
6.14147 |
6.34723 |
-31.7 |
3.4 |
1.2942 |
0.88477 |
0.91239 |
-31.6 |
3.1 |
AMC Revenue Per Share (2012–2027)
❌
AMC Earnings before Interest, Tax, Depreciation and Amortisation (EBITDA) Per Share (2012–2027)
❌
AMC Normalised Earnings Per Share (EPS) (2012–2027)
✅
Valuation
| Price To Sales |
Price To Book |
PER 2023 |
PER 2024 |
13Y Median PER Low |
PER 2025e |
13Y Median PER High |
PER 2026e |
Last Updated |
| 1.9 |
2.4 |
16.6 |
17.3 |
19.0 |
16.3 |
24.4 |
15.3 |
11/3/25 |
AMC Yearly Price Earnings Ratio (PER) Highs and Lows
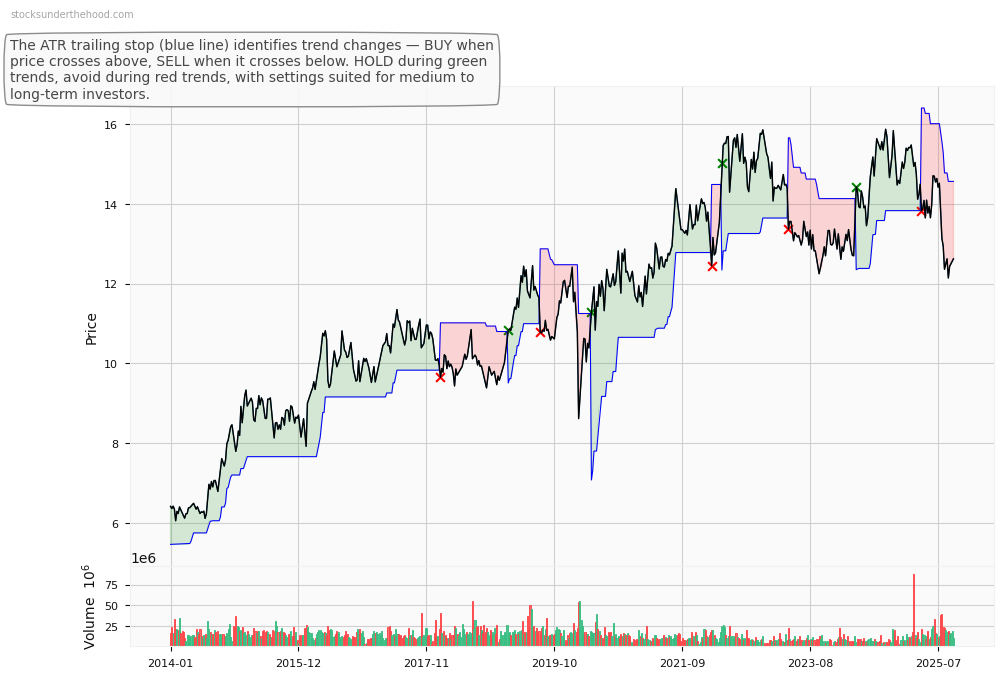
✅✅
AMC Weekly Price Chart with Average True Range (ATR) Trailing Stop (10-Year View)
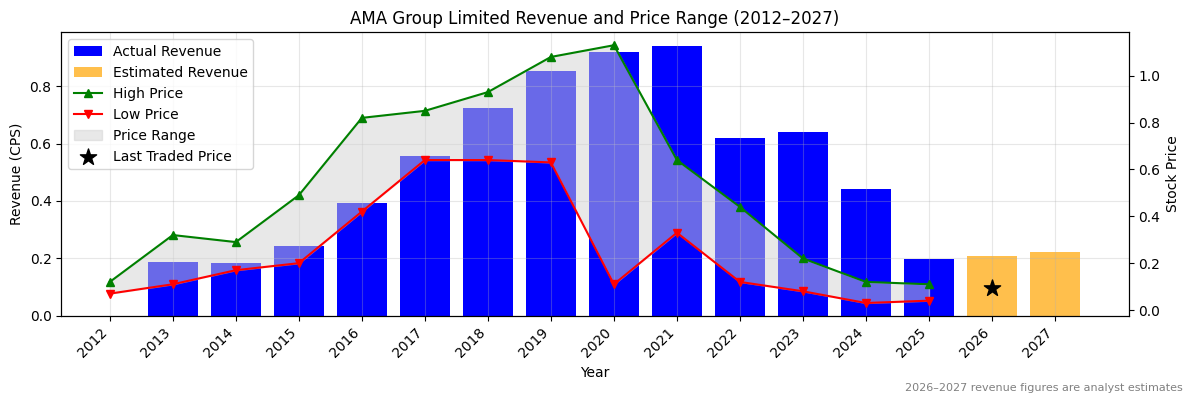
Ticker code: AMA
AMA Red Flags & Risk Indicators
❌
⚠️ RED FLAGS: 5 identified
- Large Share Issuance
- Low Operating Margin
- Falling Revenues
- More Net Debt Than Equity
- High Relative Valuation
Income Statement
| Revenue 2024 Per Share |
Revenue 2025e Per Share |
Revenue 2026e Per Share |
Revenue 24 to 25e [%] |
Revenue 25e to 26e [%] |
EBITDA 2024 Per Share |
EBITDA 2025e Per Share |
EBITDA 2026e Per Share |
EBITDA 24 to 25e [%] |
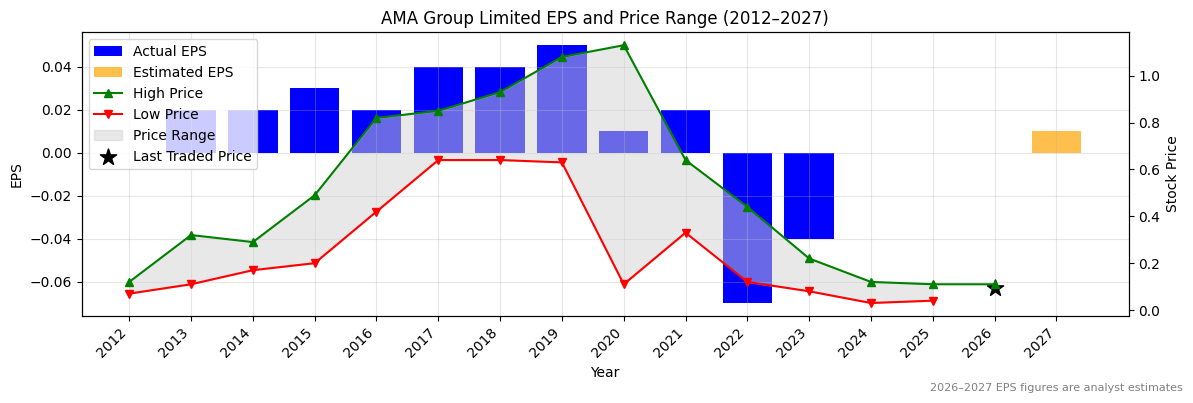
EBITDA 25e to 26e [%] |
| 0.44297 |
0.19729 |
0.21019 |
-55.5 |
6.5 |
0.04555 |
0.02239 |
0.02498 |
-50.8 |
11.5 |
AMA Revenue Per Share (2012–2027)
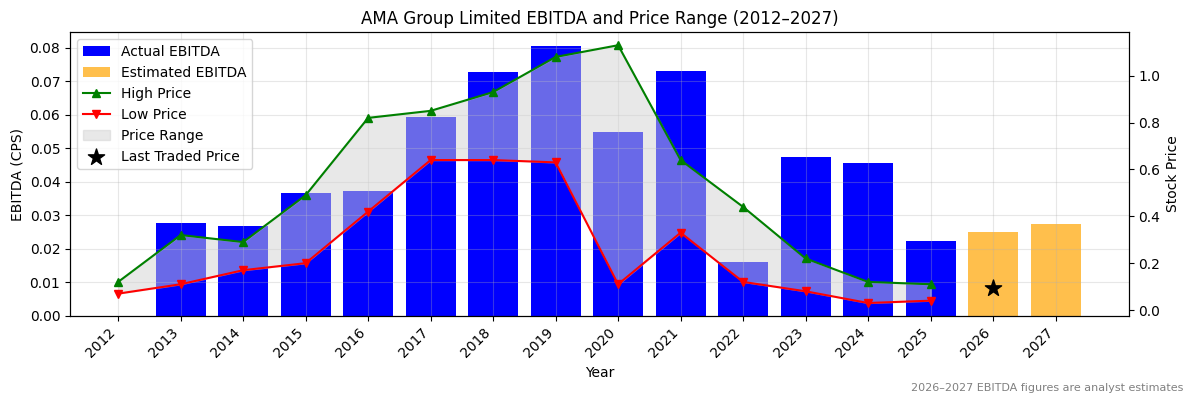
❌
AMA Earnings before Interest, Tax, Depreciation and Amortisation (EBITDA) Per Share (2012–2027)
❌
AMA Normalised Earnings Per Share (EPS) (2012–2027)
Valuation
| Price To Sales |
Price To Book |
PER 2023 |
PER 2024 |
13Y Median PER Low |
PER 2025e |
13Y Median PER High |
PER 2026e |
Last Updated |
| 0.4 |
2.0 |
-2.3 |
None |
12.6 |
None |
21.6 |
None |
22/5/25 |
AMA Yearly Price Earnings Ratio (PER) Highs and Lows
AMA Weekly Price Chart with Average True Range (ATR) Trailing Stop (10-Year View)
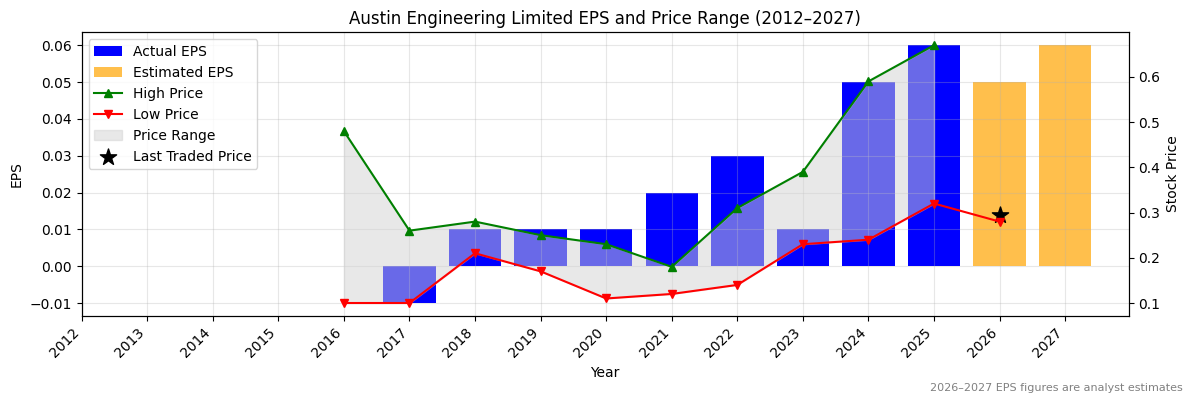
Ticker code: ALX
ALX Red Flags & Risk Indicators
⚠️
⚠️ RED FLAGS: 1 identified
Income Statement
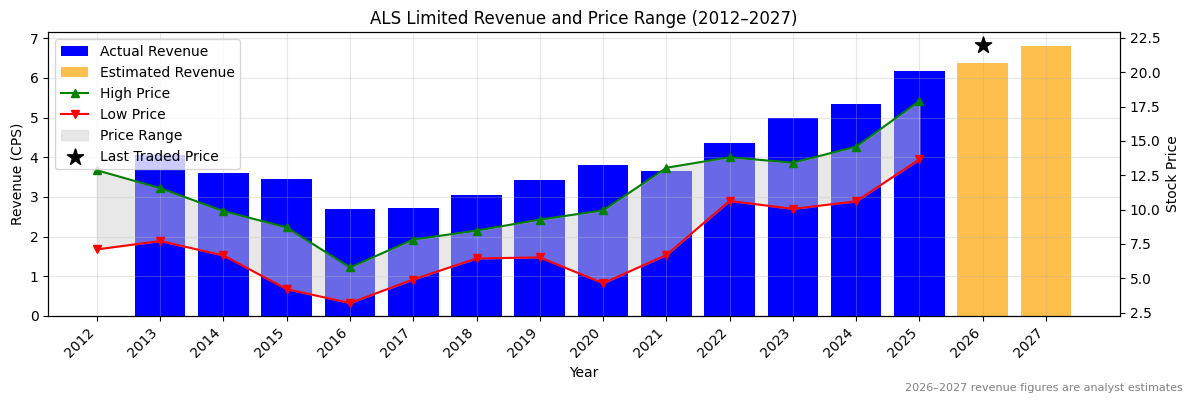
| Revenue 2024 Per Share |
Revenue 2025e Per Share |
Revenue 2026e Per Share |
Revenue 24 to 25e [%] |
Revenue 25e to 26e [%] |
EBITDA 2024 Per Share |
EBITDA 2025e Per Share |
EBITDA 2026e Per Share |
EBITDA 24 to 25e [%] |
EBITDA 25e to 26e [%] |
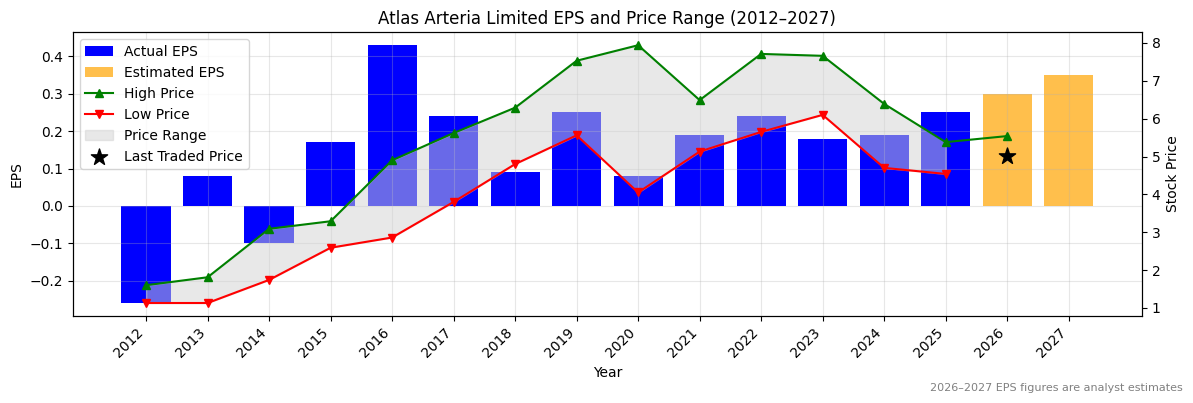
| 0.10056 |
0.1061 |
0.11076 |
5.5 |
4.4 |
0.04363 |
0.05664 |
0.06096 |
29.8 |
7.6 |
ALX Revenue Per Share (2012–2027)
✅
ALX Earnings before Interest, Tax, Depreciation and Amortisation (EBITDA) Per Share (2012–2027)
✅✅
ALX Normalised Earnings Per Share (EPS) (2012–2027)
✅✅
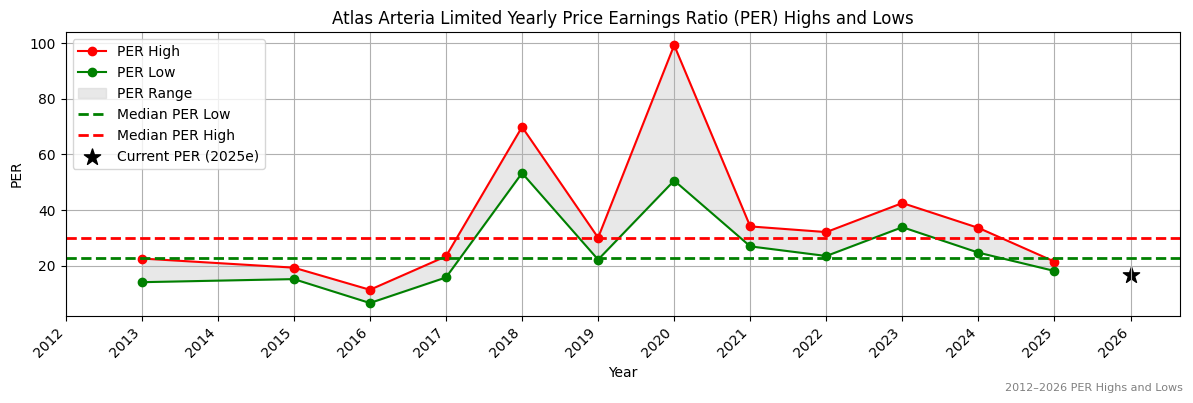
Valuation
| Price To Sales |
Price To Book |
PER 2023 |
PER 2024 |
13Y Median PER Low |
PER 2025e |
13Y Median PER High |
PER 2026e |
Last Updated |
| 45.8 |
1.2 |
27.0 |
25.6 |
22.9 |
19.4 |
30.1 |
16.2 |
30/5/25 |
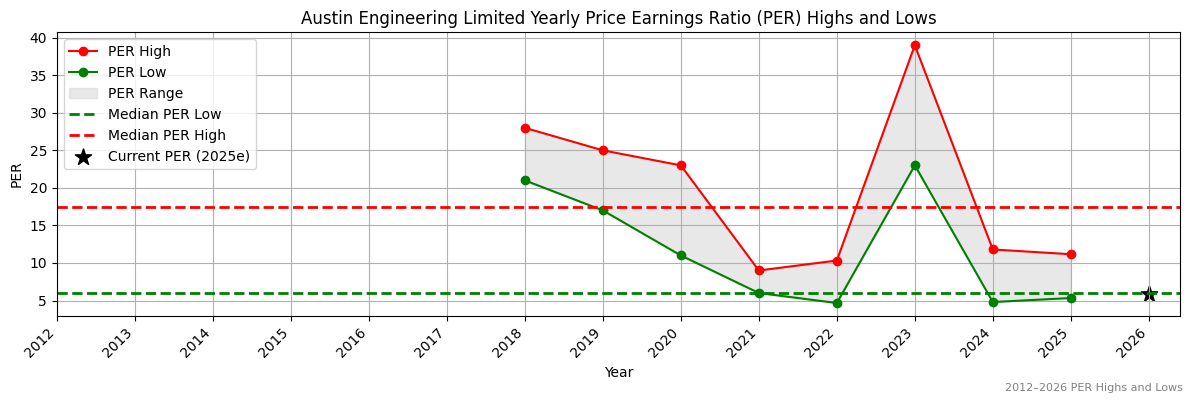
ALX Yearly Price Earnings Ratio (PER) Highs and Lows
✅✅
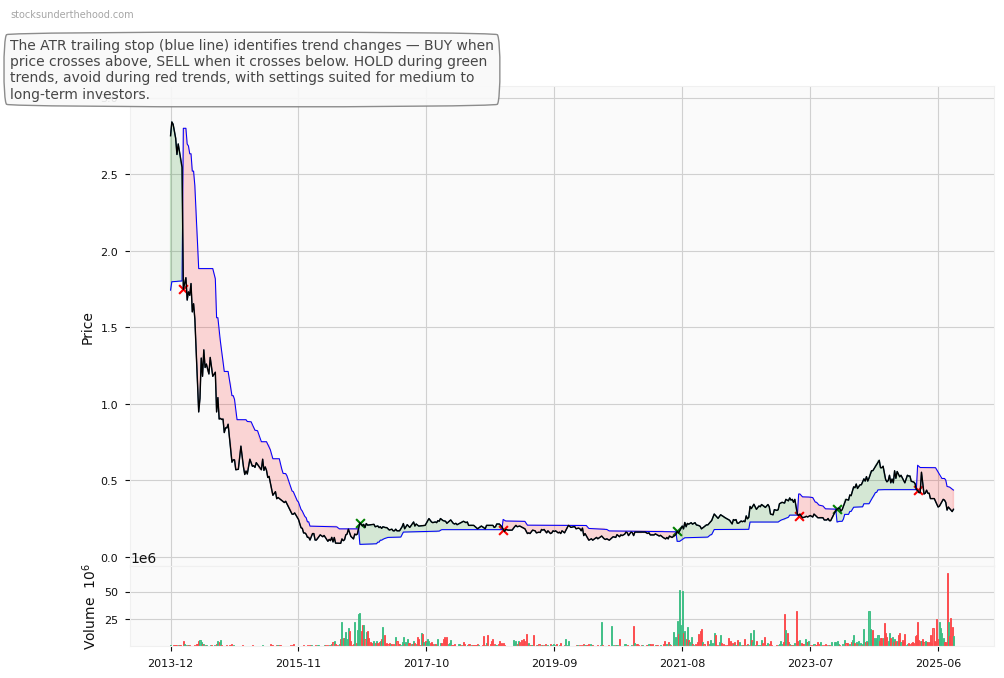
ALX Weekly Price Chart with Average True Range (ATR) Trailing Stop (10-Year View)
Ticker code: ALQ
ALQ Red Flags & Risk Indicators
❌
⚠️ RED FLAGS: 3 identified
- More Net Debt Than Equity
- High Relative Valuation
- Falling EBITDA Margins
Income Statement
| Revenue 2024 Per Share |
Revenue 2025 Per Share |
Revenue 2026e Per Share |
Revenue 24 to 25 [%] |
Revenue 25 to 26e [%] |
EBITDA 2024 Per Share |
EBITDA 2025 Per Share |
EBITDA 2026e Per Share |
EBITDA 24to25 [%] |
EBITDA 25to26e [%] |
| 5.34077 |
6.18561 |
6.37469 |
15.8 |
3.1 |
1.37485 |
1.50072 |
1.59393 |
9.2 |
6.2 |
ALQ Revenue Per Share (2012–2027)
✅
ALQ Earnings before Interest, Tax, Depreciation and Amortisation (EBITDA) Per Share (2012–2027)
❌
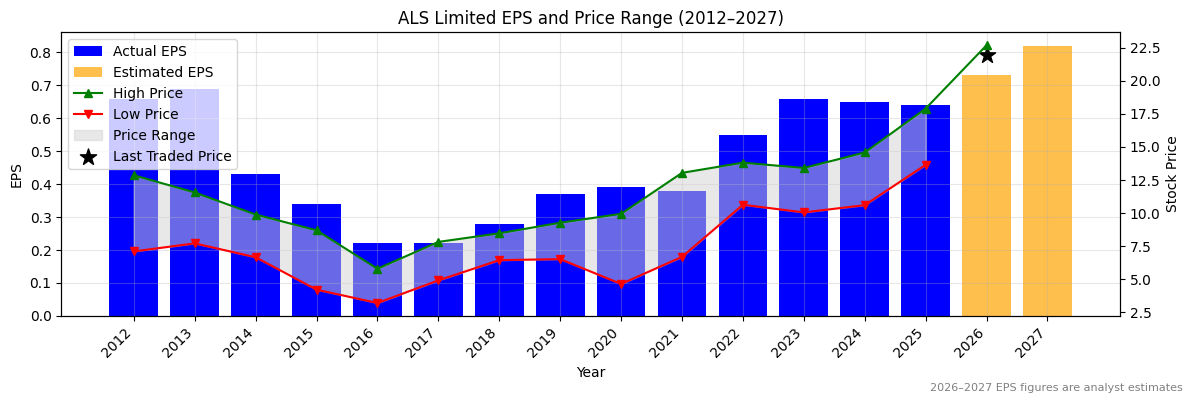
ALQ Normalised Earnings Per Share (EPS) (2012–2027)
❌
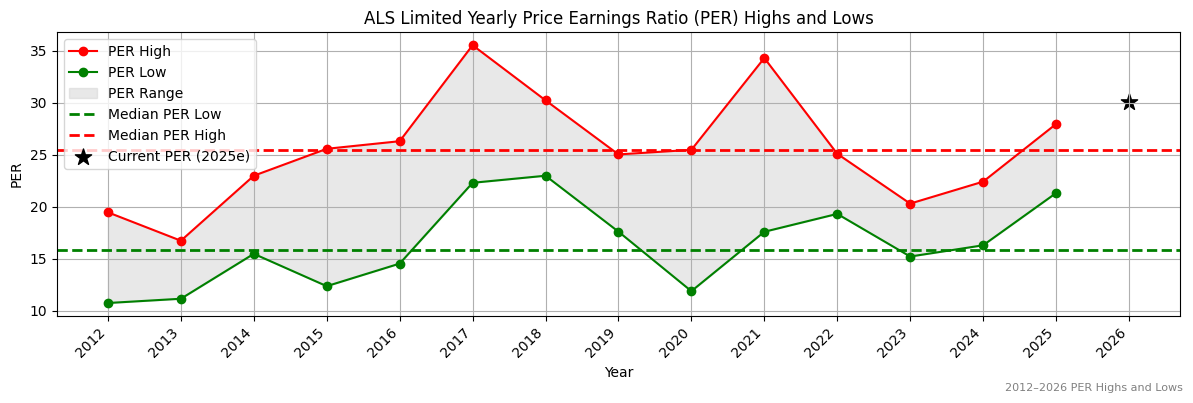
Valuation
| Price To Sales |
Price To Book |
PER 2023 |
PER 2024 |
13Y Median PER Low |
PER 2025 |
13Y Median PER High |
PER 2026e |
Last Updated |
| 3.7 |
8.2 |
32.9 |
33.4 |
15.9 |
33.9 |
25.5 |
29.8 |
26/10/25 |
ALQ Yearly Price Earnings Ratio (PER) Highs and Lows
❌
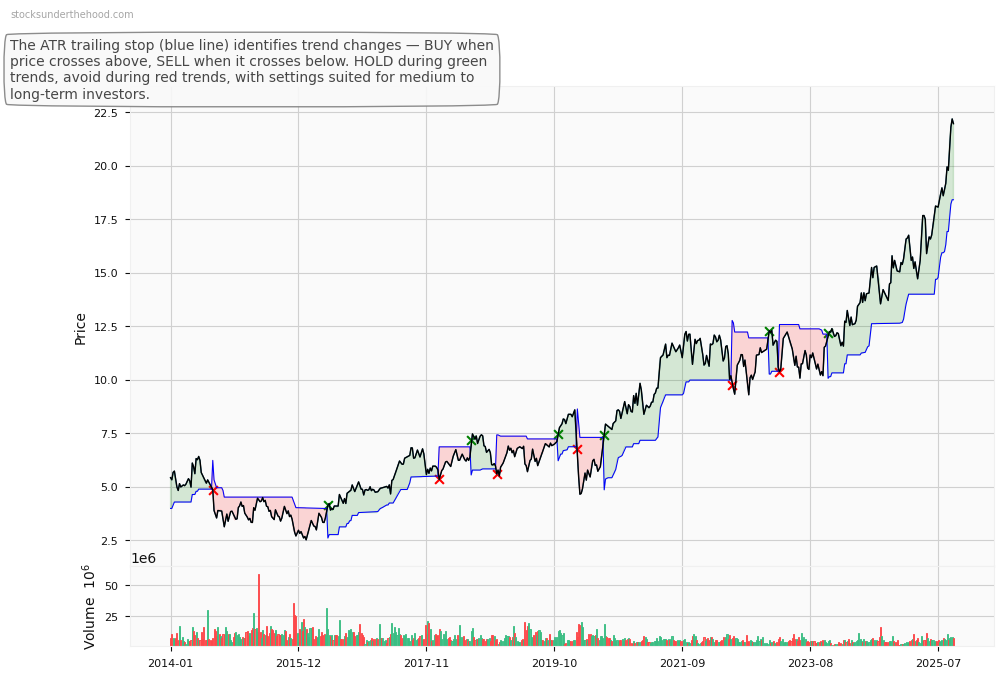
ALQ Weekly Price Chart with Average True Range (ATR) Trailing Stop (10-Year View)
Ticker code: ALL
ALL Red Flags & Risk Indicators
✅
⚠️ RED FLAGS: 0 identified
No red flags detected.
Income Statement
| Revenue 2024 Per Share |
Revenue 2025 Per Share |
Revenue 2026e Per Share |
Revenue 24 to 25 [%] |
Revenue 25 to 26e [%] |
EBITDA 2024 Per Share |
EBITDA 2025 Per Share |
EBITDA 2026e Per Share |
EBITDA 24to25 [%] |
EBITDA 25to26e [%] |
| 10.4919 |
9.97882 |
10.74063 |
-4.9 |
7.6 |
3.92294 |
4.12005 |
4.48988 |
5.0 |
9.0 |
ALL Revenue Per Share (2012–2027)
❌
ALL Earnings before Interest, Tax, Depreciation and Amortisation (EBITDA) Per Share (2012–2027)
❌
ALL Normalised Earnings Per Share (EPS) (2012–2027)
❌
Valuation
| Price To Sales |
Price To Book |
PER 2023 |
PER 2024 |
13Y Median PER Low |
PER 2025 |
13Y Median PER High |
PER 2026e |
Last Updated |
| 5.7 |
5.5 |
31.4 |
26.1 |
16.4 |
25.8 |
26.3 |
22.5 |
24/7/25 |
ALL Yearly Price Earnings Ratio (PER) Highs and Lows
✅
ALL Weekly Price Chart with Average True Range (ATR) Trailing Stop (10-Year View)
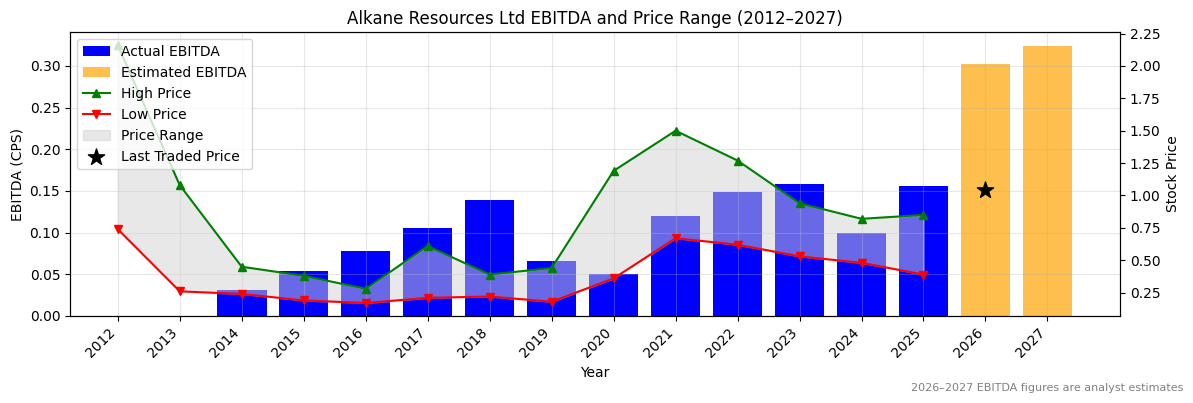
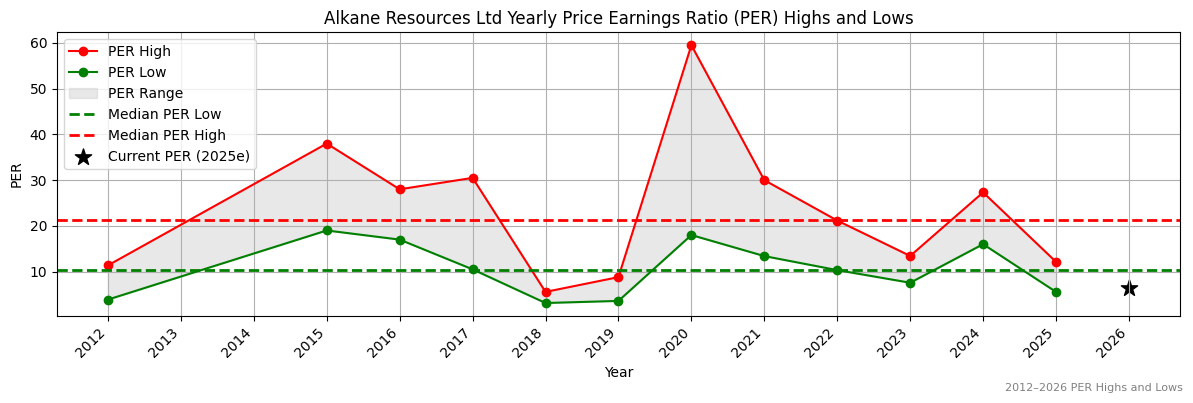
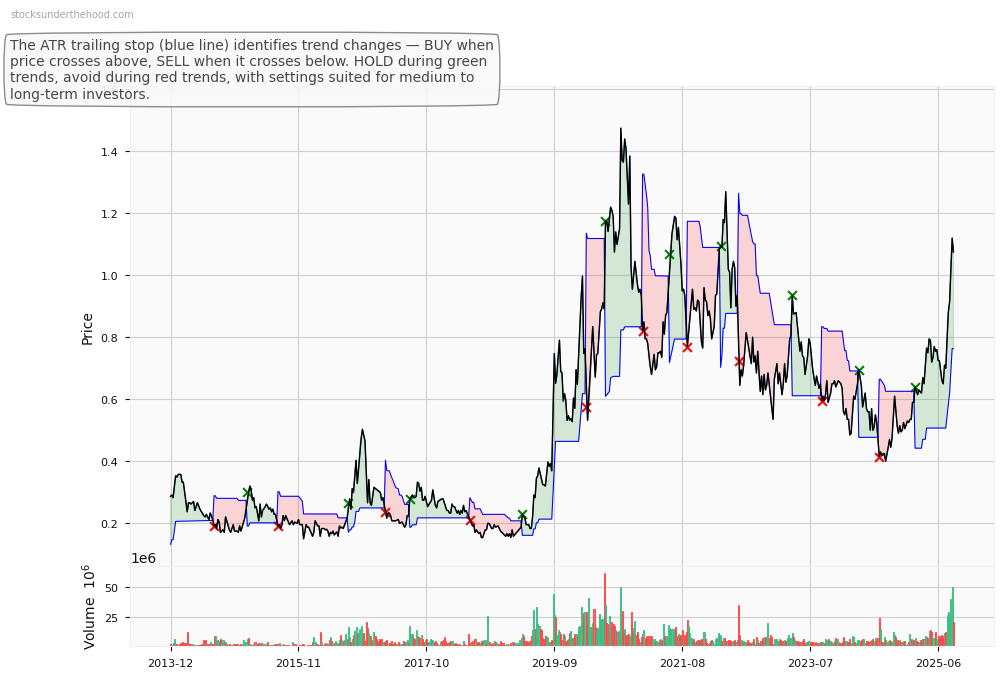
Ticker code: ALK
ALK Red Flags & Risk Indicators
✅
⚠️ RED FLAGS: 0 identified
No red flags detected.
Income Statement
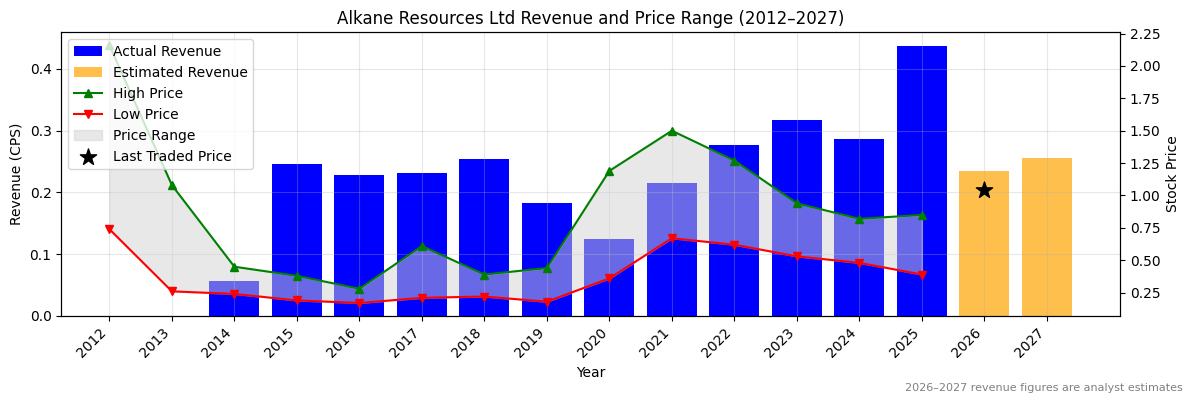
| Revenue 2024 Per Share |
Revenue 2025 Per Share |
Revenue 2026e Per Share |
Revenue 24 to 25 [%] |
Revenue 25 to 26e [%] |
EBITDA 2024 Per Share |
EBITDA 2025 Per Share |
EBITDA 2026e Per Share |
EBITDA 24to25 [%] |
EBITDA 25to26e [%] |
| 0.28665 |
0.43732 |
0.2348 |
52.6 |
-46.3 |
0.09992 |
0.15538 |
0.30208 |
55.5 |
94.4 |
ALK Revenue Per Share (2012–2027)
✅✅
ALK Earnings before Interest, Tax, Depreciation and Amortisation (EBITDA) Per Share (2012–2027)
❌
ALK Normalised Earnings Per Share (EPS) (2012–2027)
❌
Valuation
| Price To Sales |
Price To Book |
PER 2023 |
PER 2024 |
13Y Median PER Low |
PER 2025 |
13Y Median PER High |
PER 2026e |
Last Updated |
| 5.2 |
1.8 |
14.4 |
33.5 |
10.4 |
14.4 |
21.2 |
6.3 |
11/10/25 |
ALK Yearly Price Earnings Ratio (PER) Highs and Lows
✅
ALK Weekly Price Chart with Average True Range (ATR) Trailing Stop (10-Year View)
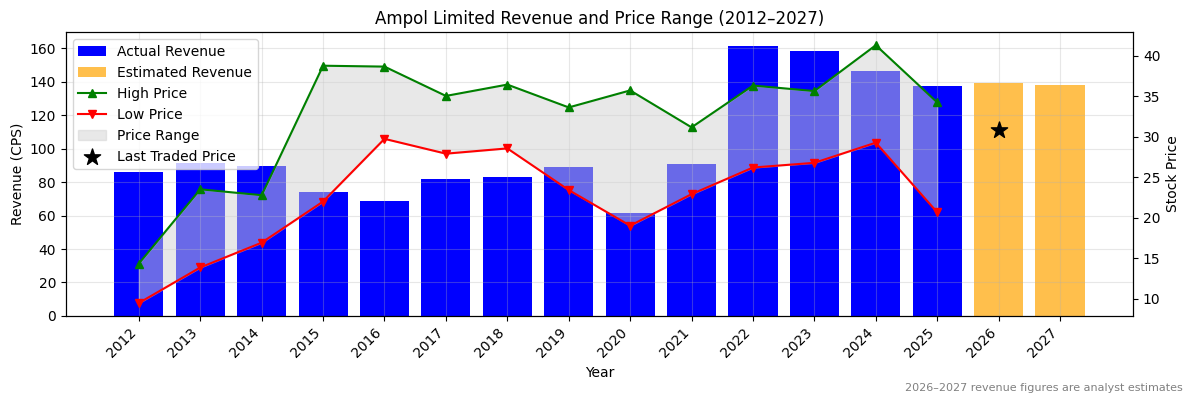
Ticker code: ALD
ALD Red Flags & Risk Indicators
⚠️
⚠️ RED FLAGS: 2 identified
- Falling Earnings
- More Net Debt Than Equity
Income Statement
| Revenue 2024 Per Share |
Revenue 2025 Per Share |
Revenue 2026e Per Share |
Revenue 24 to 25 [%] |
Revenue 25 to 26e [%] |
EBITDA 2024 Per Share |
EBITDA 2025 Per Share |
EBITDA 2026e Per Share |
EBITDA 24to25 [%] |
EBITDA 25to26e [%] |
| 146.35876 |
137.29574 |
139.37527 |
-6.2 |
1.5 |
6.96683 |
7.10565 |
7.31987 |
2.0 |
3.0 |
ALD Revenue Per Share (2012–2027)
❌
ALD Earnings before Interest, Tax, Depreciation and Amortisation (EBITDA) Per Share (2012–2027)
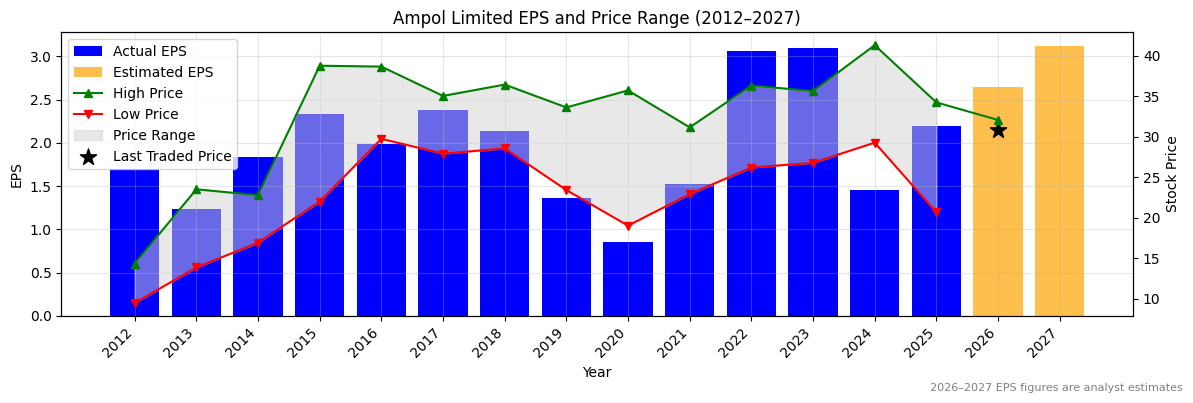
❌
ALD Normalised Earnings Per Share (EPS) (2012–2027)
❌
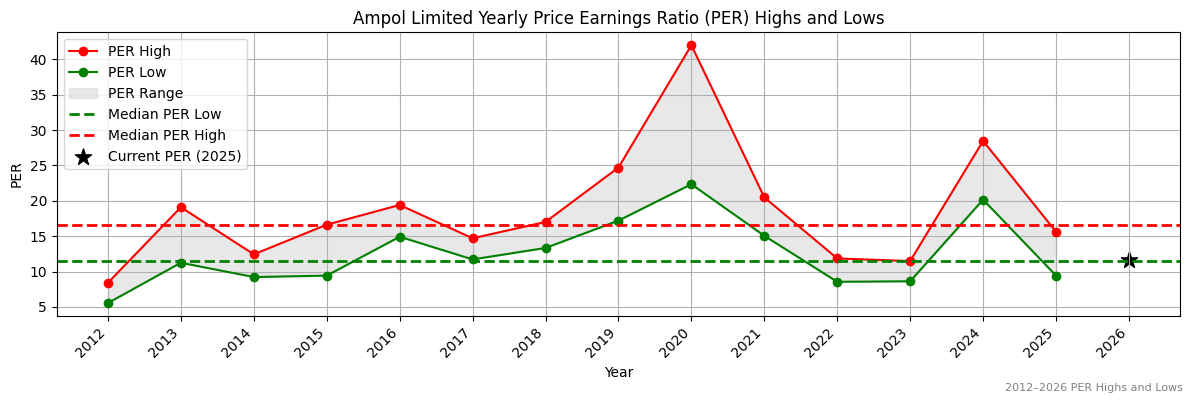
Valuation
| Price To Sales |
Price To Book |
PER 2023 |
PER 2024 |
13Y Median PER Low |
PER 2025 |
13Y Median PER High |
PER 2026e |
Last Updated |
| 0.2 |
2.3 |
9.9 |
21.2 |
11.5 |
14.0 |
16.6 |
11.6 |
6/7/24 |
ALD Yearly Price Earnings Ratio (PER) Highs and Lows
✅
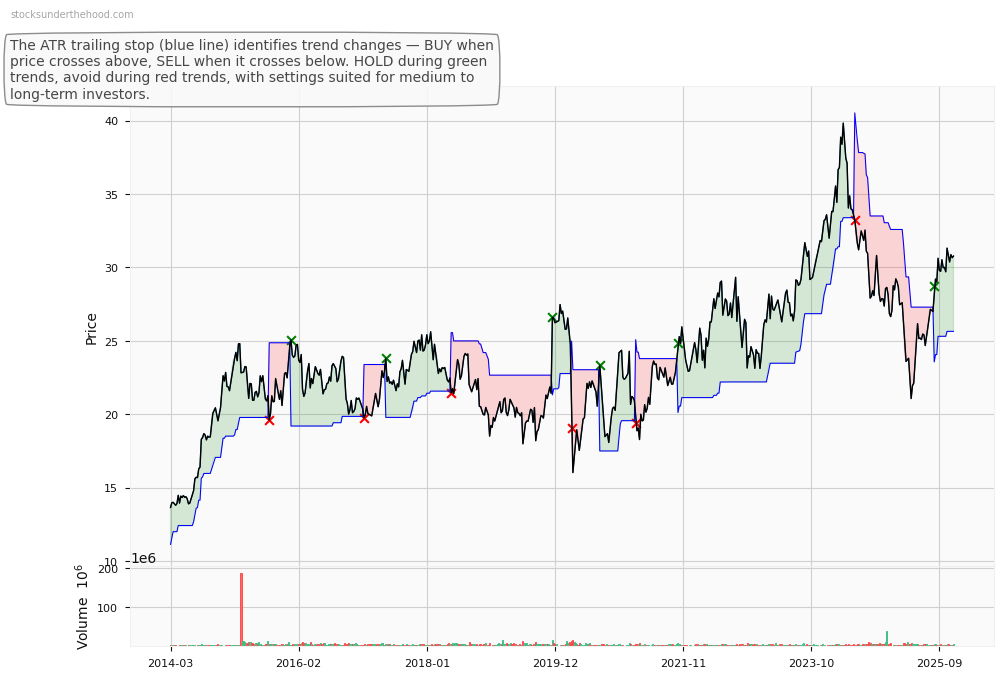
ALD Weekly Price Chart with Average True Range (ATR) Trailing Stop (10-Year View)
Ticker code: ALC
ALC Red Flags & Risk Indicators
⚠️
⚠️ RED FLAGS: 1 identified
- Negative Operating Cash Flow
Income Statement
| Revenue 2024 Per Share |
Revenue 2025 Per Share |
Revenue 2026e Per Share |
Revenue 24 to 25 [%] |
Revenue 25 to 26e [%] |
EBITDA 2024 Per Share |
EBITDA 2025 Per Share |
EBITDA 2026e Per Share |
EBITDA 24to25 [%] |
EBITDA 25to26e [%] |
| 0.0276 |
0.03038 |
0.03241 |
10.1 |
6.7 |
-0.00253 |
0.0038 |
0.00382 |
250.4 |
0.6 |
ALC Revenue Per Share (2012–2027)
✅
ALC Earnings before Interest, Tax, Depreciation and Amortisation (EBITDA) Per Share (2012–2027)
❌
ALC Normalised Earnings Per Share (EPS) (2012–2027)
❌
Valuation
| Price To Sales |
Price To Book |
PER 2023 |
PER 2024 |
13Y Median PER Low |
PER 2025 |
13Y Median PER High |
PER 2026e |
Last Updated |
| 3.1 |
1.4 |
None |
-9.3 |
None |
None |
None |
None |
20/10/25 |
ALC Yearly Price Earnings Ratio (PER) Highs and Lows
ALC Weekly Price Chart with Average True Range (ATR) Trailing Stop (10-Year View)
Ticker code: AIZ
AIZ Red Flags & Risk Indicators
⚠️
⚠️ RED FLAGS: 1 identified
Income Statement
| Revenue 2024 Per Share |
Revenue 2025 Per Share |
Revenue 2026e Per Share |
Revenue 24 to 25 [%] |
Revenue 25 to 26e [%] |
EBITDA 2024 Per Share |
EBITDA 2025 Per Share |
EBITDA 2026e Per Share |
EBITDA 24to25 [%] |
EBITDA 25to26e [%] |
| 2.00475 |
2.04728 |
2.09632 |
2.1 |
2.4 |
0.27779 |
0.30286 |
0.37383 |
9.0 |
23.4 |
AIZ Revenue Per Share (2012–2027)
✅
AIZ Earnings before Interest, Tax, Depreciation and Amortisation (EBITDA) Per Share (2012–2027)
❌
AIZ Normalised Earnings Per Share (EPS) (2012–2027)
❌
Valuation
| Price To Sales |
Price To Book |
PER 2023 |
PER 2024 |
13Y Median PER Low |
PER 2025 |
13Y Median PER High |
PER 2026e |
Last Updated |
| 0.3 |
0.9 |
None |
12.9 |
5.4 |
17.2 |
8.8 |
8.6 |
19/3/24 |
AIZ Yearly Price Earnings Ratio (PER) Highs and Lows
❌
AIZ Weekly Price Chart with Average True Range (ATR) Trailing Stop (10-Year View)
Ticker code: AIM
AIM Red Flags & Risk Indicators
⚠️
⚠️ RED FLAGS: 1 identified
Income Statement
| Revenue 2024 Per Share |
Revenue 2025 Per Share |
Revenue 2026e Per Share |
Revenue 24 to 25 [%] |
Revenue 25 to 26e [%] |
EBITDA 2024 Per Share |
EBITDA 2025 Per Share |
EBITDA 2026e Per Share |
EBITDA 24to25 [%] |
EBITDA 25to26e [%] |
| 0.31703 |
0.3108 |
0.33131 |
-2.0 |
6.6 |
0.01963 |
0.02203 |
0.02329 |
12.2 |
5.7 |
AIM Revenue Per Share (2012–2027)
❌
AIM Earnings before Interest, Tax, Depreciation and Amortisation (EBITDA) Per Share (2012–2027)
❌
AIM Normalised Earnings Per Share (EPS) (2012–2027)
❌
Valuation
| Price To Sales |
Price To Book |
PER 2023 |
PER 2024 |
13Y Median PER Low |
PER 2025 |
13Y Median PER High |
PER 2026e |
Last Updated |
| 2.9 |
2.5 |
-44.5 |
-89.0 |
None |
-890.0 |
None |
None |
3/9/25 |
AIM Yearly Price Earnings Ratio (PER) Highs and Lows
AIM Weekly Price Chart with Average True Range (ATR) Trailing Stop (10-Year View)