Ticker code: AIA
AIA Red Flags & Risk Indicators
⚠️
⚠️ RED FLAGS: 2 identified
- Increasing Shorts
- High Relative Valuation
Income Statement
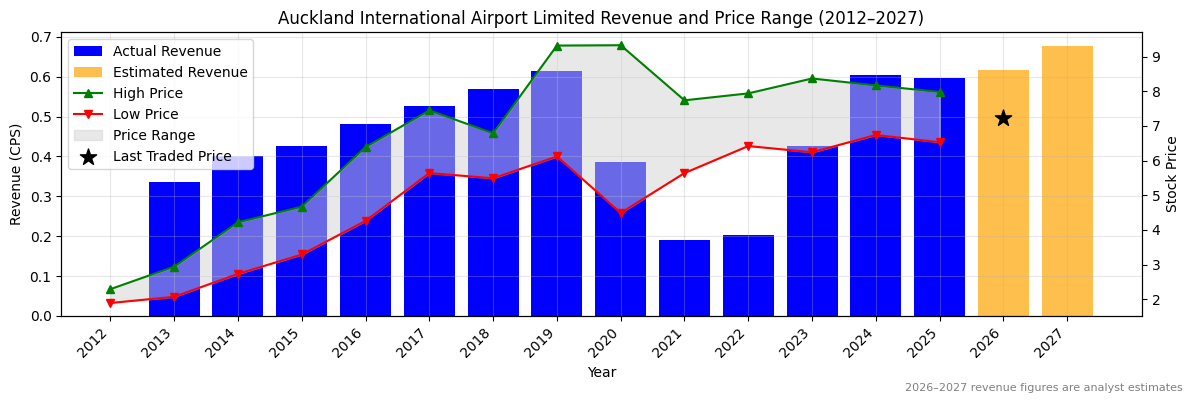
| Revenue 2024 Per Share |
Revenue 2025 Per Share |
Revenue 2026e Per Share |
Revenue 24 to 25 [%] |
Revenue 25 to 26e [%] |
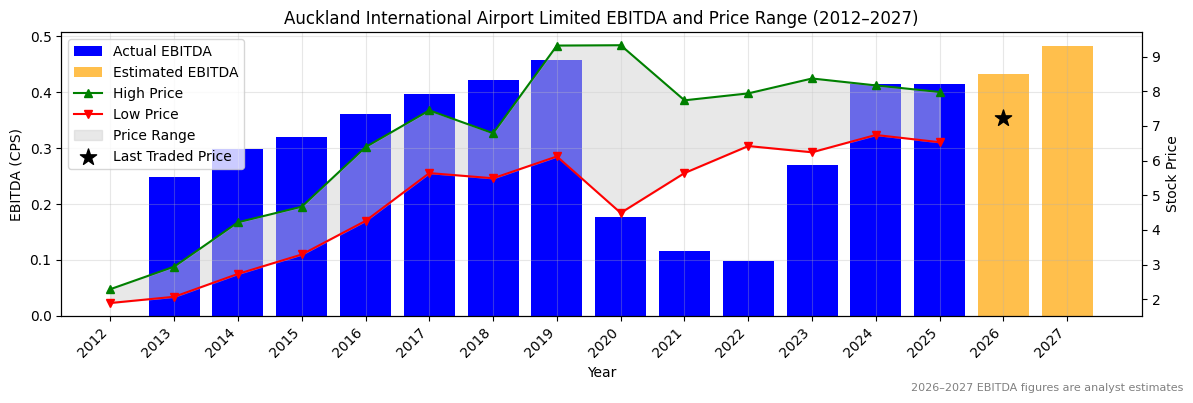
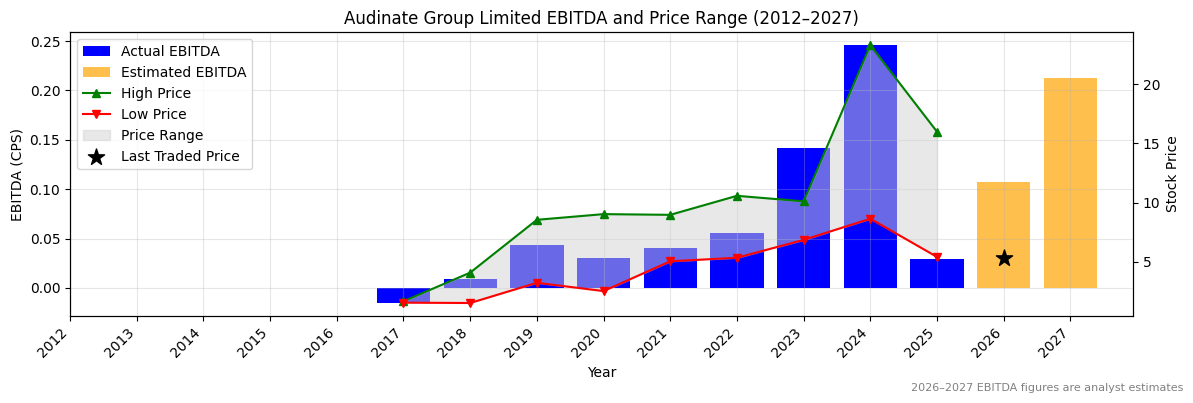
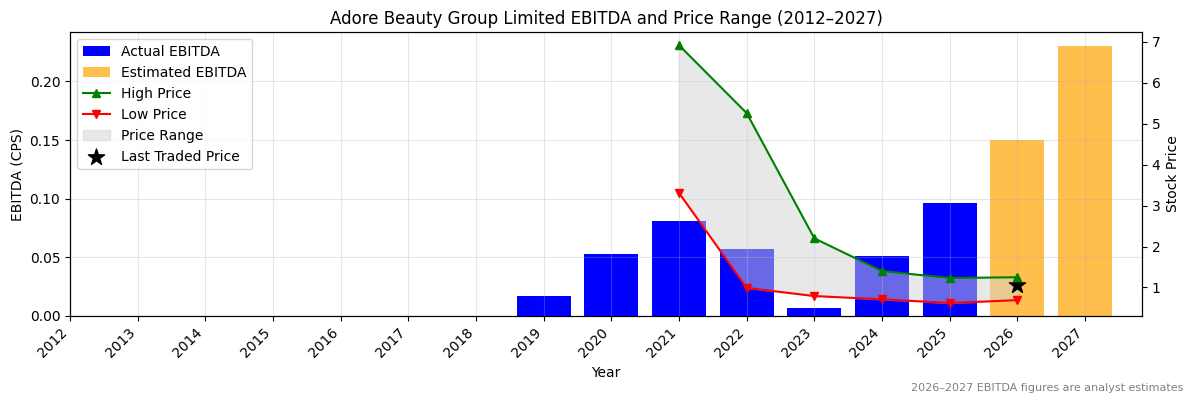
EBITDA 2024 Per Share |
EBITDA 2025 Per Share |
EBITDA 2026e Per Share |
EBITDA 24to25 [%] |
EBITDA 25to26e [%] |
| 0.60515 |
0.59739 |
0.61691 |
-1.3 |
3.3 |
0.41492 |
0.41532 |
0.43161 |
0.1 |
3.9 |
AIA Revenue Per Share (2012–2027)
❌
AIA Earnings before Interest, Tax, Depreciation and Amortisation (EBITDA) Per Share (2012–2027)
❌
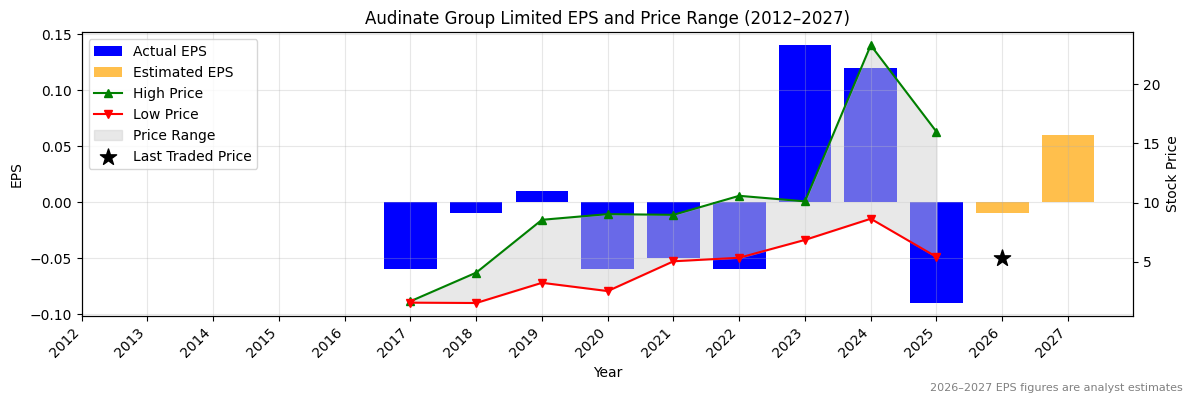
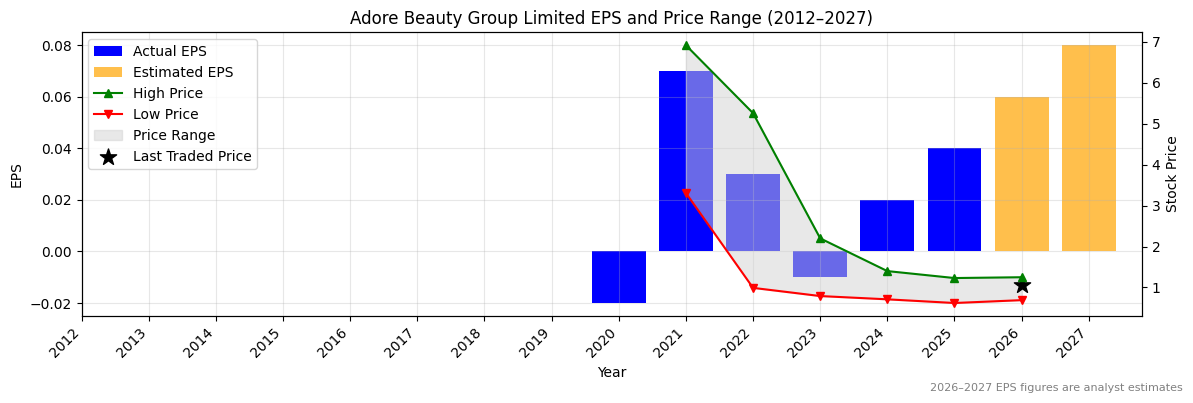
AIA Normalised Earnings Per Share (EPS) (2012–2027)
❌
Valuation
| Price To Sales |
Price To Book |
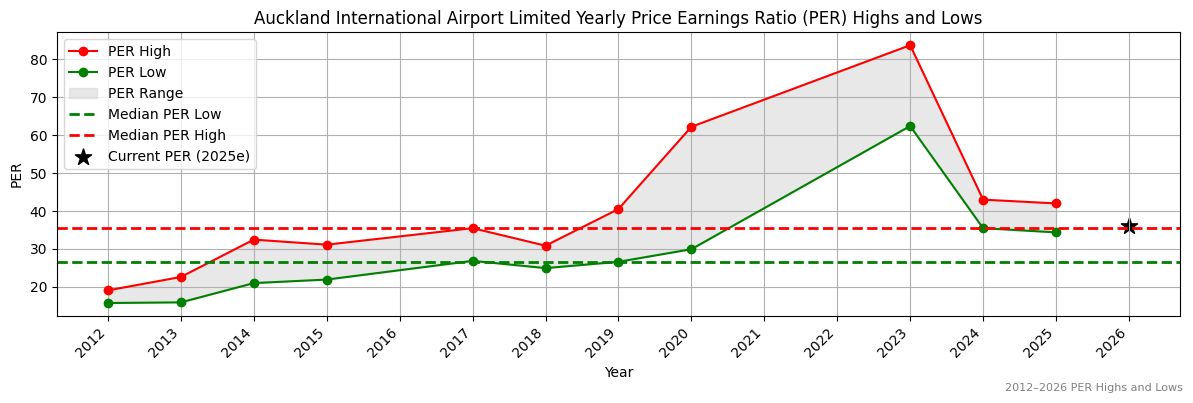
PER 2023 |
PER 2024 |
13Y Median PER Low |
PER 2025 |
13Y Median PER High |
PER 2026e |
Last Updated |
| 12.6 |
1.1 |
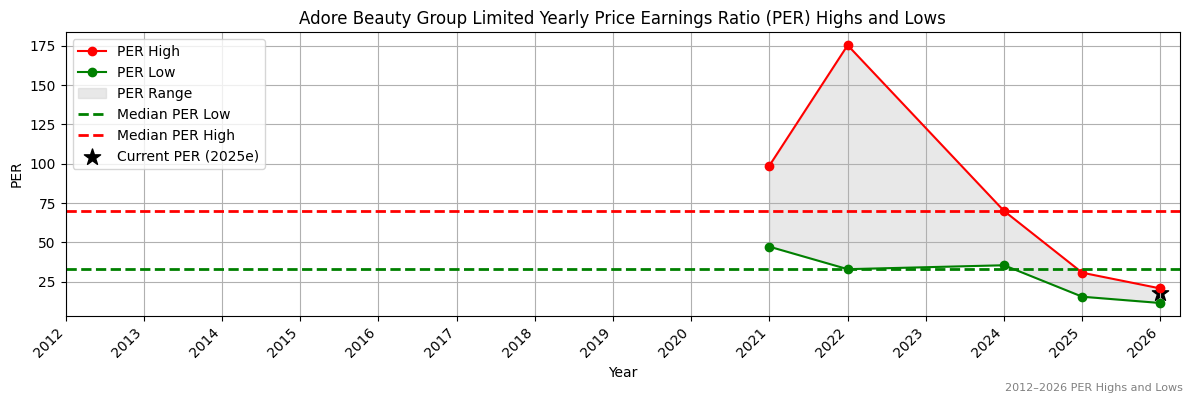
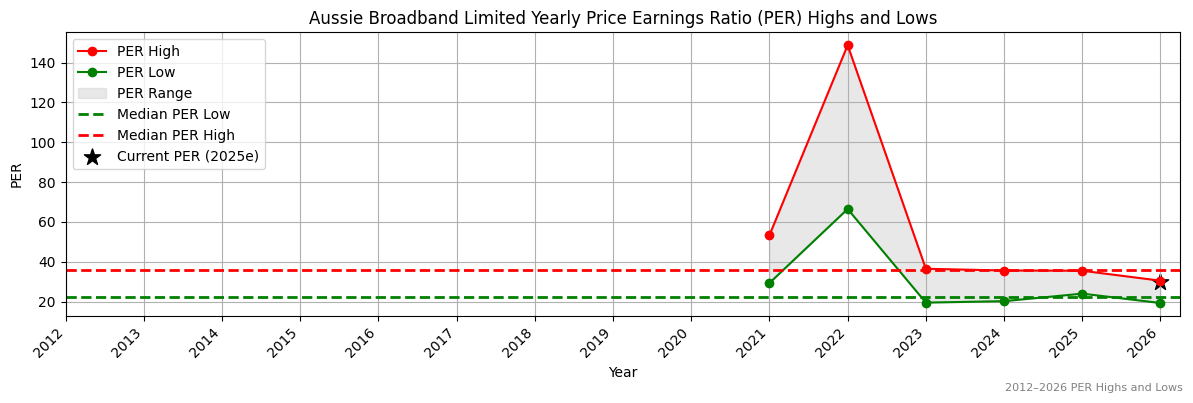
71.2 |
37.5 |
26.6 |
37.5 |
35.5 |
35.6 |
20/10/25 |
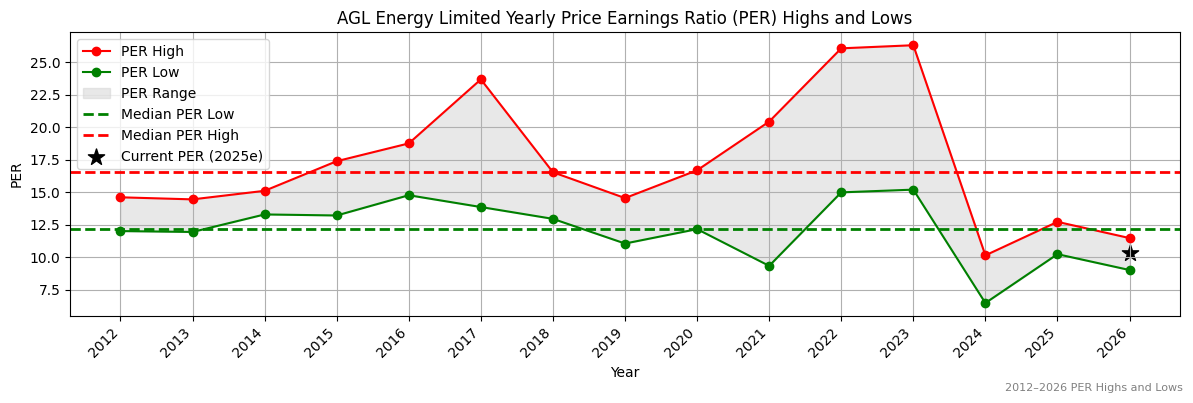
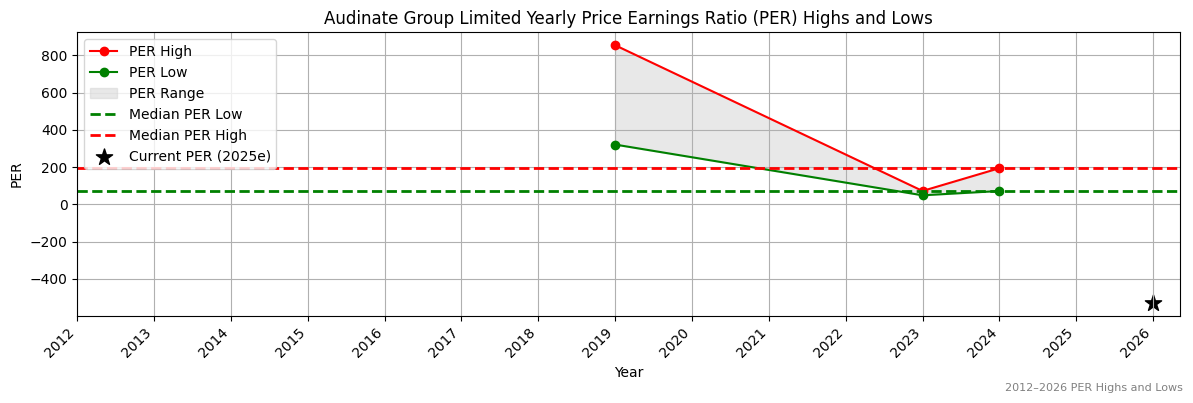
AIA Yearly Price Earnings Ratio (PER) Highs and Lows
❌
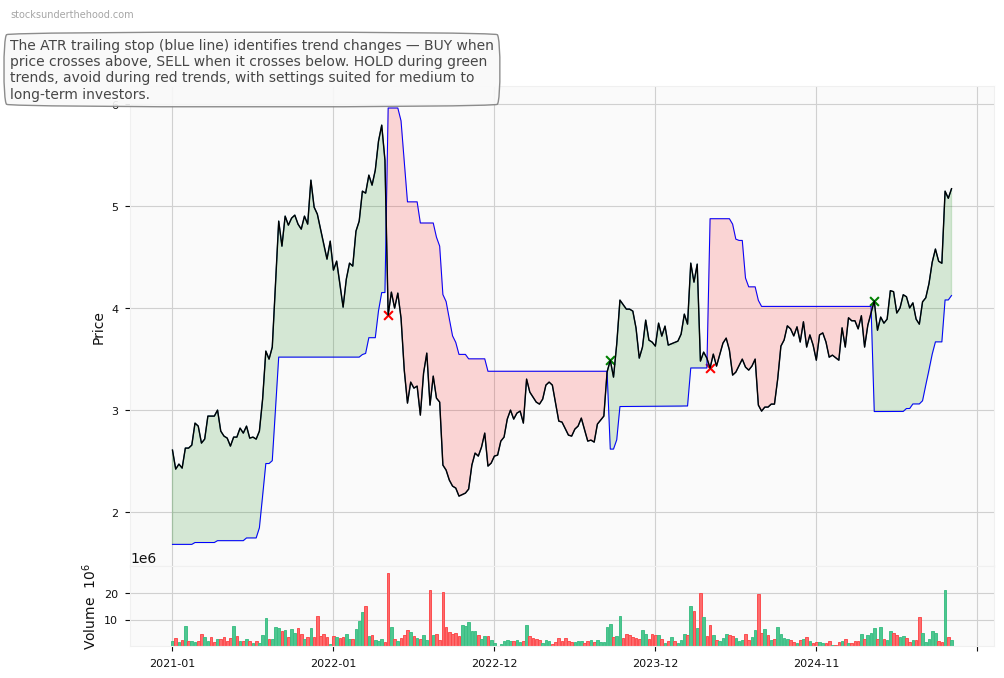
AIA Weekly Price Chart with Average True Range (ATR) Trailing Stop (10-Year View)
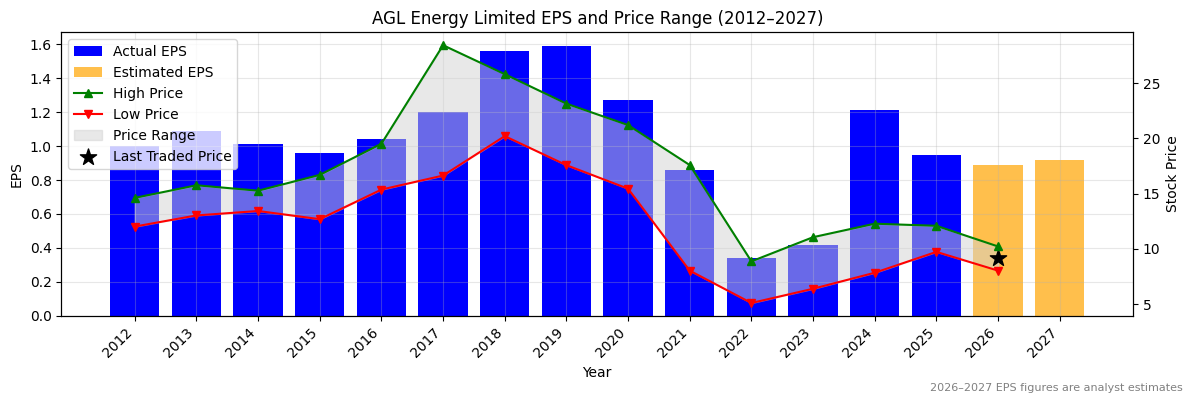
Ticker code: AGL
AGL Red Flags & Risk Indicators
❌
⚠️ RED FLAGS: 3 identified
- Falling Earnings
- Falling Revenues
- Falling EBITDA Margins
Income Statement
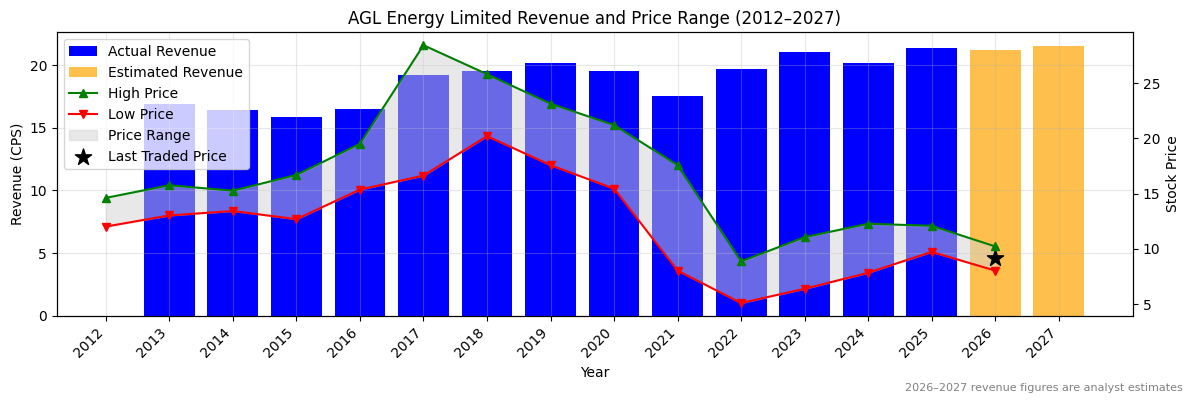
| Revenue 2024 Per Share |
Revenue 2025 Per Share |
Revenue 2026e Per Share |
Revenue 24 to 25 [%] |
Revenue 25 to 26e [%] |
EBITDA 2024 Per Share |
EBITDA 2025 Per Share |
EBITDA 2026e Per Share |
EBITDA 24to25 [%] |
EBITDA 25to26e [%] |
| 20.19035 |
21.39437 |
21.18565 |
6.0 |
-1.0 |
3.29396 |
2.98775 |
3.10064 |
-9.3 |
3.8 |
AGL Revenue Per Share (2012–2027)
✅
AGL Earnings before Interest, Tax, Depreciation and Amortisation (EBITDA) Per Share (2012–2027)
❌
AGL Normalised Earnings Per Share (EPS) (2012–2027)
❌
Valuation
| Price To Sales |
Price To Book |
PER 2023 |
PER 2024 |
13Y Median PER Low |
PER 2025 |
13Y Median PER High |
PER 2026e |
Last Updated |
| 0.4 |
1.3 |
22.0 |
7.7 |
12.2 |
9.7 |
16.6 |
10.4 |
17/8/25 |
AGL Yearly Price Earnings Ratio (PER) Highs and Lows
✅✅
AGL Weekly Price Chart with Average True Range (ATR) Trailing Stop (10-Year View)
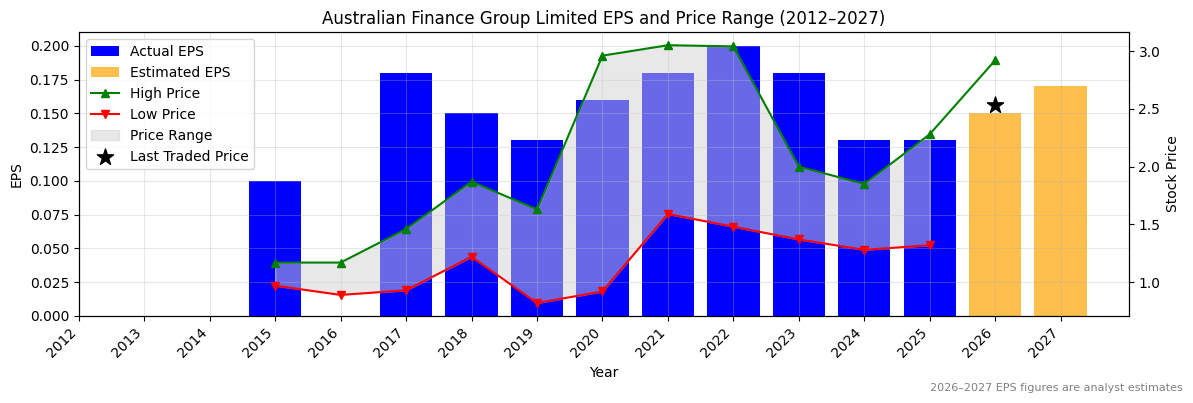
Ticker code: AFG
AFG Red Flags & Risk Indicators
❌
⚠️ RED FLAGS: 4 identified
- Low Operating Margin
- Falling Earnings
- More Net Debt Than Equity
- High Relative Valuation
Income Statement
| Revenue 2024 Per Share |
Revenue 2025 Per Share |
Revenue 2026e Per Share |
Revenue 24 to 25 [%] |
Revenue 25 to 26e [%] |
EBITDA 2024 Per Share |
EBITDA 2025 Per Share |
EBITDA 2026e Per Share |
EBITDA 24to25 [%] |
EBITDA 25to26e [%] |
| 4.00633 |
4.69702 |
4.89759 |
17.2 |
4.3 |
0.16878 |
0.20179 |
0.24702 |
19.6 |
22.4 |
AFG Revenue Per Share (2012–2027)
✅
AFG Earnings before Interest, Tax, Depreciation and Amortisation (EBITDA) Per Share (2012–2027)
❌
AFG Normalised Earnings Per Share (EPS) (2012–2027)
❌
Valuation
| Price To Sales |
Price To Book |
PER 2023 |
PER 2024 |
13Y Median PER Low |
PER 2025 |
13Y Median PER High |
PER 2026e |
Last Updated |
| 0.5 |
2.9 |
13.2 |
18.3 |
7.9 |
18.3 |
14.2 |
15.9 |
20/4/25 |
AFG Yearly Price Earnings Ratio (PER) Highs and Lows
❌
AFG Weekly Price Chart with Average True Range (ATR) Trailing Stop (10-Year View)
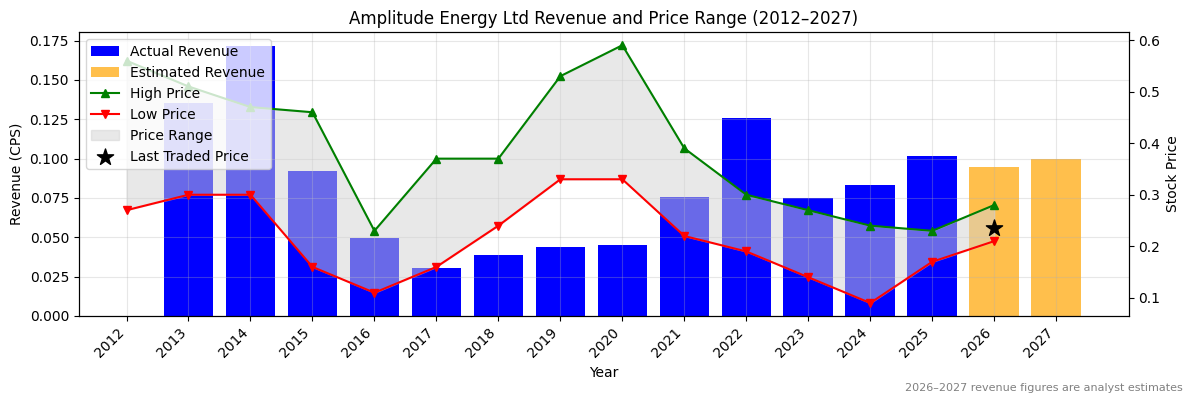
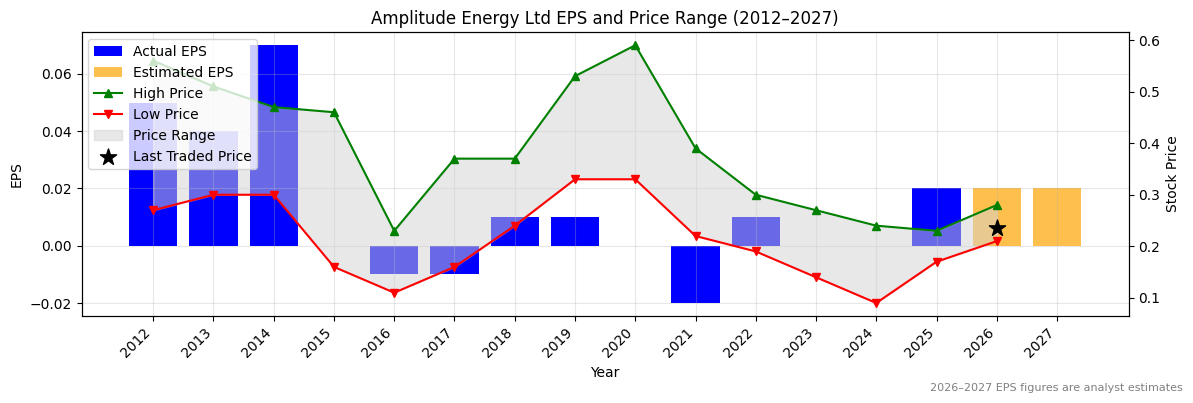
Ticker code: AEL
AEL Red Flags & Risk Indicators
⚠️
⚠️ RED FLAGS: 1 identified
Income Statement
| Revenue 2024 Per Share |
Revenue 2025 Per Share |
Revenue 2026e Per Share |
Revenue 24 to 25 [%] |
Revenue 25 to 26e [%] |
EBITDA 2024 Per Share |
EBITDA 2025 Per Share |
EBITDA 2026e Per Share |
EBITDA 24to25 [%] |
EBITDA 25to26e [%] |
| 0.08299 |
0.1014 |
0.09479 |
22.2 |
-6.5 |
0.04689 |
0.06547 |
0.06728 |
39.6 |
2.8 |
AEL Revenue Per Share (2012–2027)
✅✅
AEL Earnings before Interest, Tax, Depreciation and Amortisation (EBITDA) Per Share (2012–2027)
❌
AEL Normalised Earnings Per Share (EPS) (2012–2027)
❌
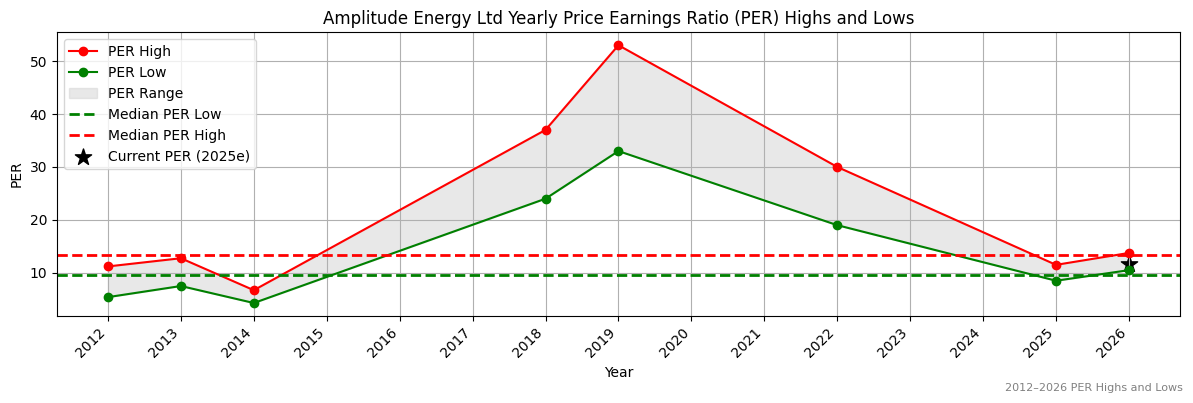
Valuation
| Price To Sales |
Price To Book |
PER 2023 |
PER 2024 |
13Y Median PER Low |
PER 2025 |
13Y Median PER High |
PER 2026e |
Last Updated |
| 2.9 |
1.7 |
None |
None |
9.5 |
12.0 |
13.3 |
12.0 |
22/8/25 |
AEL Yearly Price Earnings Ratio (PER) Highs and Lows
✅
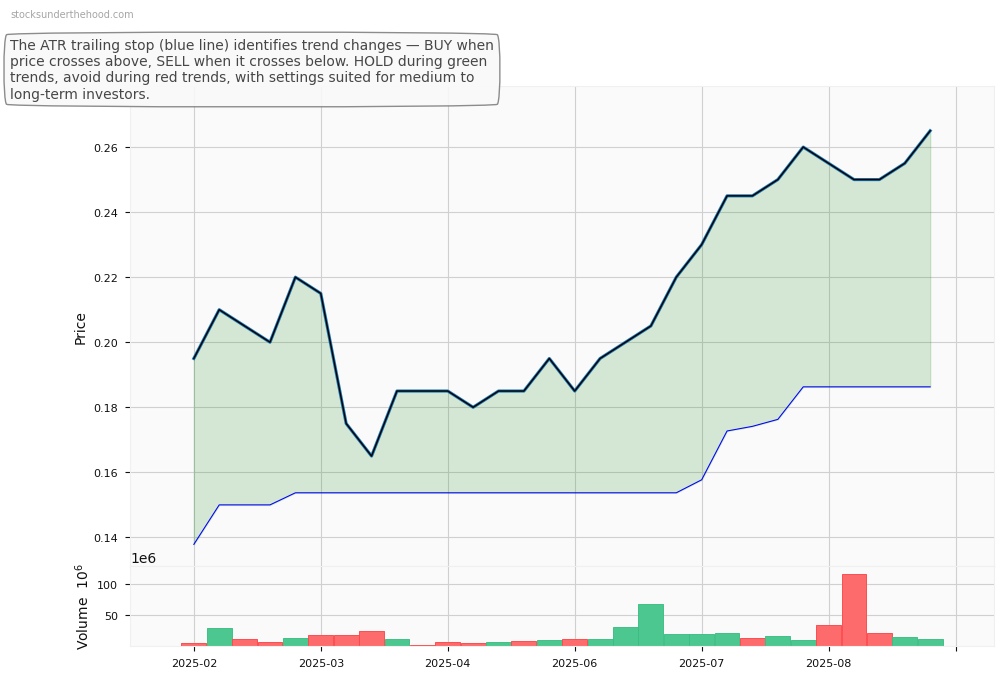
AEL Weekly Price Chart with Average True Range (ATR) Trailing Stop (10-Year View)
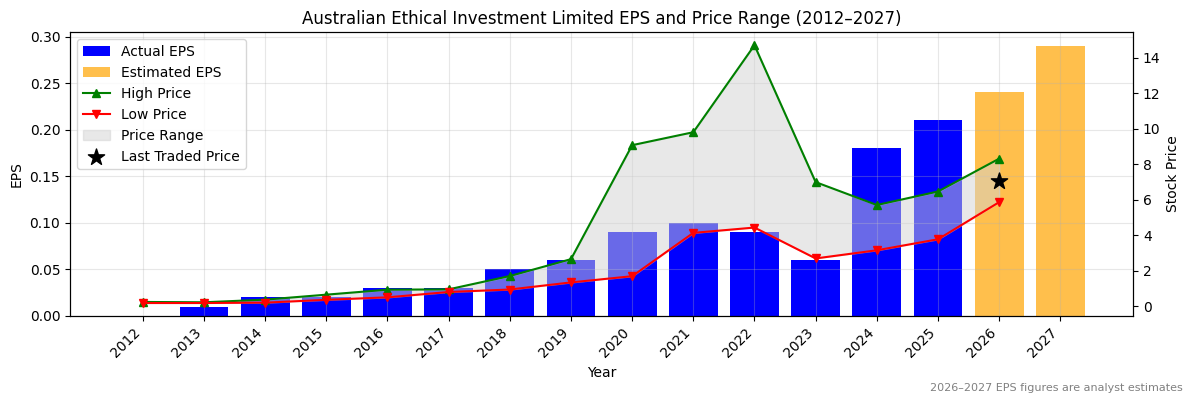
Ticker code: AEF
AEF Red Flags & Risk Indicators
✅
⚠️ RED FLAGS: 0 identified
No red flags detected.
Income Statement
| Revenue 2024 Per Share |
Revenue 2025 Per Share |
Revenue 2026e Per Share |
Revenue 24 to 25 [%] |
Revenue 25 to 26e [%] |
EBITDA 2024 Per Share |
EBITDA 2025 Per Share |
EBITDA 2026e Per Share |
EBITDA 24to25 [%] |
EBITDA 25to26e [%] |
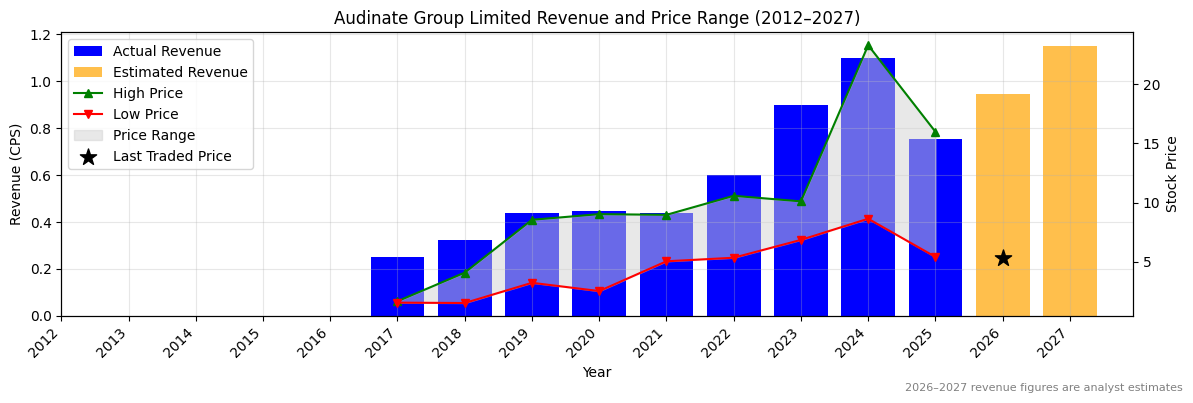
| 0.89102 |
1.05561 |
1.16558 |
18.5 |
10.4 |
0.21413 |
0.31561 |
0.34562 |
47.4 |
9.5 |
AEF Revenue Per Share (2012–2027)
✅
AEF Earnings before Interest, Tax, Depreciation and Amortisation (EBITDA) Per Share (2012–2027)
❌
AEF Normalised Earnings Per Share (EPS) (2012–2027)
❌
Valuation
| Price To Sales |
Price To Book |
PER 2023 |
PER 2024 |
13Y Median PER Low |
PER 2025 |
13Y Median PER High |
PER 2026e |
Last Updated |
| 6.6 |
19.6 |
116.5 |
38.8 |
18.8 |
33.3 |
33.3 |
29.1 |
20/9/25 |
AEF Yearly Price Earnings Ratio (PER) Highs and Lows
✅
AEF Weekly Price Chart with Average True Range (ATR) Trailing Stop (10-Year View)
Ticker code: None
None Red Flags & Risk Indicators
❌
⚠️ RED FLAGS: 5 identified
- Negative Operating Cash Flow
- Low Operating Margin
- Falling Earnings
- High Price to Book vs ROE
- Risk Of Capital Raise
Income Statement
| Revenue 2024 Per Share |
Revenue 2025e Per Share |
Revenue 2026e Per Share |
Revenue 24 to 25e [%] |
Revenue 25e to 26e [%] |
EBITDA 2024 Per Share |
EBITDA 2025e Per Share |
EBITDA 2026e Per Share |
EBITDA 24 to 25e [%] |
EBITDA 25e to 26e [%] |
| 0.06567 |
0.60262 |
0.72247 |
817.6 |
19.9 |
-0.10127 |
0.27776 |
0.39545 |
374.3 |
42.4 |
None Revenue Per Share (2012–2027)
✅✅
None Earnings before Interest, Tax, Depreciation and Amortisation (EBITDA) Per Share (2012–2027)
✅✅
None Normalised Earnings Per Share (EPS) (2012–2027)
✅✅
Valuation
| Price To Sales |
Price To Book |
PER 2023 |
PER 2024 |
13Y Median PER Low |
PER 2025e |
13Y Median PER High |
PER 2026e |
Last Updated |
| 82.3 |
17.0 |
None |
None |
7.8 |
None |
16.4 |
None |
3/7/25 |
None Yearly Price Earnings Ratio (PER) Highs and Lows
None Weekly Price Chart with Average True Range (ATR) Trailing Stop (10-Year View)
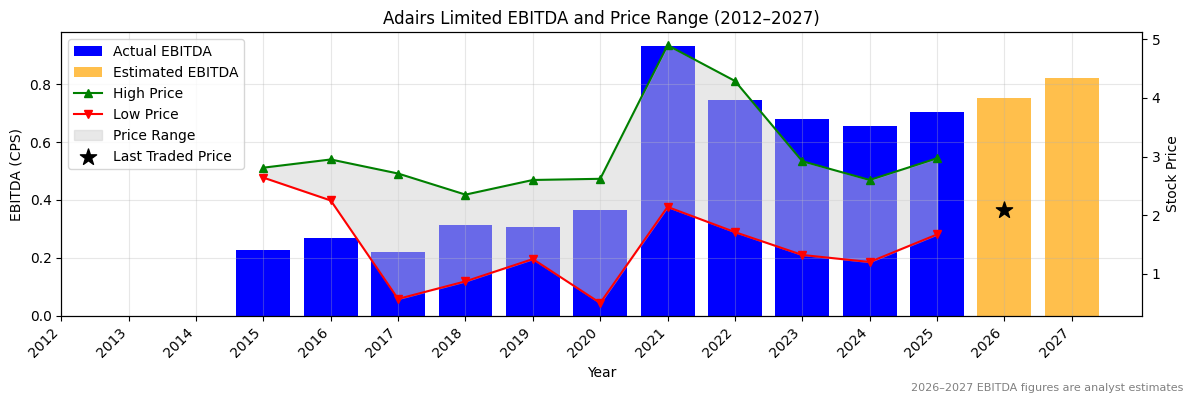
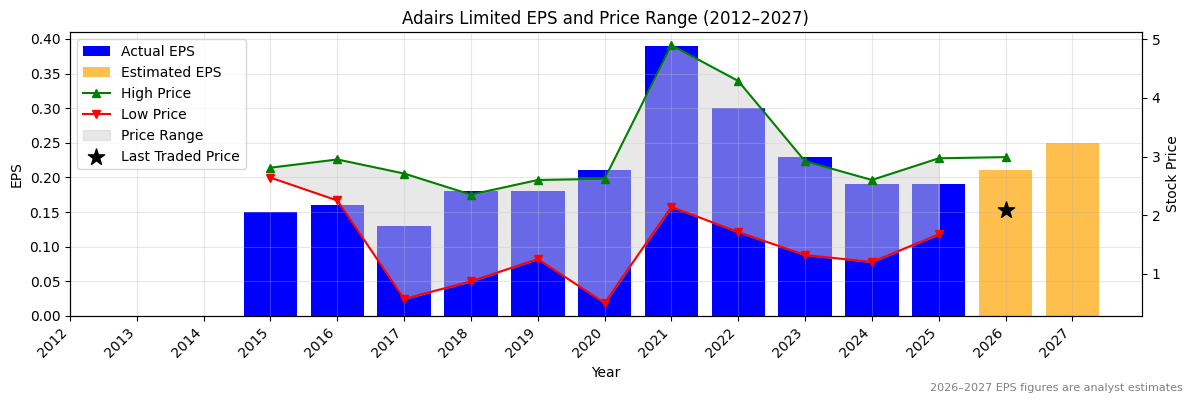
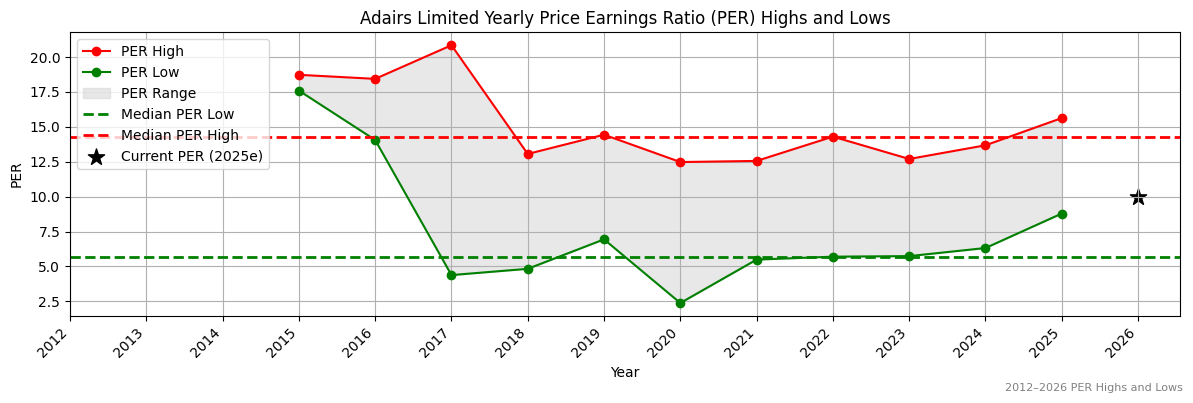
Ticker code: ADH
ADH Red Flags & Risk Indicators
⚠️
⚠️ RED FLAGS: 2 identified
- Increasing Shorts
- More Net Debt Than Equity
Income Statement
| Revenue 2024 Per Share |
Revenue 2025 Per Share |
Revenue 2026e Per Share |
Revenue 24 to 25 [%] |
Revenue 25 to 26e [%] |
EBITDA 2024 Per Share |
EBITDA 2025 Per Share |
EBITDA 2026e Per Share |
EBITDA 24to25 [%] |
EBITDA 25to26e [%] |
| 3.43457 |
3.47164 |
3.67019 |
1.1 |
5.7 |
0.65501 |
0.7047 |
0.75258 |
7.6 |
6.8 |
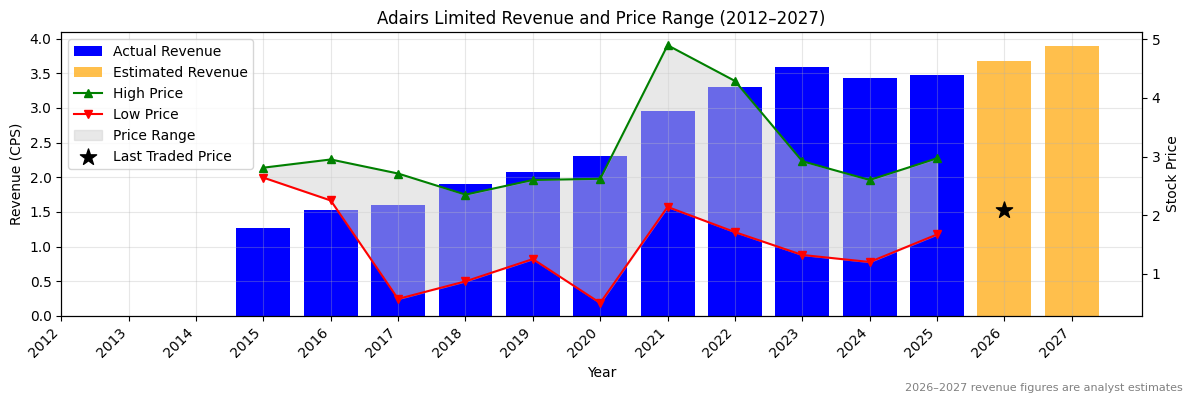
ADH Revenue Per Share (2012–2027)
✅
ADH Earnings before Interest, Tax, Depreciation and Amortisation (EBITDA) Per Share (2012–2027)
❌
ADH Normalised Earnings Per Share (EPS) (2012–2027)
❌
Valuation
| Price To Sales |
Price To Book |
PER 2023 |
PER 2024 |
13Y Median PER Low |
PER 2025 |
13Y Median PER High |
PER 2026e |
Last Updated |
| 0.6 |
1.6 |
8.8 |
10.7 |
5.7 |
10.7 |
14.3 |
9.7 |
3/7/25 |
ADH Yearly Price Earnings Ratio (PER) Highs and Lows
✅
ADH Weekly Price Chart with Average True Range (ATR) Trailing Stop (10-Year View)
Ticker code: AD8
AD8 Red Flags & Risk Indicators
❌
⚠️ RED FLAGS: 4 identified
- Increasing Shorts
- Falling Earnings
- Falling Revenues
- Falling EBITDA Margins
Income Statement
| Revenue 2024 Per Share |
Revenue 2025 Per Share |
Revenue 2026e Per Share |
Revenue 24 to 25 [%] |
Revenue 25 to 26e [%] |
EBITDA 2024 Per Share |
EBITDA 2025 Per Share |
EBITDA 2026e Per Share |
EBITDA 24to25 [%] |
EBITDA 25to26e [%] |
| 1.10076 |
0.75359 |
0.94713 |
-31.5 |
25.7 |
0.24582 |
0.0296 |
0.10756 |
-88.0 |
263.4 |
AD8 Revenue Per Share (2012–2027)
❌
AD8 Earnings before Interest, Tax, Depreciation and Amortisation (EBITDA) Per Share (2012–2027)
❌
AD8 Normalised Earnings Per Share (EPS) (2012–2027)
❌
Valuation
| Price To Sales |
Price To Book |
PER 2023 |
PER 2024 |
13Y Median PER Low |
PER 2025 |
13Y Median PER High |
PER 2026e |
Last Updated |
| 6.7 |
2.5 |
35.2 |
41.1 |
71.9 |
-54.8 |
194.3 |
-493.0 |
16/7/25 |
AD8 Yearly Price Earnings Ratio (PER) Highs and Lows
✅✅
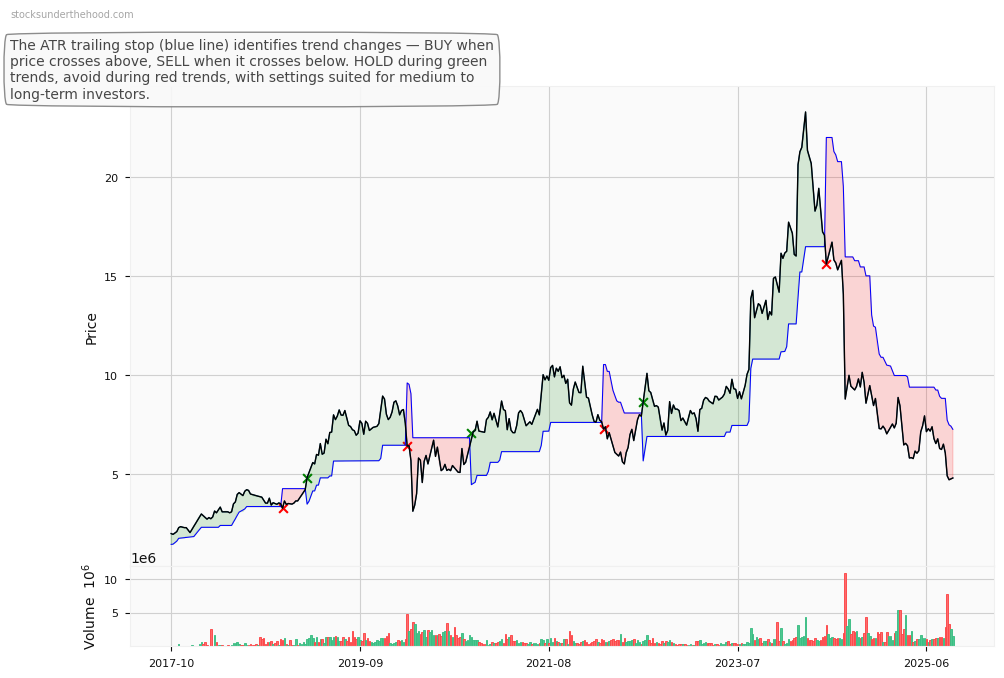
AD8 Weekly Price Chart with Average True Range (ATR) Trailing Stop (10-Year View)
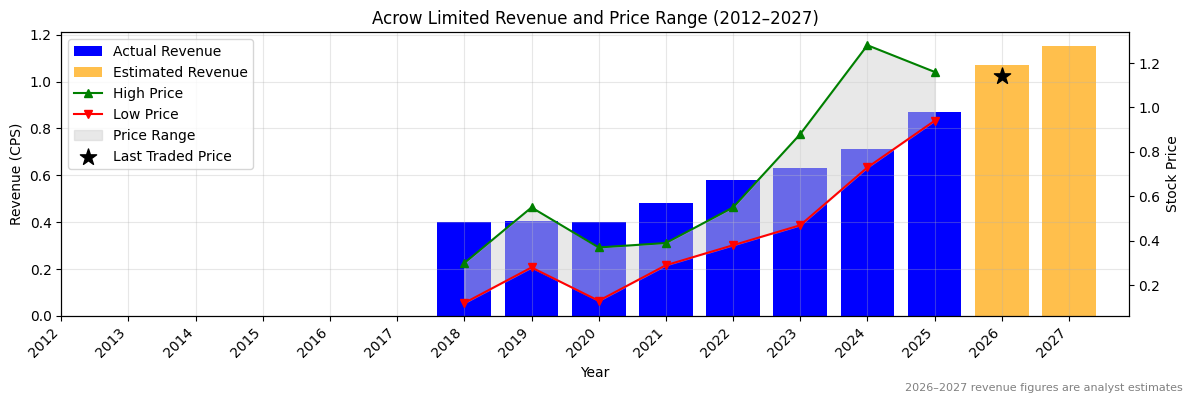
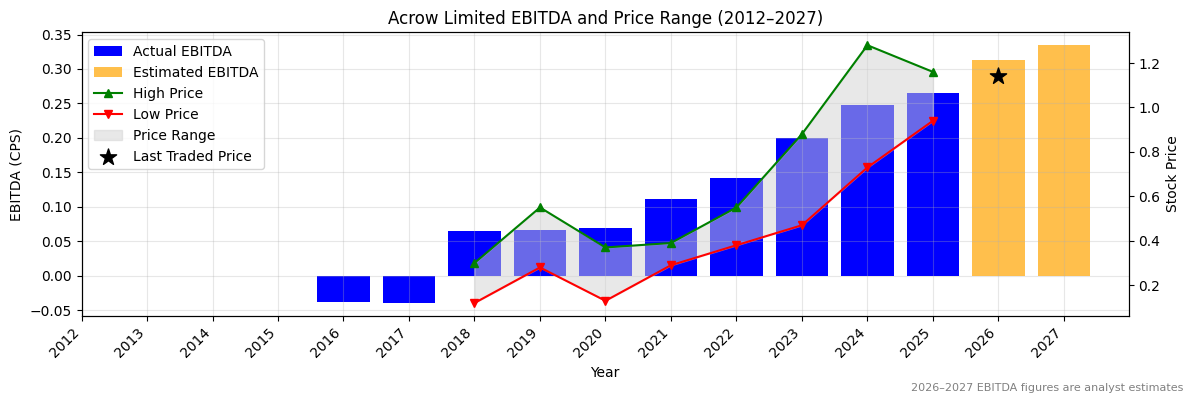
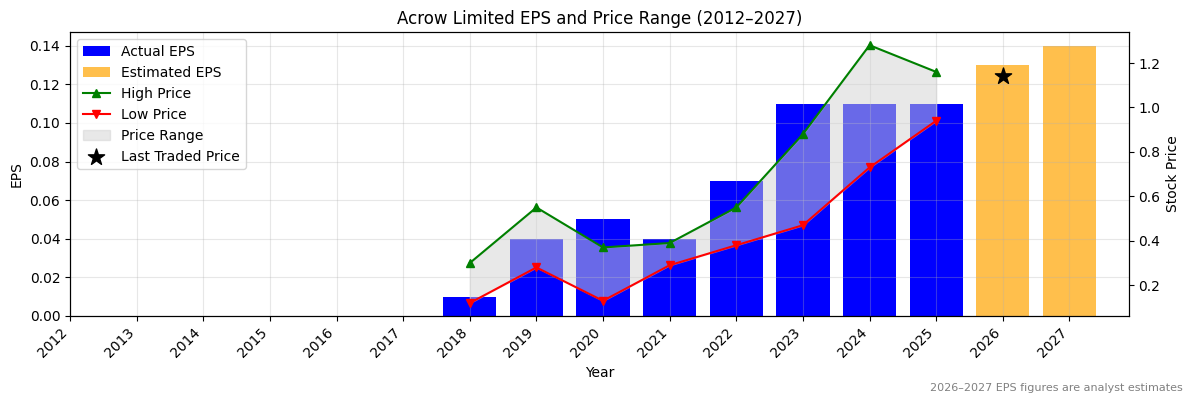
Ticker code: ACL
ACL Red Flags & Risk Indicators
⚠️
⚠️ RED FLAGS: 2 identified
- Increasing Shorts
- More Net Debt Than Equity
Income Statement
| Revenue 2024 Per Share |
Revenue 2025 Per Share |
Revenue 2026e Per Share |
Revenue 24 to 25 [%] |
Revenue 25 to 26e [%] |
EBITDA 2024 Per Share |
EBITDA 2025 Per Share |
EBITDA 2026e Per Share |
EBITDA 24to25 [%] |
EBITDA 25to26e [%] |
| 3.4502 |
3.7284 |
3.94267 |
8.1 |
5.7 |
0.94632 |
1.04188 |
1.07727 |
10.1 |
3.4 |
ACL Revenue Per Share (2012–2027)
✅
ACL Earnings before Interest, Tax, Depreciation and Amortisation (EBITDA) Per Share (2012–2027)
❌
ACL Normalised Earnings Per Share (EPS) (2012–2027)
❌
Valuation
| Price To Sales |
Price To Book |
PER 2023 |
PER 2024 |
13Y Median PER Low |
PER 2025 |
13Y Median PER High |
PER 2026e |
Last Updated |
| 0.7 |
3.0 |
13.7 |
16.2 |
13.2 |
14.4 |
21.0 |
13.7 |
7/10/25 |
ACL Yearly Price Earnings Ratio (PER) Highs and Lows
✅
ACL Weekly Price Chart with Average True Range (ATR) Trailing Stop (10-Year View)
Ticker code: ACF
ACF Red Flags & Risk Indicators
❌
⚠️ RED FLAGS: 5 identified
- Large Share Issuance
- Increasing Shorts
- Falling Earnings
- More Net Debt Than Equity
- Falling EBITDA Margins
Income Statement
| Revenue 2024 Per Share |
Revenue 2025 Per Share |
Revenue 2026e Per Share |
Revenue 24 to 25 [%] |
Revenue 25 to 26e [%] |
EBITDA 2024 Per Share |
EBITDA 2025 Per Share |
EBITDA 2026e Per Share |
EBITDA 24to25 [%] |
EBITDA 25to26e [%] |
| 0.7142 |
0.86947 |
1.06836 |
21.7 |
22.9 |
0.24758 |
0.26527 |
0.31269 |
7.1 |
17.9 |
ACF Revenue Per Share (2012–2027)
✅✅
ACF Earnings before Interest, Tax, Depreciation and Amortisation (EBITDA) Per Share (2012–2027)
❌
ACF Normalised Earnings Per Share (EPS) (2012–2027)
❌
Valuation
| Price To Sales |
Price To Book |
PER 2023 |
PER 2024 |
13Y Median PER Low |
PER 2025 |
13Y Median PER High |
PER 2026e |
Last Updated |
| 1.5 |
2.3 |
10.3 |
10.3 |
6.8 |
10.3 |
10.1 |
8.7 |
23/7/25 |
ACF Yearly Price Earnings Ratio (PER) Highs and Lows
❌
ACF Weekly Price Chart with Average True Range (ATR) Trailing Stop (10-Year View)
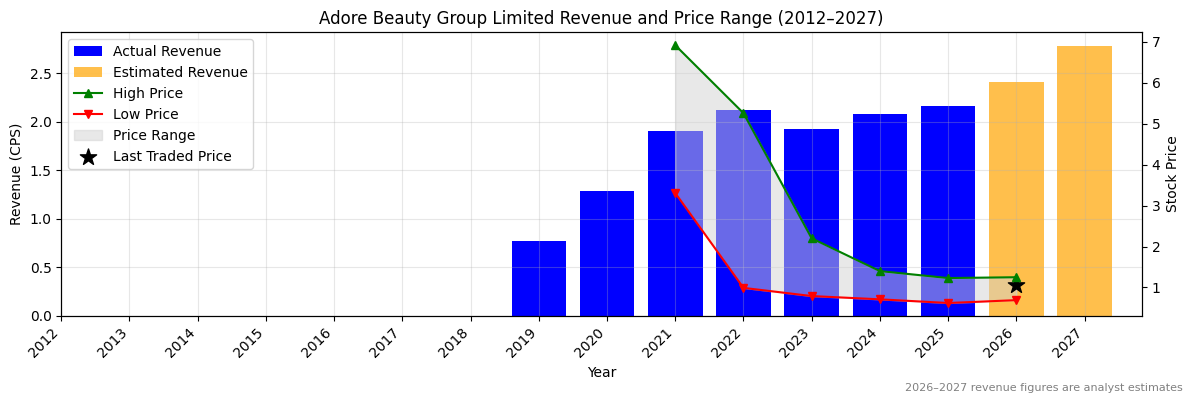
Ticker code: ABY
ABY Red Flags & Risk Indicators
⚠️
⚠️ RED FLAGS: 1 identified
Income Statement
| Revenue 2024 Per Share |
Revenue 2025 Per Share |
Revenue 2026e Per Share |
Revenue 24 to 25 [%] |
Revenue 25 to 26e [%] |
EBITDA 2024 Per Share |
EBITDA 2025 Per Share |
EBITDA 2026e Per Share |
EBITDA 24to25 [%] |
EBITDA 25to26e [%] |
| 2.08305 |
2.15597 |
2.40693 |
3.5 |
11.6 |
0.05119 |
0.09621 |
0.14985 |
87.9 |
55.8 |
ABY Revenue Per Share (2012–2027)
✅
ABY Earnings before Interest, Tax, Depreciation and Amortisation (EBITDA) Per Share (2012–2027)
❌
ABY Normalised Earnings Per Share (EPS) (2012–2027)
❌
Valuation
| Price To Sales |
Price To Book |
PER 2023 |
PER 2024 |
13Y Median PER Low |
PER 2025 |
13Y Median PER High |
PER 2026e |
Last Updated |
| 0.5 |
2.6 |
-111.0 |
55.5 |
33.0 |
27.8 |
70.0 |
18.5 |
29/8/25 |
ABY Yearly Price Earnings Ratio (PER) Highs and Lows
✅✅
ABY Weekly Price Chart with Average True Range (ATR) Trailing Stop (10-Year View)
Ticker code: ABB
ABB Red Flags & Risk Indicators
⚠️
⚠️ RED FLAGS: 2 identified
- Increasing Shorts
- Falling Earnings
Income Statement
| Revenue 2024 Per Share |
Revenue 2025 Per Share |
Revenue 2026e Per Share |
Revenue 24 to 25 [%] |
Revenue 25 to 26e [%] |
EBITDA 2024 Per Share |
EBITDA 2025 Per Share |
EBITDA 2026e Per Share |
EBITDA 24to25 [%] |
EBITDA 25to26e [%] |
| 3.38325 |
4.05754 |
4.45296 |
19.9 |
9.7 |
0.40772 |
0.48204 |
0.55524 |
18.2 |
15.2 |
ABB Revenue Per Share (2012–2027)
✅
ABB Earnings before Interest, Tax, Depreciation and Amortisation (EBITDA) Per Share (2012–2027)
❌
ABB Normalised Earnings Per Share (EPS) (2012–2027)
❌
Valuation
| Price To Sales |
Price To Book |
PER 2023 |
PER 2024 |
13Y Median PER Low |
PER 2025 |
13Y Median PER High |
PER 2026e |
Last Updated |
| 1.5 |
3.1 |
59.5 |
45.8 |
22.1 |
49.6 |
36.1 |
29.7 |
14/9/25 |
ABB Yearly Price Earnings Ratio (PER) Highs and Lows
❌
ABB Weekly Price Chart with Average True Range (ATR) Trailing Stop (10-Year View)
Ticker code: AAPL
AAPL Red Flags & Risk Indicators
⚠️
⚠️ RED FLAGS: 1 identified
Income Statement
| Revenue 2024 Per Share |
Revenue 2025 Per Share |
Revenue 2026e Per Share |
Revenue 24 to 25 [%] |
Revenue 25 to 26e [%] |
EBITDA 2024 Per Share |
EBITDA 2025 Per Share |
EBITDA 2026e Per Share |
EBITDA 24to25 [%] |
EBITDA 25to26e [%] |
| 25.50104 |
27.56352 |
29.25119 |
8.1 |
6.1 |
8.78181 |
9.26823 |
9.96187 |
5.5 |
7.5 |
AAPL Revenue Per Share (2012–2027)
✅
AAPL Earnings before Interest, Tax, Depreciation and Amortisation (EBITDA) Per Share (2012–2027)
❌
AAPL Normalised Earnings Per Share (EPS) (2012–2027)
❌
Valuation
| Price To Sales |
Price To Book |
PER 2023 |
PER 2024 |
13Y Median PER Low |
PER 2025 |
13Y Median PER High |
PER 2026e |
Last Updated |
| 9.9 |
61.0 |
44.1 |
40.1 |
12.0 |
36.6 |
19.5 |
33.9 |
10/5/25 |
AAPL Yearly Price Earnings Ratio (PER) Highs and Lows
❌
AAPL Weekly Price Chart with Average True Range (ATR) Trailing Stop (10-Year View)
Ticker code: AAI
AAI Red Flags & Risk Indicators
✅
⚠️ RED FLAGS: 0 identified
No red flags detected.
Income Statement
| Revenue 2024 Per Share |
Revenue 2025 Per Share |
Revenue 2026e Per Share |
Revenue 24 to 25 [%] |
Revenue 25 to 26e [%] |
EBITDA 2024 Per Share |
EBITDA 2025 Per Share |
EBITDA 2026e Per Share |
EBITDA 24to25 [%] |
EBITDA 25to26e [%] |
| None |
None |
None |
None |
None |
None |
None |
None |
None |
None |
AAI Revenue Per Share (2012–2027)
AAI Earnings before Interest, Tax, Depreciation and Amortisation (EBITDA) Per Share (2012–2027)
❌
AAI Normalised Earnings Per Share (EPS) (2012–2027)
❌
Valuation
| Price To Sales |
Price To Book |
PER 2023 |
PER 2024 |
13Y Median PER Low |
PER 2025 |
13Y Median PER High |
PER 2026e |
Last Updated |
| 1.1 |
2.3 |
None |
None |
None |
None |
None |
None |
None |
AAI Yearly Price Earnings Ratio (PER) Highs and Lows
AAI Weekly Price Chart with Average True Range (ATR) Trailing Stop (10-Year View)
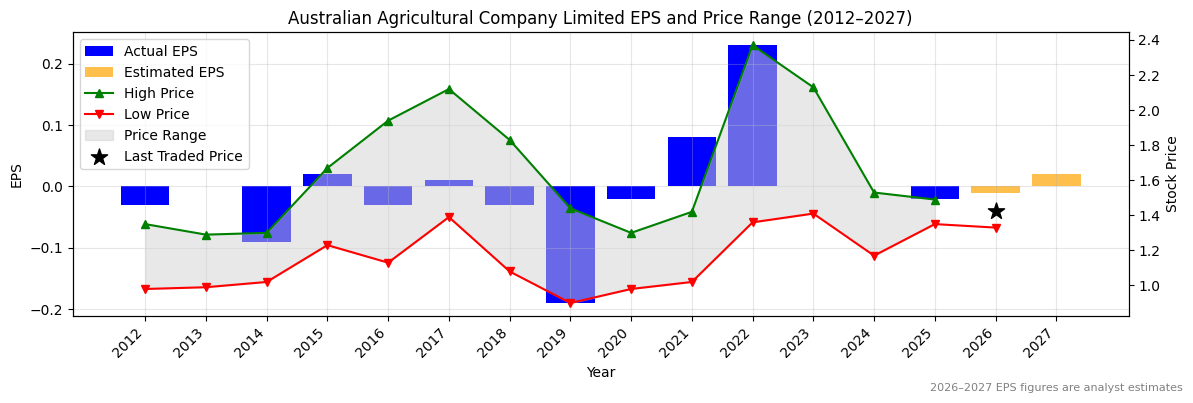
Ticker code: AAC
AAC Red Flags & Risk Indicators
❌
⚠️ RED FLAGS: 3 identified
- Low Operating Margin
- Increasing Shorts
- Falling Earnings
Income Statement
| Revenue 2024 Per Share |
Revenue 2025 Per Share |
Revenue 2026e Per Share |
Revenue 24 to 25 [%] |
Revenue 25 to 26e [%] |
EBITDA 2024 Per Share |
EBITDA 2025 Per Share |
EBITDA 2026e Per Share |
EBITDA 24to25 [%] |
EBITDA 25to26e [%] |
| 0.55765 |
0.57584 |
0.65481 |
3.3 |
13.7 |
0.08371 |
0.08494 |
0.11381 |
1.5 |
34.0 |
AAC Revenue Per Share (2012–2027)
✅
AAC Earnings before Interest, Tax, Depreciation and Amortisation (EBITDA) Per Share (2012–2027)
❌
AAC Normalised Earnings Per Share (EPS) (2012–2027)
❌
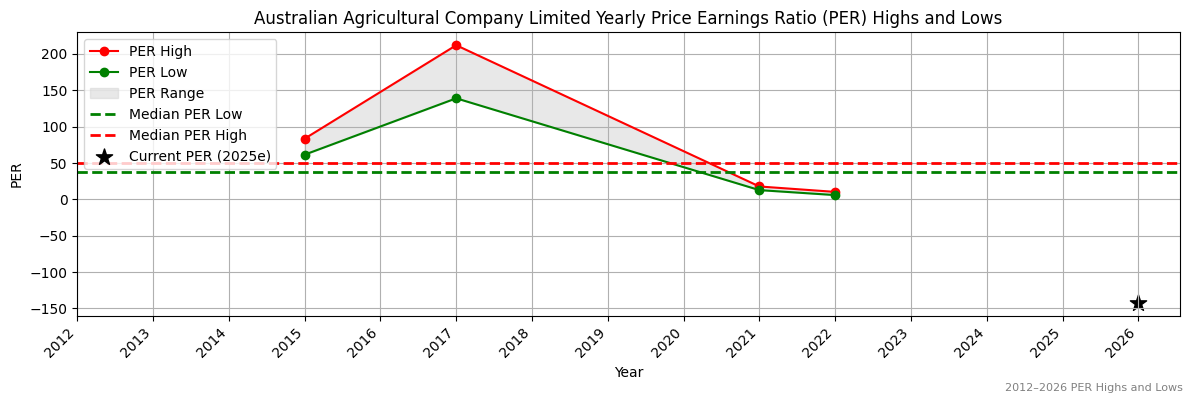
Valuation
| Price To Sales |
Price To Book |
PER 2023 |
PER 2024 |
13Y Median PER Low |
PER 2025 |
13Y Median PER High |
PER 2026e |
Last Updated |
| 2.2 |
0.6 |
None |
None |
37.1 |
-71.5 |
50.6 |
-143.0 |
14/11/24 |
AAC Yearly Price Earnings Ratio (PER) Highs and Lows
✅✅
AAC Weekly Price Chart with Average True Range (ATR) Trailing Stop (10-Year View)
Ticker code: A4N
A4N Red Flags & Risk Indicators
✅
⚠️ RED FLAGS: 0 identified
No red flags detected.
Income Statement
| Revenue 2024 Per Share |
Revenue 2025 Per Share |
Revenue 2026e Per Share |
Revenue 24 to 25 [%] |
Revenue 25 to 26e [%] |
EBITDA 2024 Per Share |
EBITDA 2025 Per Share |
EBITDA 2026e Per Share |
EBITDA 24to25 [%] |
EBITDA 25to26e [%] |
| None |
None |
None |
None |
None |
None |
None |
None |
None |
None |
A4N Revenue Per Share (2012–2027)
A4N Earnings before Interest, Tax, Depreciation and Amortisation (EBITDA) Per Share (2012–2027)
❌
A4N Normalised Earnings Per Share (EPS) (2012–2027)
❌
Valuation
| Price To Sales |
Price To Book |
PER 2023 |
PER 2024 |
13Y Median PER Low |
PER 2025 |
13Y Median PER High |
PER 2026e |
Last Updated |
| 2829.6 |
4.1 |
None |
None |
None |
None |
None |
None |
None |
A4N Yearly Price Earnings Ratio (PER) Highs and Lows
A4N Weekly Price Chart with Average True Range (ATR) Trailing Stop (10-Year View)
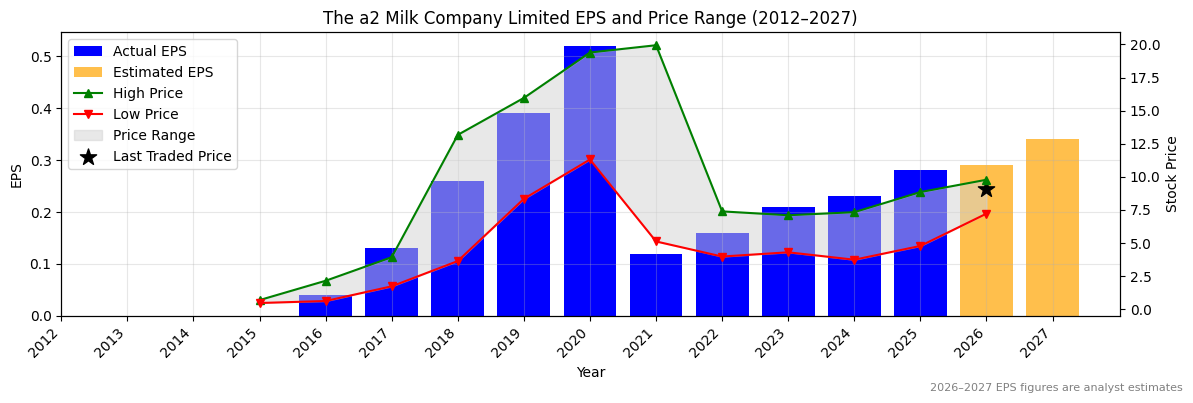
Ticker code: A2M
A2M Red Flags & Risk Indicators
✅
⚠️ RED FLAGS: 0 identified
No red flags detected.
Income Statement
| Revenue 2024 Per Share |
Revenue 2025 Per Share |
Revenue 2026e Per Share |
Revenue 24 to 25 [%] |
Revenue 25 to 26e [%] |
EBITDA 2024 Per Share |
EBITDA 2025 Per Share |
EBITDA 2026e Per Share |
EBITDA 24to25 [%] |
EBITDA 25to26e [%] |
| 2.31463 |
2.60715 |
2.80443 |
12.6 |
7.6 |
0.32415 |
0.37949 |
0.41448 |
17.1 |
9.2 |
A2M Revenue Per Share (2012–2027)
✅
A2M Earnings before Interest, Tax, Depreciation and Amortisation (EBITDA) Per Share (2012–2027)
❌
A2M Normalised Earnings Per Share (EPS) (2012–2027)
❌
Valuation
| Price To Sales |
Price To Book |
PER 2023 |
PER 2024 |
13Y Median PER Low |
PER 2025 |
13Y Median PER High |
PER 2026e |
Last Updated |
| 3.6 |
4.8 |
45.4 |
41.4 |
20.5 |
34.0 |
37.3 |
32.9 |
14/9/25 |
A2M Yearly Price Earnings Ratio (PER) Highs and Lows
✅
A2M Weekly Price Chart with Average True Range (ATR) Trailing Stop (10-Year View)
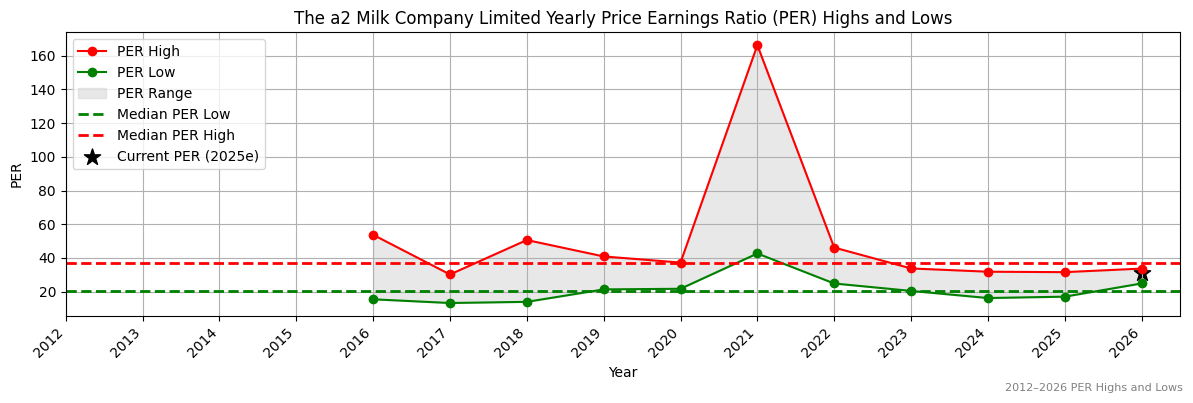
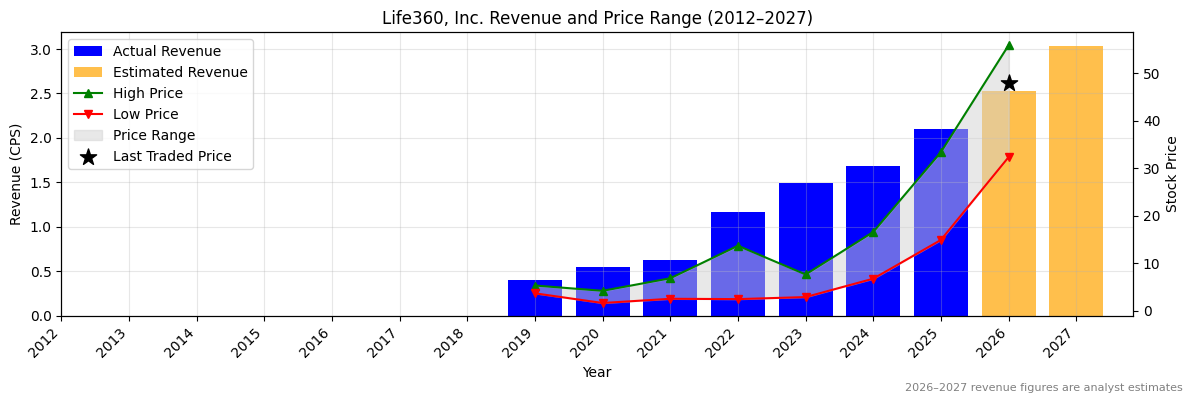
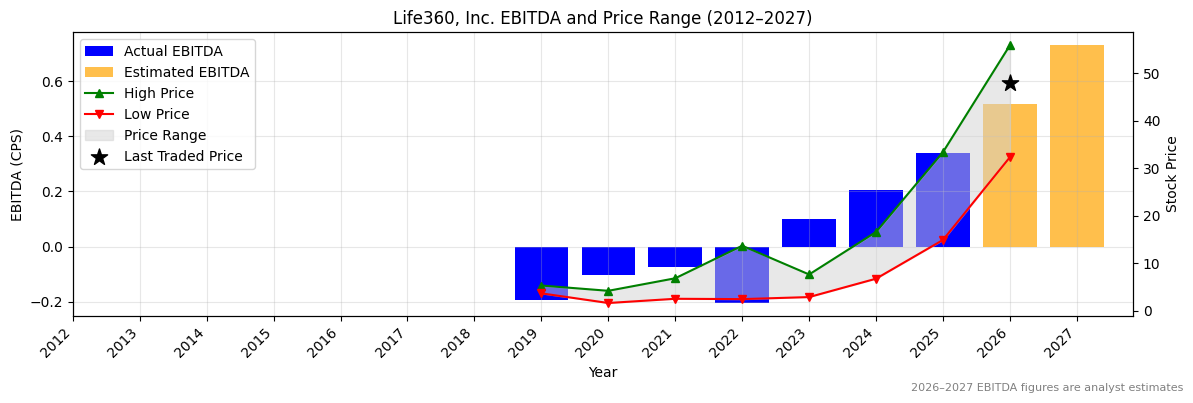
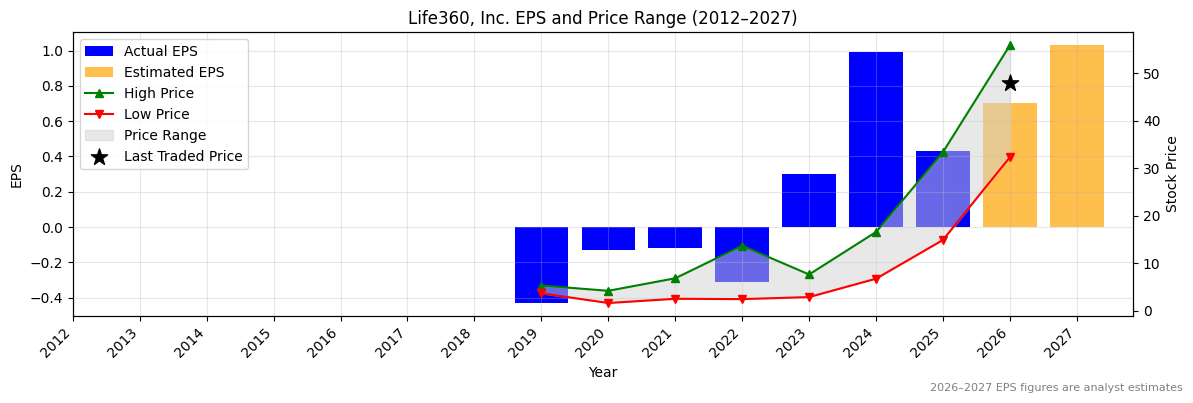
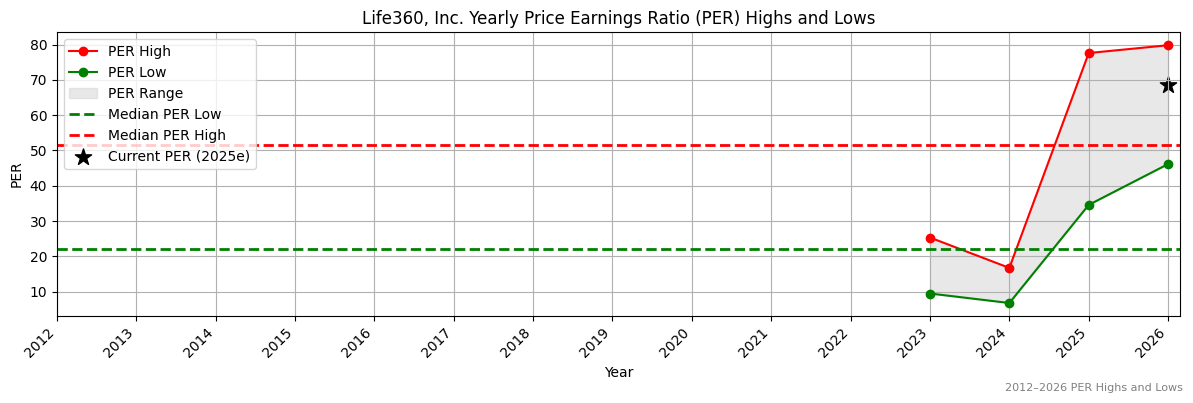
Ticker code: 360
360 Red Flags & Risk Indicators
⚠️
⚠️ RED FLAGS: 1 identified
Income Statement
| Revenue 2024 Per Share |
Revenue 2025 Per Share |
Revenue 2026e Per Share |
Revenue 24 to 25 [%] |
Revenue 25 to 26e [%] |
EBITDA 2024 Per Share |
EBITDA 2025 Per Share |
EBITDA 2026e Per Share |
EBITDA 24to25 [%] |
EBITDA 25to26e [%] |
| 1.68928 |
2.10008 |
2.52775 |
24.3 |
20.4 |
0.20682 |
0.33926 |
0.51869 |
64.0 |
52.9 |
360 Revenue Per Share (2012–2027)
✅✅
360 Earnings before Interest, Tax, Depreciation and Amortisation (EBITDA) Per Share (2012–2027)
❌
360 Normalised Earnings Per Share (EPS) (2012–2027)
❌
Valuation
| Price To Sales |
Price To Book |
PER 2023 |
PER 2024 |
13Y Median PER Low |
PER 2025 |
13Y Median PER High |
PER 2026e |
Last Updated |
| 27.1 |
31.6 |
165.9 |
50.3 |
22.0 |
115.7 |
51.5 |
71.1 |
14/9/25 |
360 Yearly Price Earnings Ratio (PER) Highs and Lows
❌
360 Weekly Price Chart with Average True Range (ATR) Trailing Stop (10-Year View)
Symal Group Limited (ASX:SYL) is an Australian construction company specializing in civil infrastructure projects. Their services include contracting, equipment hire, material sales, recycling, and remediation.
Ticker code: SYL
Market Information
| Market Capitalisation |
Enterprise Value |
Shares Outstanding |
Free Float [%] |
Free Float Value |
| $654,165,965 |
$641,139,965 |
236161000.0 |
29.03 |
$189,923,777 |
Balance Sheet & Quality
| Equity |
Cash |
Debt |
Return On Equity (ROE) |
EBITDA 25 Margin [%] |
Net Debt / Equity [%] |
Rule of 40 |
| $170,508,245 |
$168,966,000 |
$155,940,000 |
71.2 |
11.9 |
-7.6 |
29.2 |
Technicals & Short Data
| 3EMA Status |
Volatility [%] |
Value Traded Today |
Average Daily Liquidity |
Short [%] |
Days To Cover |
| Positive |
4.6 |
$1,814,236 |
$766,116 |
0.0 |
0.0 |
Dividends
| Previous Dividend |
Last Dividend |
Franking [%] |
Ex-Div Date |
Gross Yield [%] |
| None |
$0.059 |
100.0 |
2025-09-04 |
0.0 |
Price Performance Snapshot
| Last Traded Price |
Change [%] |
1 Week [%] |
1 Month [%] |
3 Months [%] |
6 Months [%] |
12 Months [%] |
| $2.770 |
7.4 |
14.0 |
15.9 |
51.5 |
70.4 |
55.2 |
SYL Price Chart with Volume and 3EMA
SYL Short Positions
Click HERE to understand why the above moving averages have been chosen.
Perenti Global Limited is a diversified mining services company offering surface and underground mining, drilling, and technical services to the resources sector across Australia, Africa, and other regions.
Ticker code: PRN
Market Information
| Market Capitalisation |
Enterprise Value |
Shares Outstanding |
Free Float [%] |
Free Float Value |
| $2,753,849,052 |
$3,058,571,100 |
939880201 |
88.63 |
$2,440,835,275 |
Balance Sheet & Quality
| Equity |
Cash |
Debt |
Return On Equity (ROE) |
EBITDA 25 Margin [%] |
Net Debt / Equity [%] |
Rule of 40 |
| $1,851,563,969 |
$481,321,984 |
$786,044,032 |
9.5 |
19.2 |
16.5 |
24.0 |
Technicals & Short Data
| 3EMA Status |
Volatility [%] |
Value Traded Today |
Average Daily Liquidity |
Short [%] |
Days To Cover |
| Positive |
11.6 |
$8,774,117 |
$14,140,218 |
0.32 |
0.6 |
Dividends
| Previous Dividend |
Last Dividend |
Franking [%] |
Ex-Div Date |
Gross Yield [%] |
| $0.030 |
$0.043 |
None |
2025-10-15 |
1.5 |
Price Performance Snapshot
| Last Traded Price |
Change [%] |
1 Week [%] |
1 Month [%] |
3 Months [%] |
6 Months [%] |
12 Months [%] |
| $2.930 |
2.4 |
8.5 |
8.1 |
28.2 |
85.3 |
136.9 |
PRN Price Chart with Volume and 3EMA
PRN Short Positions
Click HERE to understand why the above moving averages have been chosen.