Ticker code: SIL
SIL Red Flags & Risk Indicators
✅
⚠️ RED FLAGS: 0 identified
No red flags detected.
Income Statement
| Revenue 2024 Per Share |
Revenue 2025e Per Share |
Revenue 2026e Per Share |
Revenue 24 to 25e [%] |
Revenue 25e to 26e [%] |
EBITDA 2024 Per Share |
EBITDA 2025e Per Share |
EBITDA 2026e Per Share |
EBITDA 24 to 25e [%] |
EBITDA 25e to 26e [%] |
| None |
None |
None |
None |
None |
None |
None |
None |
None |
None |
SIL Revenue Per Share (2012–2027)
SIL Earnings before Interest, Tax, Depreciation and Amortisation (EBITDA) Per Share (2012–2027)
SIL Normalised Earnings Per Share (EPS) (2012–2027)
Valuation
| Price To Sales |
Price To Book |
PER 2023 |
PER 2024 |
13Y Median PER Low |
PER 2025e |
13Y Median PER High |
PER 2026e |
Last Updated |
| None |
None |
None |
None |
None |
None |
None |
None |
None |
SIL Yearly Price Earnings Ratio (PER) Highs and Lows
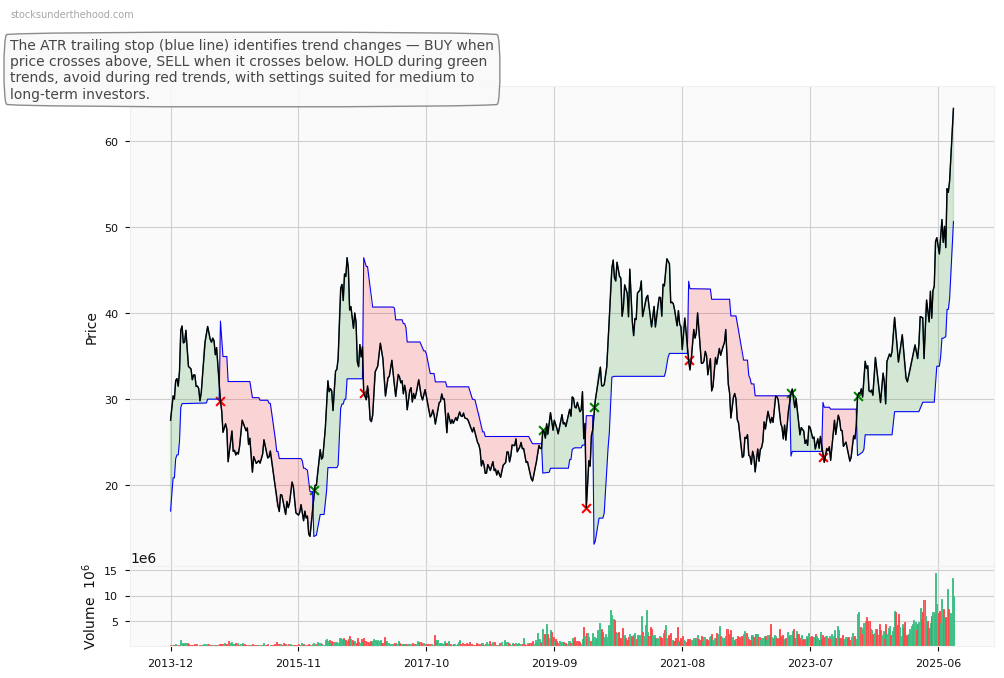
SIL Weekly Price Chart with Average True Range (ATR) Trailing Stop (10-Year View)
Ticker code: GDX
GDX Red Flags & Risk Indicators
✅
⚠️ RED FLAGS: 0 identified
No red flags detected.
Income Statement
| Revenue 2024 Per Share |
Revenue 2025e Per Share |
Revenue 2026e Per Share |
Revenue 24 to 25e [%] |
Revenue 25e to 26e [%] |
EBITDA 2024 Per Share |
EBITDA 2025e Per Share |
EBITDA 2026e Per Share |
EBITDA 24 to 25e [%] |
EBITDA 25e to 26e [%] |
| None |
None |
None |
None |
None |
None |
None |
None |
None |
None |
GDX Revenue Per Share (2012–2027)
GDX Earnings before Interest, Tax, Depreciation and Amortisation (EBITDA) Per Share (2012–2027)
GDX Normalised Earnings Per Share (EPS) (2012–2027)
Valuation
| Price To Sales |
Price To Book |
PER 2023 |
PER 2024 |
13Y Median PER Low |
PER 2025e |
13Y Median PER High |
PER 2026e |
Last Updated |
| None |
None |
None |
None |
None |
None |
None |
None |
None |
GDX Yearly Price Earnings Ratio (PER) Highs and Lows
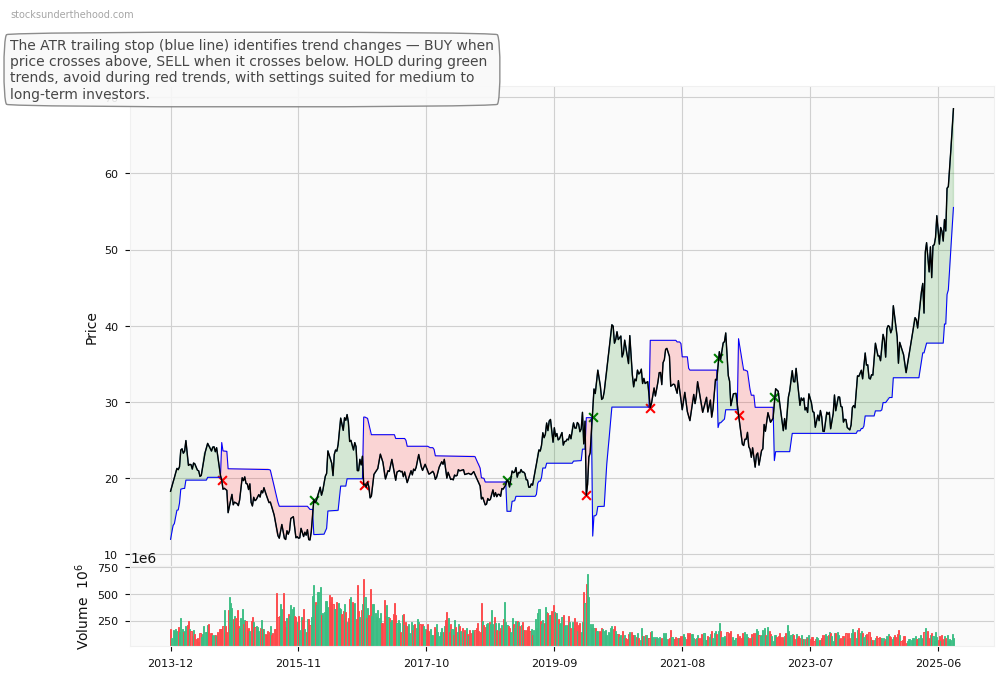
GDX Weekly Price Chart with Average True Range (ATR) Trailing Stop (10-Year View)
Ticker code: AAL
AAL Red Flags & Risk Indicators
⚠️
⚠️ RED FLAGS: 1 identified
Income Statement
| Revenue 2024 Per Share |
Revenue 2025e Per Share |
Revenue 2026e Per Share |
Revenue 24 to 25e [%] |
Revenue 25e to 26e [%] |
EBITDA 2024 Per Share |
EBITDA 2025e Per Share |
EBITDA 2026e Per Share |
EBITDA 24 to 25e [%] |
EBITDA 25e to 26e [%] |
| None |
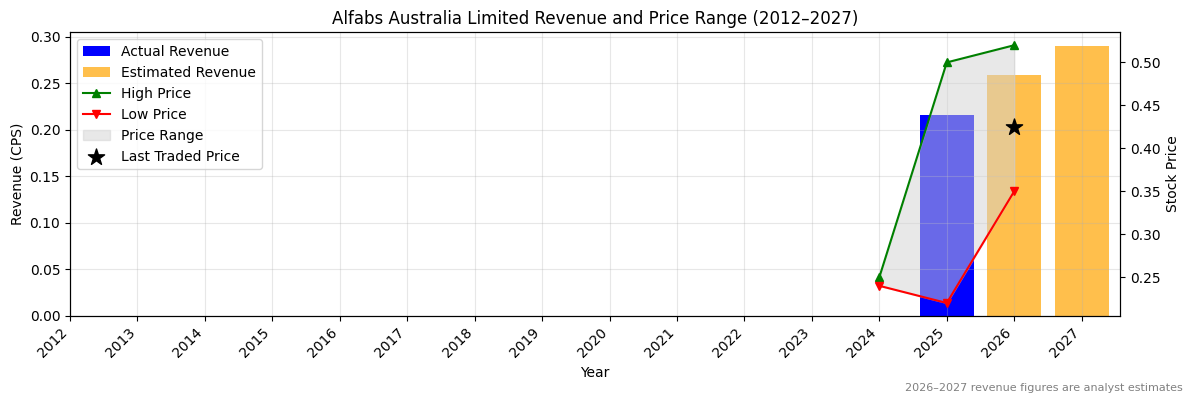
0.2165 |
0.25866 |
None |
19.5 |
None |
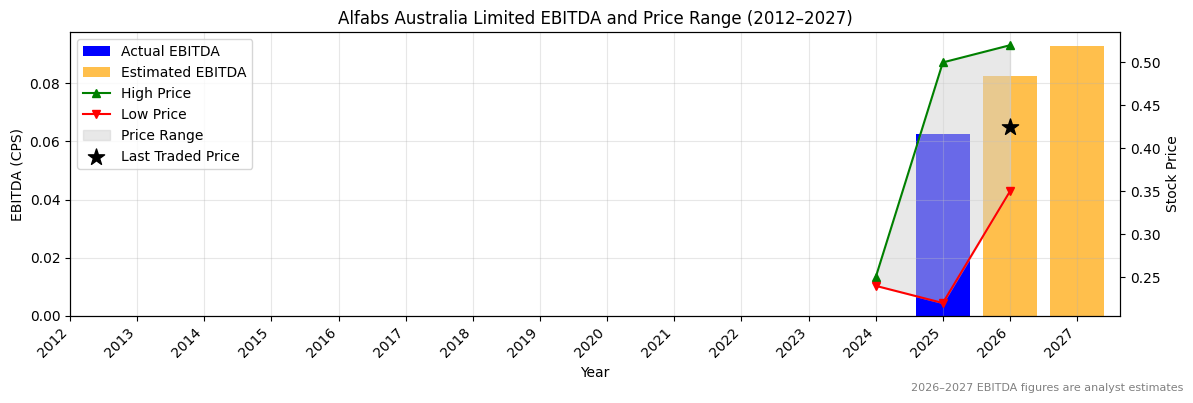
0.06253 |
0.08259 |
None |
32.1 |
AAL Revenue Per Share (2012–2027)
AAL Earnings before Interest, Tax, Depreciation and Amortisation (EBITDA) Per Share (2012–2027)
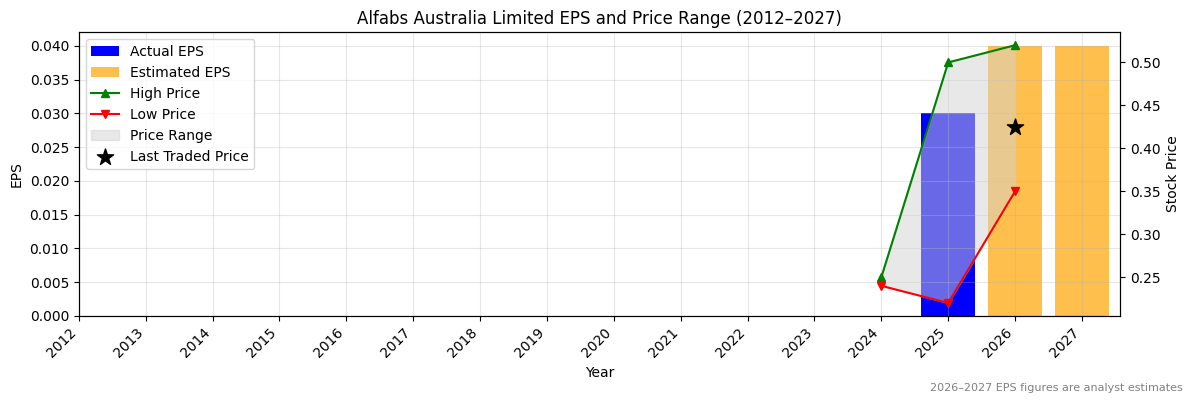
AAL Normalised Earnings Per Share (EPS) (2012–2027)
✅✅
Valuation
| Price To Sales |
Price To Book |
PER 2023 |
PER 2024 |
13Y Median PER Low |
PER 2025e |
13Y Median PER High |
PER 2026e |
Last Updated |
| 1.5 |
2.2 |
None |
None |
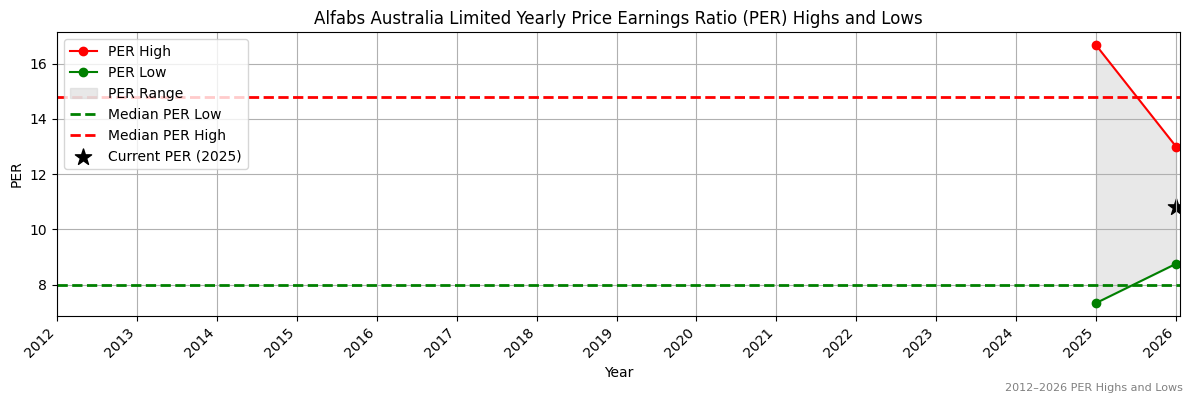
8.0 |
16.3 |
14.8 |
12.3 |
10/9/25 |
AAL Yearly Price Earnings Ratio (PER) Highs and Lows
❌
AAL Weekly Price Chart with Average True Range (ATR) Trailing Stop (10-Year View)
Ticker code: WGN
WGN Red Flags & Risk Indicators
❌
⚠️ RED FLAGS: 3 identified
- Increasing Shorts
- Falling Revenues
- More Net Debt Than Equity
Income Statement
| Revenue 2024 Per Share |
Revenue 2025e Per Share |
Revenue 2026e Per Share |
Revenue 24 to 25e [%] |
Revenue 25e to 26e [%] |
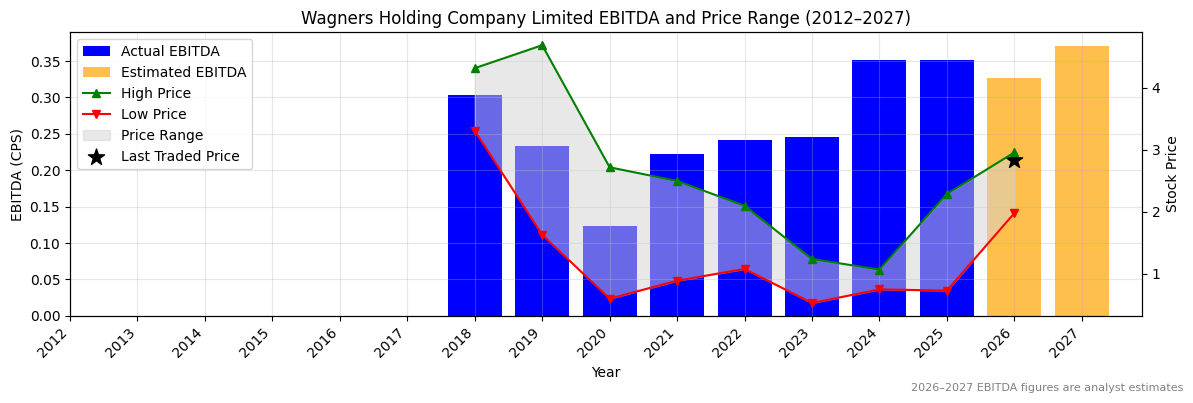
EBITDA 2024 Per Share |
EBITDA 2025e Per Share |
EBITDA 2026e Per Share |
EBITDA 24 to 25e [%] |
EBITDA 25e to 26e [%] |
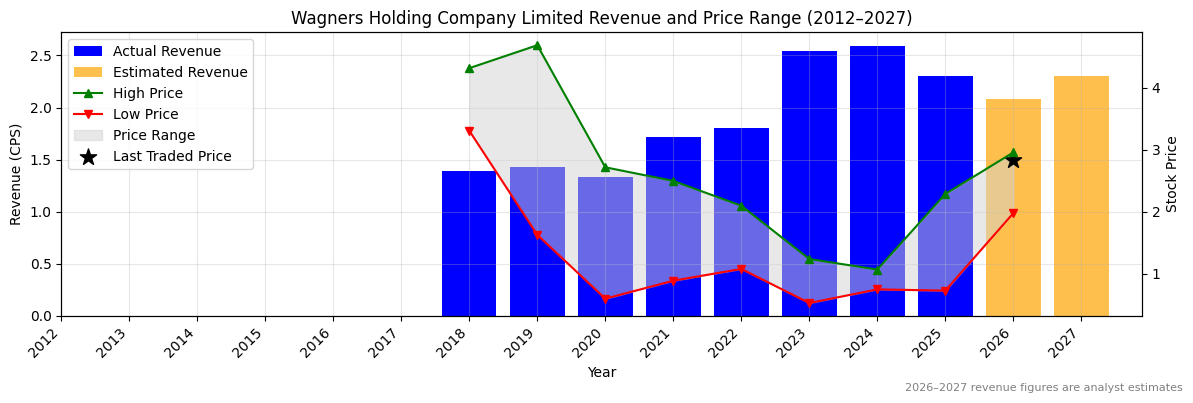
| 2.59248 |
2.29888 |
2.07952 |
-11.3 |
-9.5 |
0.35117 |
0.35133 |
0.32675 |
0.0 |
-7.0 |
WGN Revenue Per Share (2012–2027)
❌
WGN Earnings before Interest, Tax, Depreciation and Amortisation (EBITDA) Per Share (2012–2027)
❌
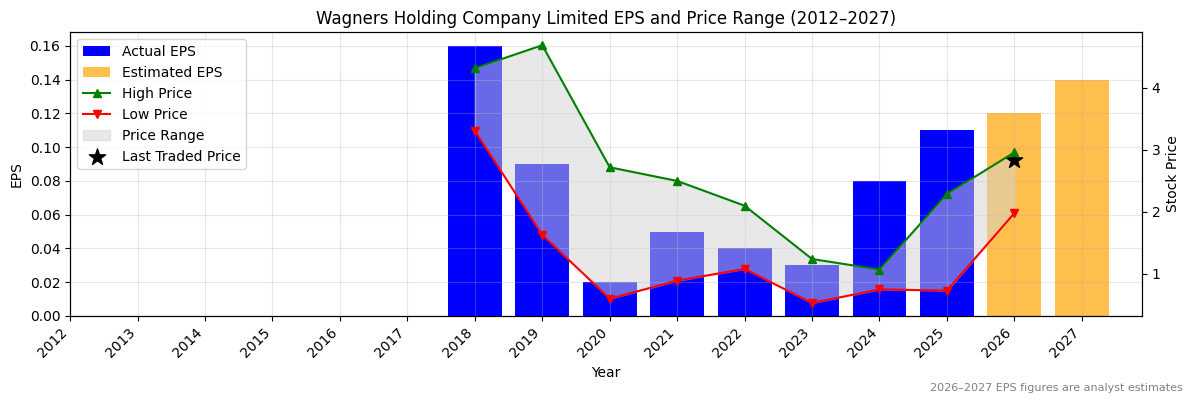
WGN Normalised Earnings Per Share (EPS) (2012–2027)
✅✅
Valuation
| Price To Sales |
Price To Book |
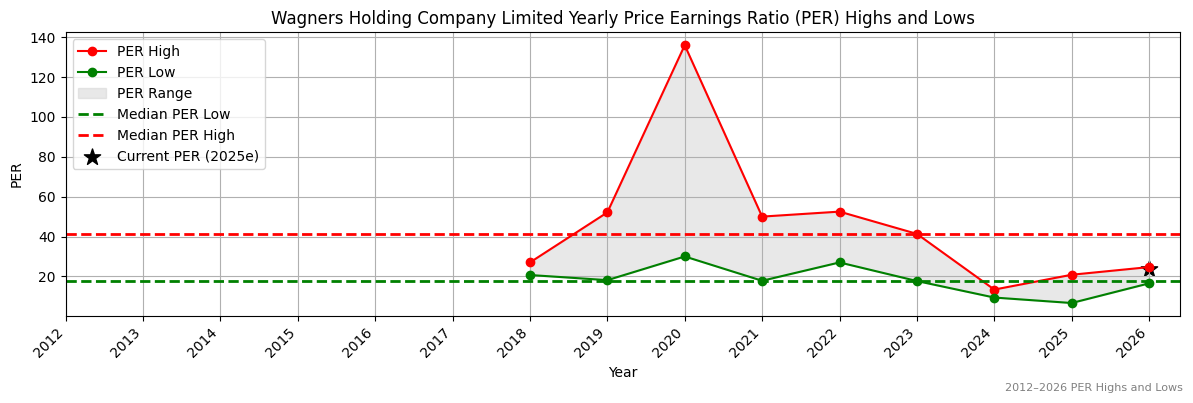
PER 2023 |
PER 2024 |
13Y Median PER Low |
PER 2025e |
13Y Median PER High |
PER 2026e |
Last Updated |
| 1.3 |
3.3 |
90.0 |
33.8 |
17.8 |
24.5 |
41.3 |
22.5 |
3/9/25 |
WGN Yearly Price Earnings Ratio (PER) Highs and Lows
✅
WGN Weekly Price Chart with Average True Range (ATR) Trailing Stop (10-Year View)
Ticker code: DNL
DNL Red Flags & Risk Indicators
❌
⚠️ RED FLAGS: 3 identified
- Low Operating Margin
- Falling Earnings
- Falling Revenues
Income Statement
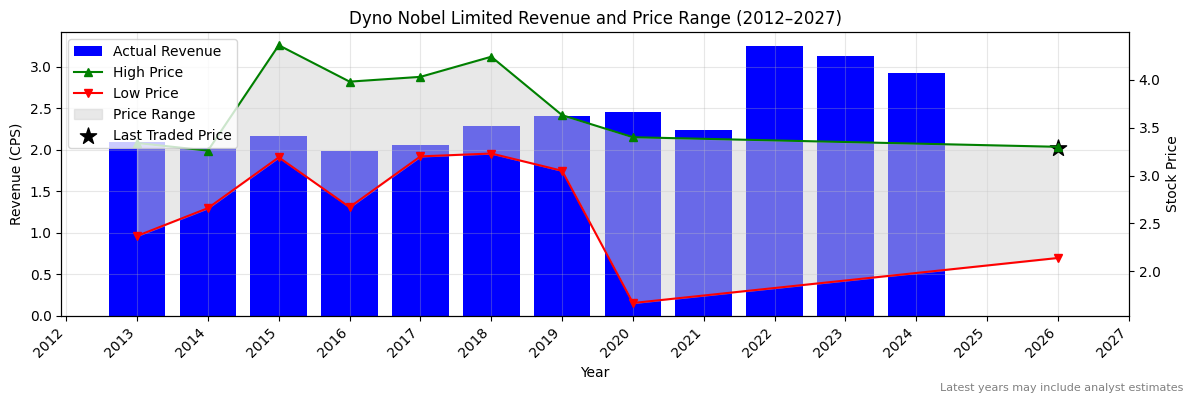
| Revenue 2024 Per Share |
Revenue 2025e Per Share |
Revenue 2026e Per Share |
Revenue 24 to 25e [%] |
Revenue 25e to 26e [%] |
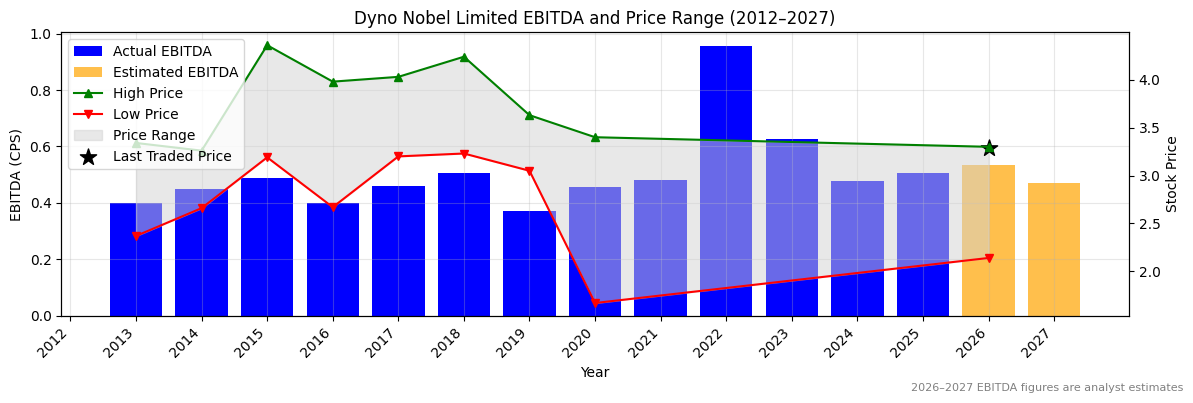
EBITDA 2024 Per Share |
EBITDA 2025e Per Share |
EBITDA 2026e Per Share |
EBITDA 24 to 25e [%] |
EBITDA 25e to 26e [%] |
| 2.91895 |
None |
None |
None |
None |
0.47616 |
0.50513 |
0.53464 |
6.1 |
5.8 |
DNL Revenue Per Share (2012–2027)
DNL Earnings before Interest, Tax, Depreciation and Amortisation (EBITDA) Per Share (2012–2027)
✅
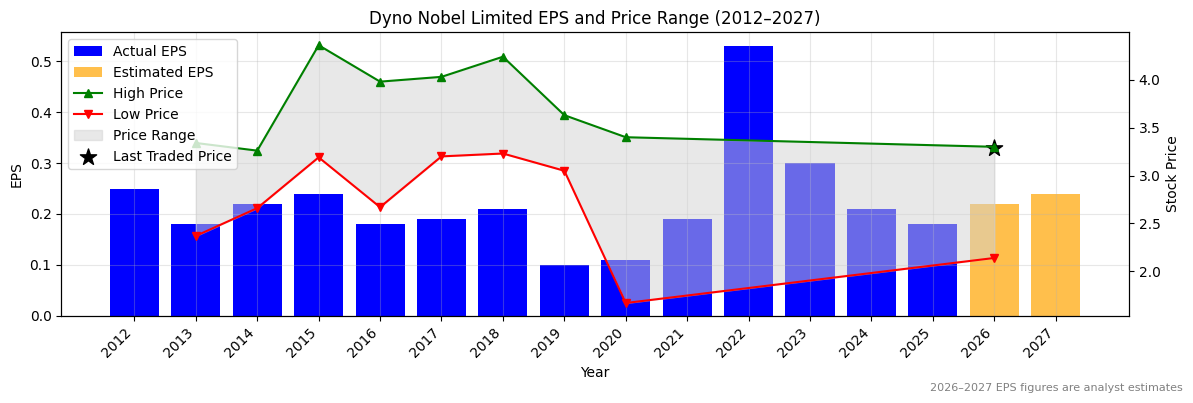
DNL Normalised Earnings Per Share (EPS) (2012–2027)
❌
Valuation
| Price To Sales |
Price To Book |
PER 2023 |
PER 2024 |
13Y Median PER Low |
PER 2025e |
13Y Median PER High |
PER 2026e |
Last Updated |
| 1.1 |
1.2 |
10.7 |
15.3 |
14.8 |
17.9 |
20.2 |
14.6 |
4/10/25 |
DNL Yearly Price Earnings Ratio (PER) Highs and Lows
✅
DNL Weekly Price Chart with Average True Range (ATR) Trailing Stop (10-Year View)
None
Ticker code: ASX:GC=
Sector: None | Industry: None | Website: N/A
Market Information
| Market Capitalisation |
Enterprise Value |
Shares Outstanding |
Free Float [%] |
Free Float Value |
| $164,610,144 |
$70,914,040 |
954932992.0 |
68.45 |
$112,667,852 |
Balance Sheet & Quality
| Equity |
Cash |
Debt |
Return On Equity (ROE) |
EBITDA 24 Margin [%] |
Net Debt / Equity [%] |
Rule of 40 |
| $236,823,378 |
$3,611,783 |
$528,899 |
None |
None |
-1.3 |
None |
Technicals & Short Data
| 3EMA Status |
Volatility [%] |
Value Traded Today |
Average Daily Liquidity |
Short [%] |
Days To Cover |
| None |
None |
$98,880 |
$278,606 |
None |
0.0 |
Dividends
| Previous Dividend |
Last Dividend |
Franking [%] |
Ex-Div Date |
Gross Yield [%] |
| None |
None |
None |
None |
None |
ASX:GC= Price Chart with Volume and 3EMA
ASX:GC= Short Positions
No chart available for this company.
Click HERE to understand why the above moving averages have been chosen.
Alfabs Australia Limited (ASX:AAL) provides mining equipment hire, manufacturing, and repair services for underground coal mining. Based in Kurri Kurri, it also offers engineering solutions and consumables.
Ticker code: AAL
Market Information
| Market Capitalisation |
Enterprise Value |
Shares Outstanding |
Free Float [%] |
Free Float Value |
| $121,799,905 |
$148,012,457 |
286588003.0 |
32.82 |
$39,971,075 |
Balance Sheet & Quality
| Equity |
Cash |
Debt |
Return On Equity (ROE) |
EBITDA 25 Margin [%] |
Net Debt / Equity [%] |
Rule of 40 |
| $64,768,886 |
$8,183,480 |
$34,396,032 |
13.3 |
28.9 |
40.5 |
None |
Technicals & Short Data
| 3EMA Status |
Volatility [%] |
Value Traded Today |
Average Daily Liquidity |
Short [%] |
Days To Cover |
| Negative |
5.0 |
$31,734 |
$36,009 |
0.0 |
0.0 |
Dividends
| Previous Dividend |
Last Dividend |
Franking [%] |
Ex-Div Date |
Gross Yield [%] |
| $0.015 |
$0.017 |
None |
2025-09-15 |
0.0 |
Price Performance Snapshot
| Last Traded Price |
Change [%] |
1 Week [%] |
1 Month [%] |
3 Months [%] |
6 Months [%] |
12 Months [%] |
| $0.425 |
None |
None |
-13.3 |
-11.3 |
23.7 |
17.6 |
AAL Price Chart with Volume and 3EMA
AAL Short Positions
Click HERE to understand why the above moving averages have been chosen.
Wagners Holding Company Limited (ASX:WGN) supplies construction materials like cement, concrete, and aggregates, plus composite fibre technologies. Based in Wellcamp, Australia, it also offers project services and sustainable building materials.
Ticker code: WGN
Market Information
| Market Capitalisation |
Enterprise Value |
Shares Outstanding |
Free Float [%] |
Free Float Value |
| $707,022,344 |
$873,231,344 |
199723828.0 |
49.03 |
$346,662,578 |
Balance Sheet & Quality
| Equity |
Cash |
Debt |
Return On Equity (ROE) |
EBITDA 25 Margin [%] |
Net Debt / Equity [%] |
Rule of 40 |
| $163,973,256 |
$23,017,000 |
$189,226,000 |
12.6 |
15.3 |
101.4 |
2.2 |
Technicals & Short Data
| 3EMA Status |
Volatility [%] |
Value Traded Today |
Average Daily Liquidity |
Short [%] |
Days To Cover |
| Positive |
11.2 |
$808,699 |
$1,580,960 |
0.0 |
0.0 |
Dividends
| Previous Dividend |
Last Dividend |
Franking [%] |
Ex-Div Date |
Gross Yield [%] |
| $0.025 |
$0.032 |
100.0 |
2025-09-09 |
0.0 |
Price Performance Snapshot
| Last Traded Price |
Change [%] |
1 Week [%] |
1 Month [%] |
3 Months [%] |
6 Months [%] |
12 Months [%] |
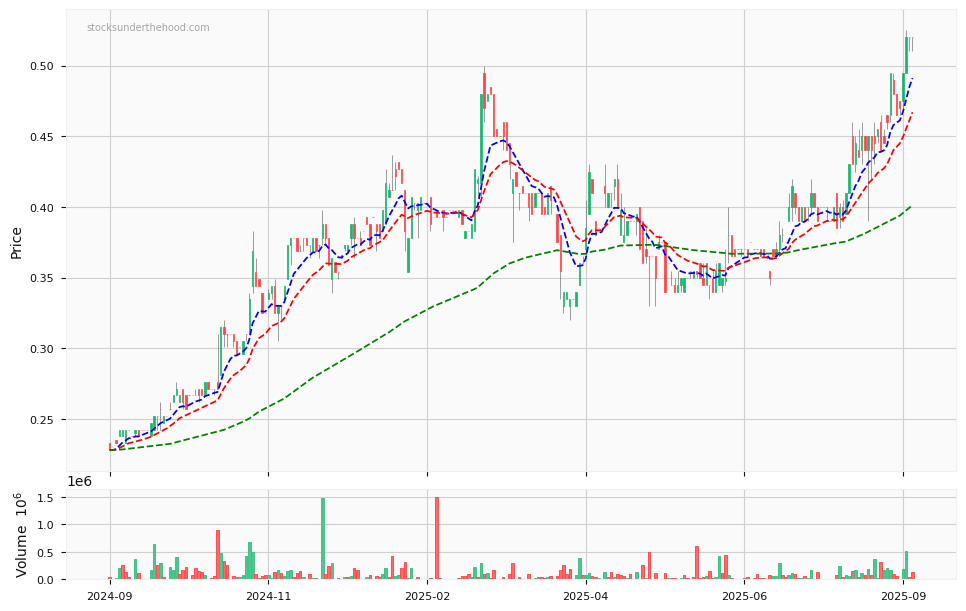
| $3.540 |
0.3 |
1.4 |
31.1 |
42.2 |
82.8 |
161.6 |
WGN Price Chart with Volume and 3EMA
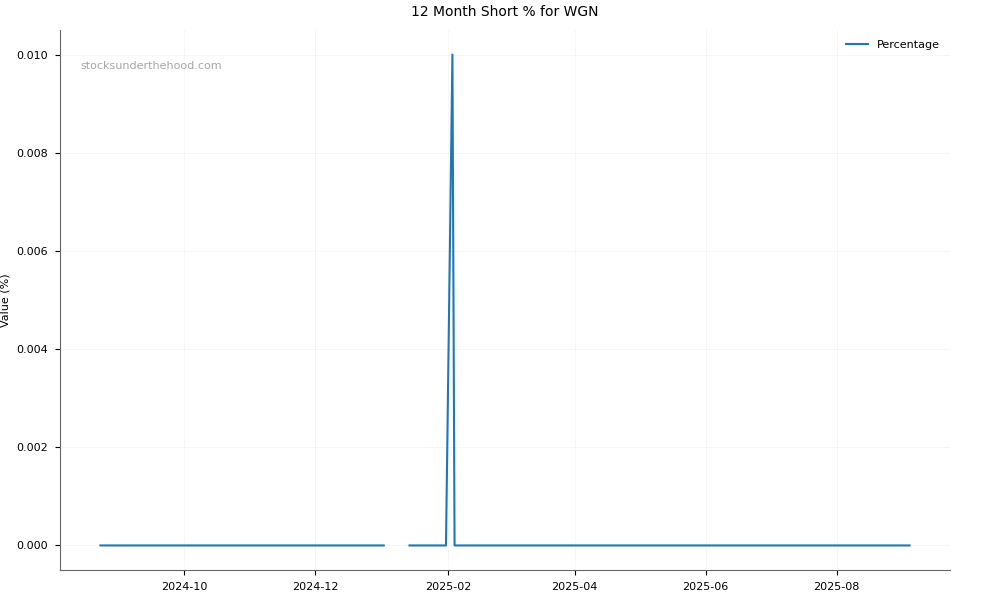
WGN Short Positions
Click HERE to understand why the above moving averages have been chosen.
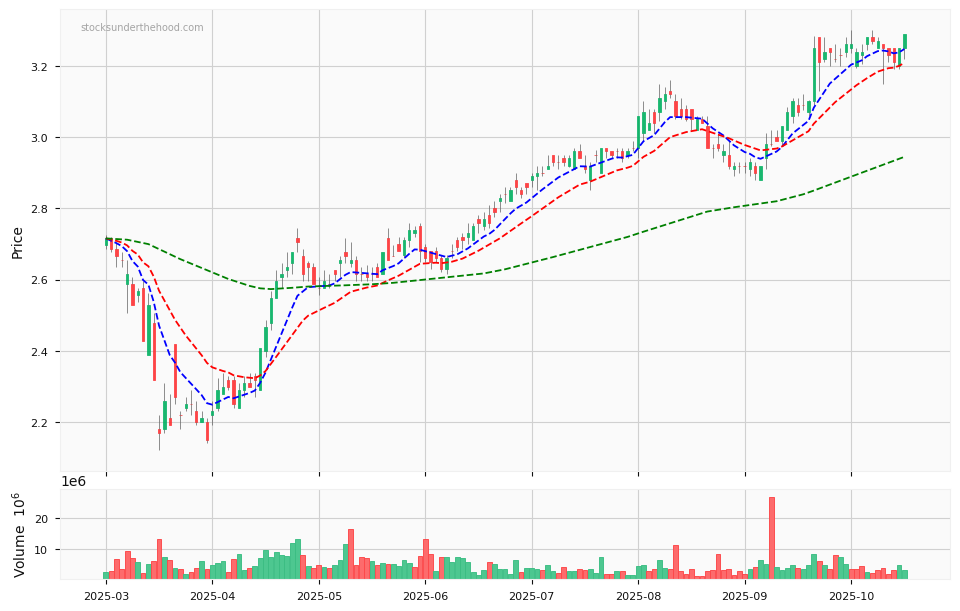
Dyno Nobel Limited is a global industrial chemicals company manufacturing and distributing fertilizers, explosives, and industrial chemicals for the agriculture and mining industries.
Ticker code: DNL
Market Information
| Market Capitalisation |
Enterprise Value |
Shares Outstanding |
Free Float [%] |
Free Float Value |
| $6,122,218,749 |
$7,483,618,685 |
1795372022 |
93.21 |
$5,706,789,941 |
Balance Sheet & Quality
| Equity |
Cash |
Debt |
Return On Equity (ROE) |
EBITDA 25 Margin [%] |
Net Debt / Equity [%] |
Rule of 40 |
| $4,330,437,153 |
$655,600,000 |
$2,016,999,936 |
8.0 |
None |
31.4 |
None |
Technicals & Short Data
| 3EMA Status |
Volatility [%] |
Value Traded Today |
Average Daily Liquidity |
Short [%] |
Days To Cover |
| Positive |
5.2 |
$19,032,609 |
$16,813,009 |
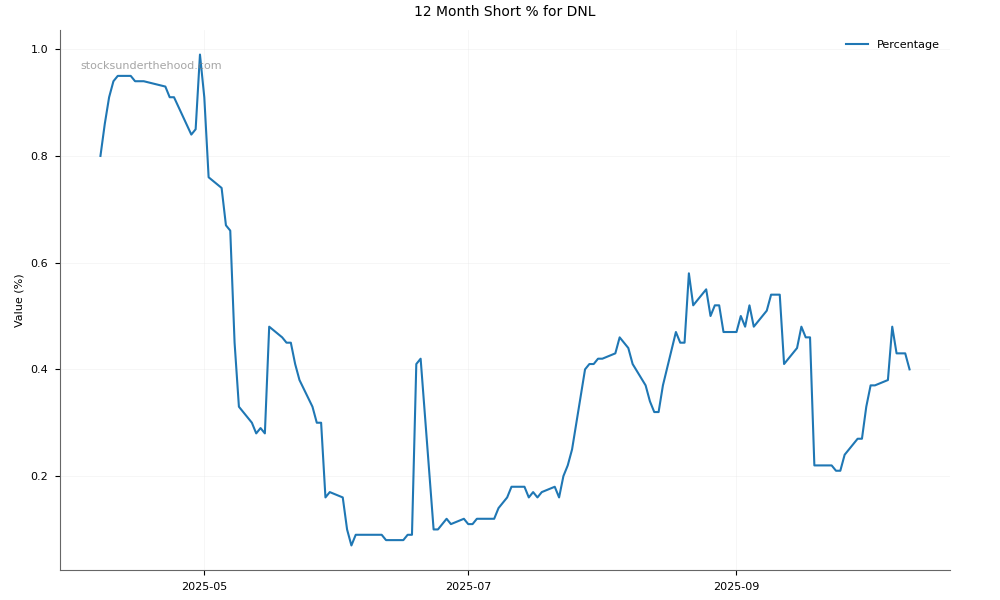
0.6 |
2.2 |
Dividends
| Previous Dividend |
Last Dividend |
Franking [%] |
Ex-Div Date |
Gross Yield [%] |
| None |
$0.024 |
55.0 |
2025-06-13 |
0.0 |
Price Performance Snapshot
| Last Traded Price |
Change [%] |
1 Week [%] |
1 Month [%] |
3 Months [%] |
6 Months [%] |
12 Months [%] |
| $3.410 |
0.6 |
2.4 |
5.9 |
11.8 |
30.3 |
14.8 |
DNL Price Chart with Volume and 3EMA
DNL Short Positions
Click HERE to understand why the above moving averages have been chosen.
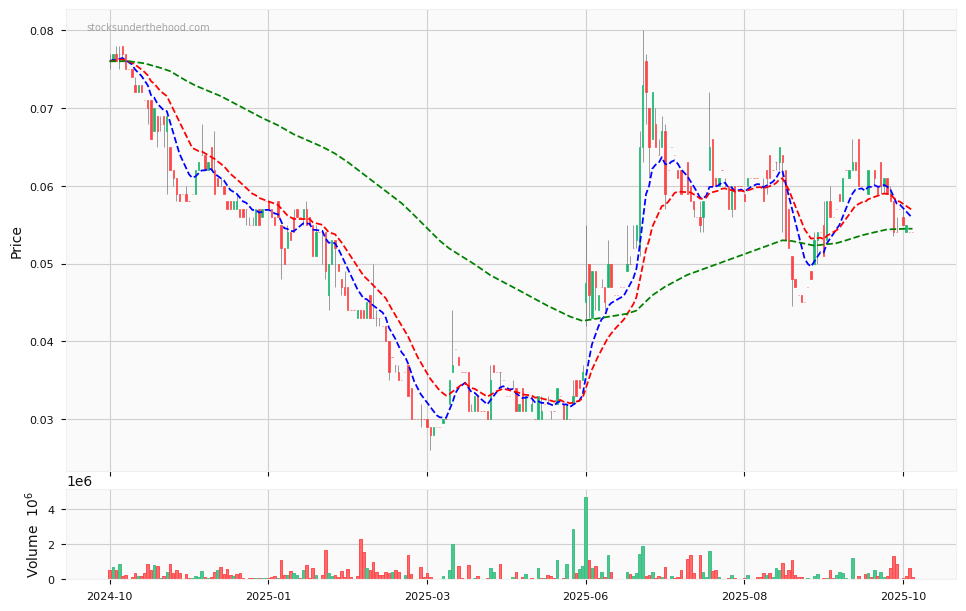
DXN Limited (ASX:DXN) is an Australian data centre company designing, manufacturing, and operating modular facilities globally. It provides prefabricated solutions, colocation services, and edge computing through segments in manufacturing, operations, and data centre as a service.
Ticker code: DXN
Sector: None | Industry: None | Website: N/A
Market Information
| Market Capitalisation |
Enterprise Value |
Shares Outstanding |
Free Float [%] |
Free Float Value |
| $15,601,850 |
$18,564,736 |
312036972.0 |
64.84 |
$10,116,346 |
Balance Sheet & Quality
| Equity |
Cash |
Debt |
Return On Equity (ROE) |
EBITDA 25 Margin [%] |
Net Debt / Equity [%] |
Rule of 40 |
| $4,992,592 |
$3,119,895 |
$6,450,746 |
None |
None |
66.7 |
None |
Technicals & Short Data
| 3EMA Status |
Volatility [%] |
Value Traded Today |
Average Daily Liquidity |
Short [%] |
Days To Cover |
| None |
None |
$2,836 |
$15,690 |
None |
0.0 |
Dividends
| Previous Dividend |
Last Dividend |
Franking [%] |
Ex-Div Date |
Gross Yield [%] |
| None |
None |
None |
None |
None |
Price Performance Snapshot
| Last Traded Price |
Change [%] |
1 Week [%] |
1 Month [%] |
3 Months [%] |
6 Months [%] |
12 Months [%] |
| $0.050 |
-2.0 |
-9.1 |
-18.0 |
None |
None |
None |
DXN Price Chart with Volume and 3EMA
DXN Short Positions
Click HERE to understand why the above moving averages have been chosen.
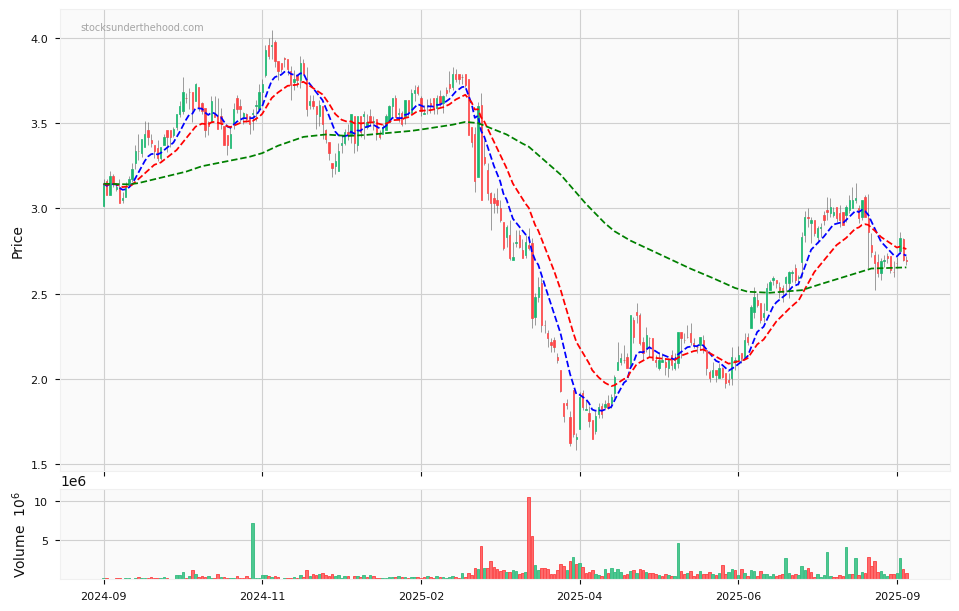
Regal Partners Limited (ASX:RPL) is an Australian-based specialist alternative investment manager formed in June 2022 through the merger of Regal Funds Management and VGI Partners. The company manages over A$17.2 billion in funds.
Ticker code: RPL
Market Information
| Market Capitalisation |
Enterprise Value |
Shares Outstanding |
Free Float [%] |
Free Float Value |
| $1,145,139,097 |
$1,028,062,097 |
369399720.0 |
58.16 |
$666,067,136 |
Balance Sheet & Quality
| Equity |
Cash |
Debt |
Return On Equity (ROE) |
EBITDA 25 Margin [%] |
Net Debt / Equity [%] |
Rule of 40 |
| $940,491,681 |
$166,042,000 |
$48,965,000 |
7.2 |
51.1 |
-12.4 |
63.1 |
Technicals & Short Data
| 3EMA Status |
Volatility [%] |
Value Traded Today |
Average Daily Liquidity |
Short [%] |
Days To Cover |
| Positive |
6.4 |
$2,735,781 |
$5,459,273 |
0.45 |
0.9 |
Dividends
| Previous Dividend |
Last Dividend |
Franking [%] |
Ex-Div Date |
Gross Yield [%] |
| $0.100 |
$0.060 |
None |
2025-08-29 |
0.0 |
Price Performance Snapshot
| Last Traded Price |
Change [%] |
1 Week [%] |
1 Month [%] |
3 Months [%] |
6 Months [%] |
12 Months [%] |
| $3.100 |
0.3 |
5.8 |
6.2 |
14.8 |
39.1 |
-19.6 |
RPL Price Chart with Volume and 3EMA
RPL Short Positions
Click HERE to understand why the above moving averages have been chosen.
Ticker code: RPL
RPL Red Flags & Risk Indicators
❌
⚠️ RED FLAGS: 4 identified
- Large Share Issuance
- Increasing Shorts
- Falling Earnings
- Falling EBITDA Margins
Income Statement
| Revenue 2024 Per Share |
Revenue 2025e Per Share |
Revenue 2026e Per Share |
Revenue 24 to 25e [%] |
Revenue 25e to 26e [%] |
EBITDA 2024 Per Share |
EBITDA 2025e Per Share |
EBITDA 2026e Per Share |
EBITDA 24 to 25e [%] |
EBITDA 25e to 26e [%] |
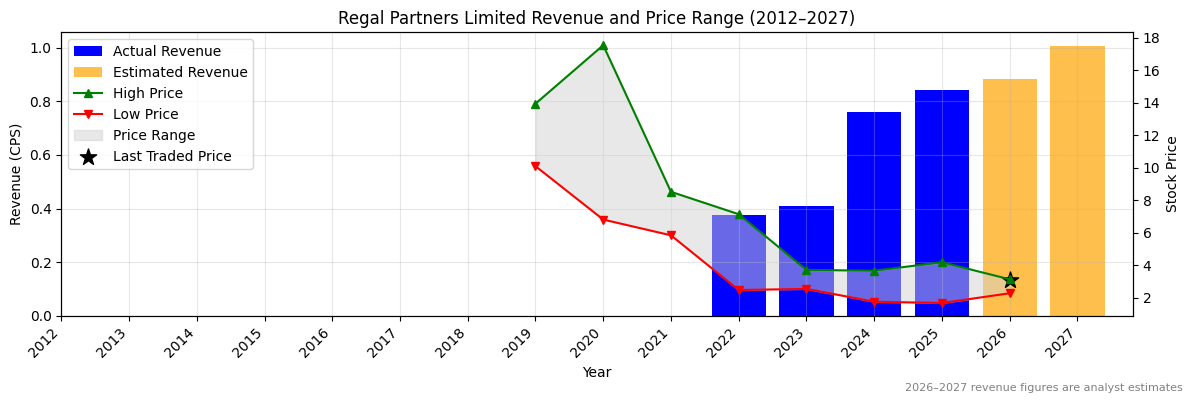
| 0.76189 |
0.84037 |
0.88468 |
10.3 |
5.3 |
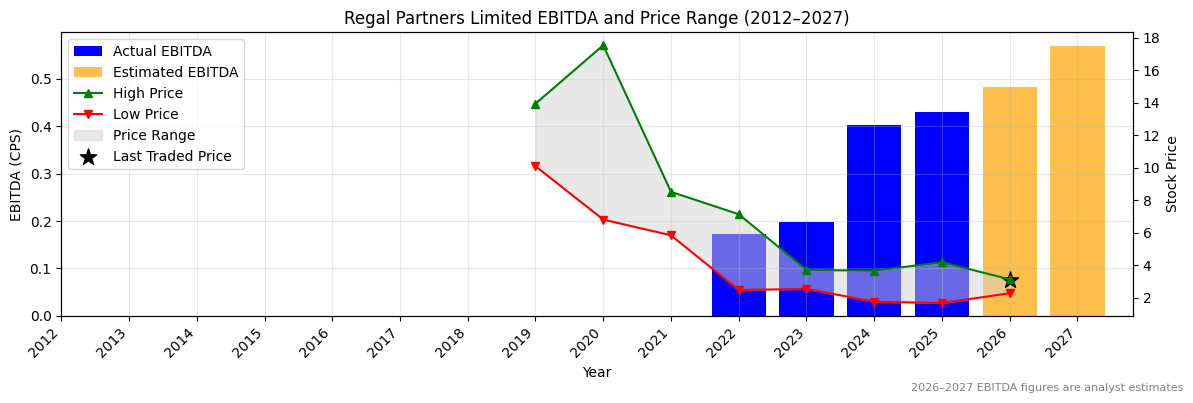
0.40211 |
0.42959 |
0.48235 |
6.8 |
12.3 |
RPL Revenue Per Share (2012–2027)
✅
RPL Earnings before Interest, Tax, Depreciation and Amortisation (EBITDA) Per Share (2012–2027)
✅
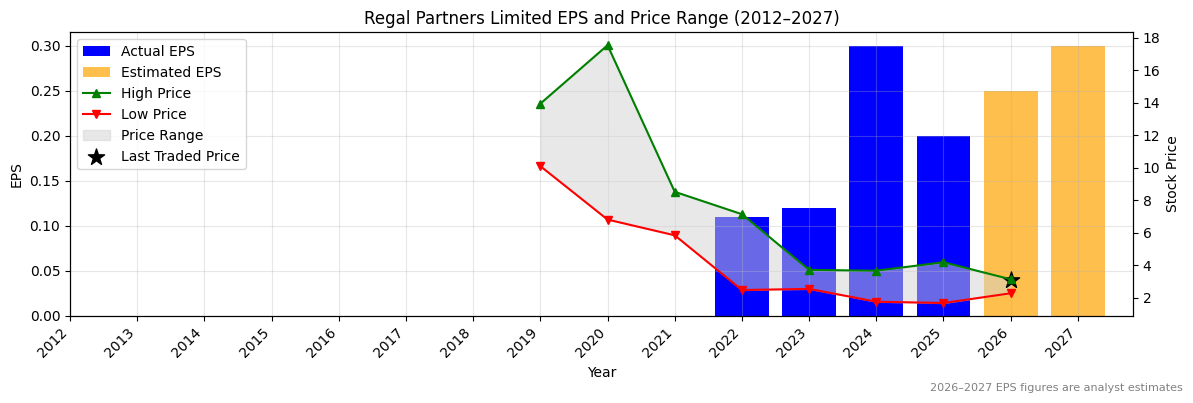
RPL Normalised Earnings Per Share (EPS) (2012–2027)
❌
Valuation
| Price To Sales |
Price To Book |
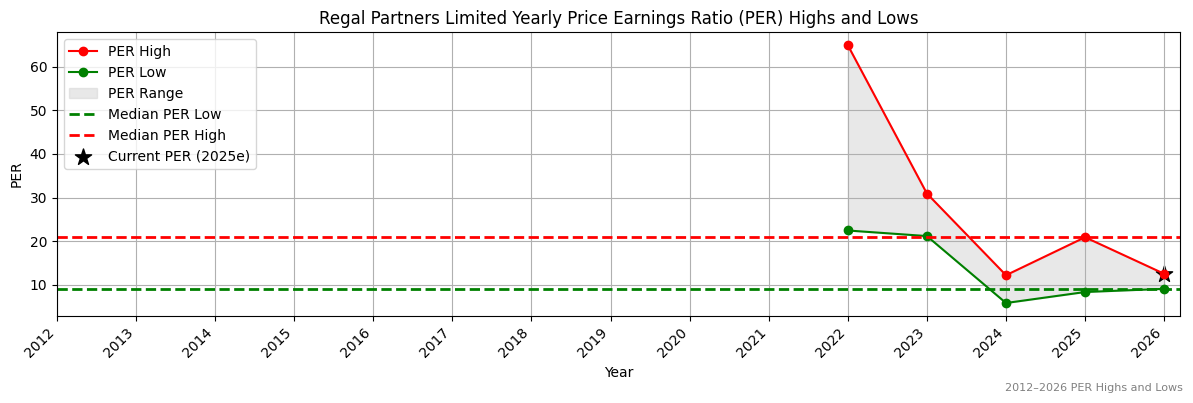
PER 2023 |
PER 2024 |
13Y Median PER Low |
PER 2025e |
13Y Median PER High |
PER 2026e |
Last Updated |
| 4.4 |
1.1 |
24.3 |
9.7 |
9.1 |
14.6 |
20.9 |
11.7 |
7/10/25 |
RPL Yearly Price Earnings Ratio (PER) Highs and Lows
✅
RPL Weekly Price Chart with Average True Range (ATR) Trailing Stop (10-Year View)
Ticker code: GVF
GVF Red Flags & Risk Indicators
✅
⚠️ RED FLAGS: 0 identified
No red flags detected.
Income Statement
| Revenue 2024 Per Share |
Revenue 2025e Per Share |
Revenue 2026e Per Share |
Revenue 24 to 25e [%] |
Revenue 25e to 26e [%] |
EBITDA 2024 Per Share |
EBITDA 2025e Per Share |
EBITDA 2026e Per Share |
EBITDA 24 to 25e [%] |
EBITDA 25e to 26e [%] |
| None |
None |
None |
None |
None |
None |
None |
None |
None |
None |
GVF Revenue Per Share (2012–2027)
GVF Earnings before Interest, Tax, Depreciation and Amortisation (EBITDA) Per Share (2012–2027)
GVF Normalised Earnings Per Share (EPS) (2012–2027)
Valuation
| Price To Sales |
Price To Book |
PER 2023 |
PER 2024 |
13Y Median PER Low |
PER 2025e |
13Y Median PER High |
PER 2026e |
Last Updated |
| None |
None |
None |
None |
None |
None |
None |
None |
None |
GVF Yearly Price Earnings Ratio (PER) Highs and Lows
GVF Weekly Price Chart with Average True Range (ATR) Trailing Stop (10-Year View)
The Global Value Fund (ASX: GVF) is a listed investment Company that provides shareholders with the opportunity to invest globally through a portfolio of securities purchased at a discount to their underlying asset value.
Ticker code: GVF
Market Information
| Market Capitalisation |
Enterprise Value |
Shares Outstanding |
Free Float [%] |
Free Float Value |
| $282,973,408 |
None |
202123867.0 |
0.0 |
$0 |
Balance Sheet & Quality
| Equity |
Cash |
Debt |
Return On Equity (ROE) |
EBITDA 25 Margin [%] |
Net Debt / Equity [%] |
Rule of 40 |
| None |
None |
None |
None |
None |
0.0 |
None |
Technicals & Short Data
| 3EMA Status |
Volatility [%] |
Value Traded Today |
Average Daily Liquidity |
Short [%] |
Days To Cover |
| Positive |
3.2 |
$26,925 |
$141,403 |
None |
0.0 |
Dividends
| Previous Dividend |
Last Dividend |
Franking [%] |
Ex-Div Date |
Gross Yield [%] |
| $0.033 |
$0.033 |
None |
2025-09-30 |
None |
Price Performance Snapshot
| Last Traded Price |
Change [%] |
1 Week [%] |
1 Month [%] |
3 Months [%] |
6 Months [%] |
12 Months [%] |
| $1.400 |
-0.7 |
-1.2 |
0.7 |
2.4 |
4.3 |
11.3 |
GVF Price Chart with Volume and 3EMA
GVF Short Positions
No chart available for this company.
Click HERE to understand why the above moving averages have been chosen.
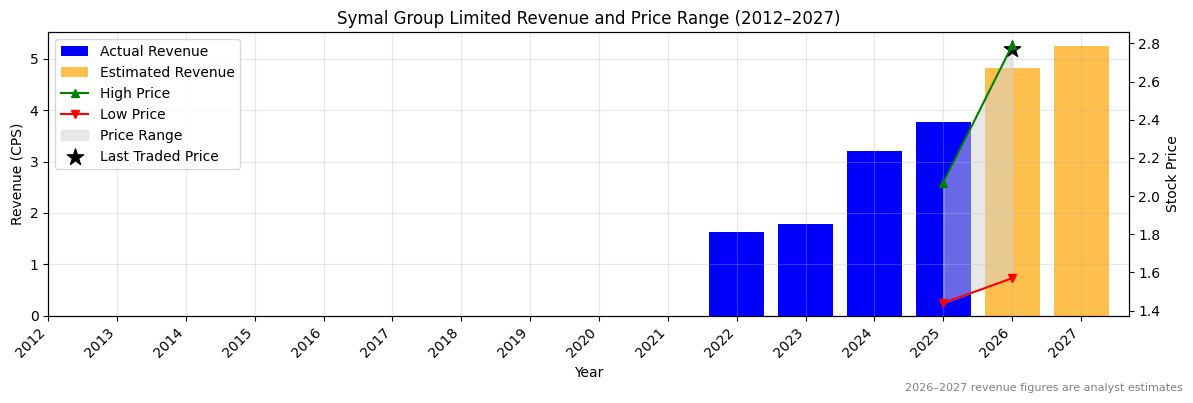
Ticker code: SYL
SYL Red Flags & Risk Indicators
⚠️
⚠️ RED FLAGS: 1 identified
Income Statement
| Revenue 2024 Per Share |
Revenue 2025e Per Share |
Revenue 2026e Per Share |
Revenue 24 to 25e [%] |
Revenue 25e to 26e [%] |
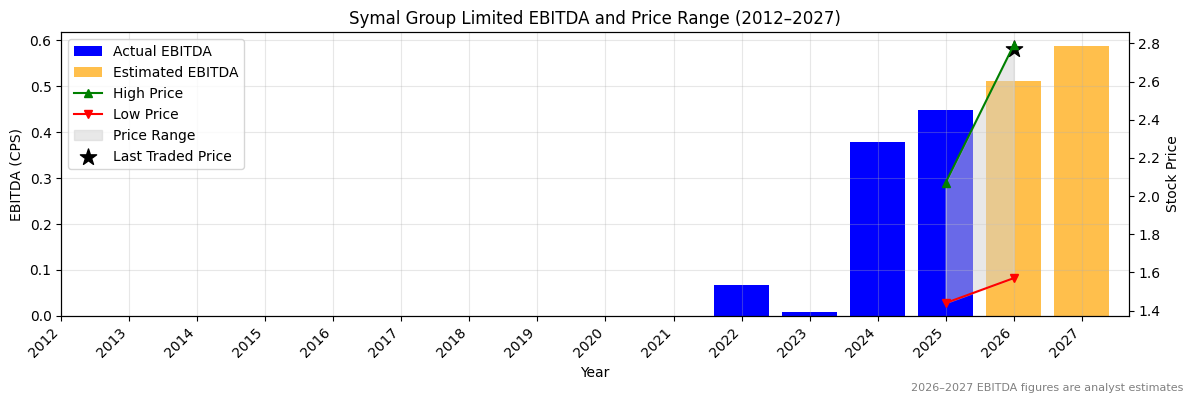
EBITDA 2024 Per Share |
EBITDA 2025e Per Share |
EBITDA 2026e Per Share |
EBITDA 24 to 25e [%] |
EBITDA 25e to 26e [%] |
| 3.20646 |
3.76265 |
4.81134 |
17.3 |
27.9 |
0.37968 |
0.44919 |
0.51249 |
18.3 |
14.1 |
SYL Revenue Per Share (2012–2027)
✅
SYL Earnings before Interest, Tax, Depreciation and Amortisation (EBITDA) Per Share (2012–2027)
✅
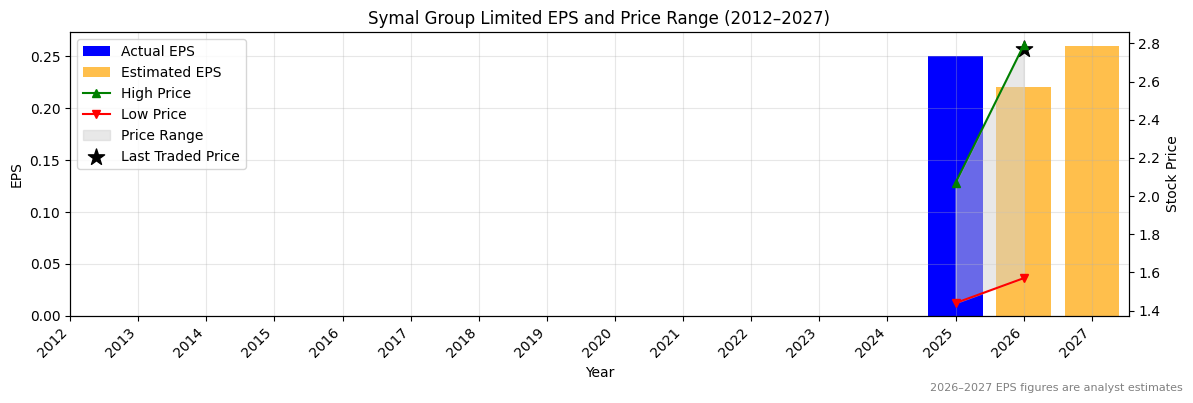
SYL Normalised Earnings Per Share (EPS) (2012–2027)
✅✅
Valuation
| Price To Sales |
Price To Book |
PER 2023 |
PER 2024 |
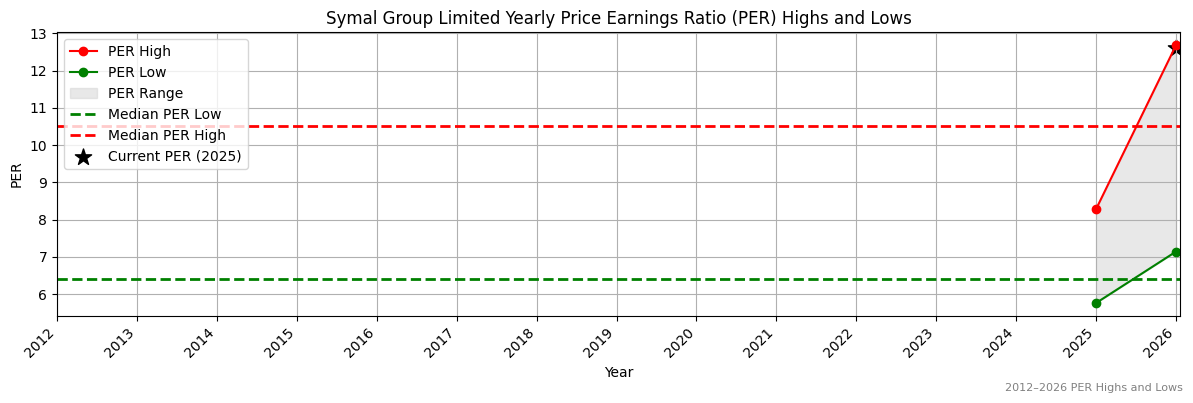
13Y Median PER Low |
PER 2025e |
13Y Median PER High |
PER 2026e |
Last Updated |
| 0.6 |
3.3 |
None |
None |
6.4 |
9.6 |
10.0 |
10.9 |
20/10/25 |
SYL Yearly Price Earnings Ratio (PER) Highs and Lows
✅
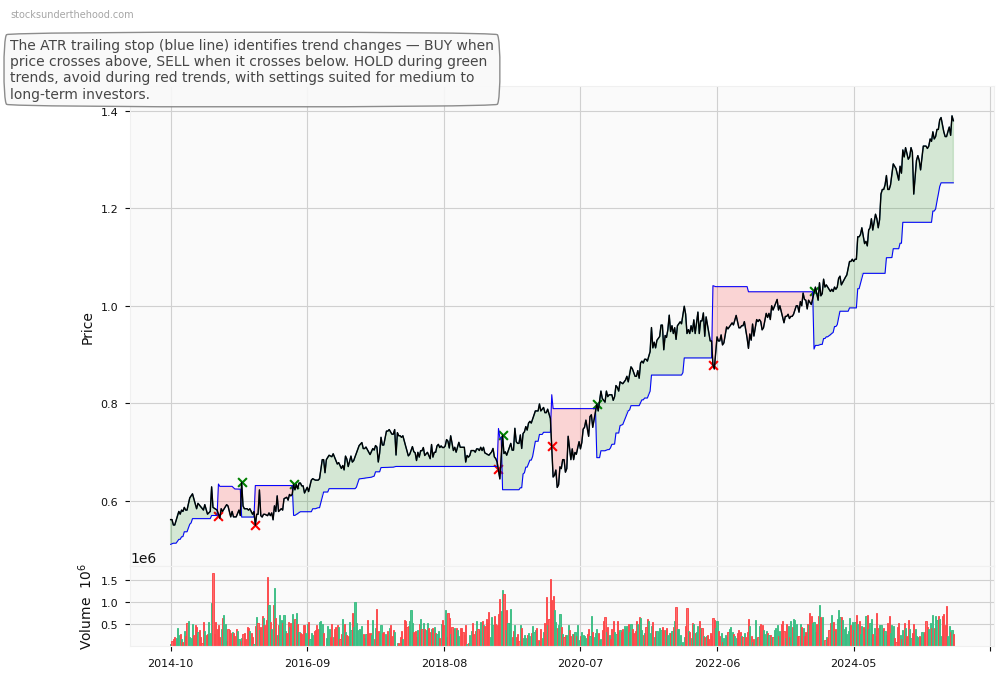
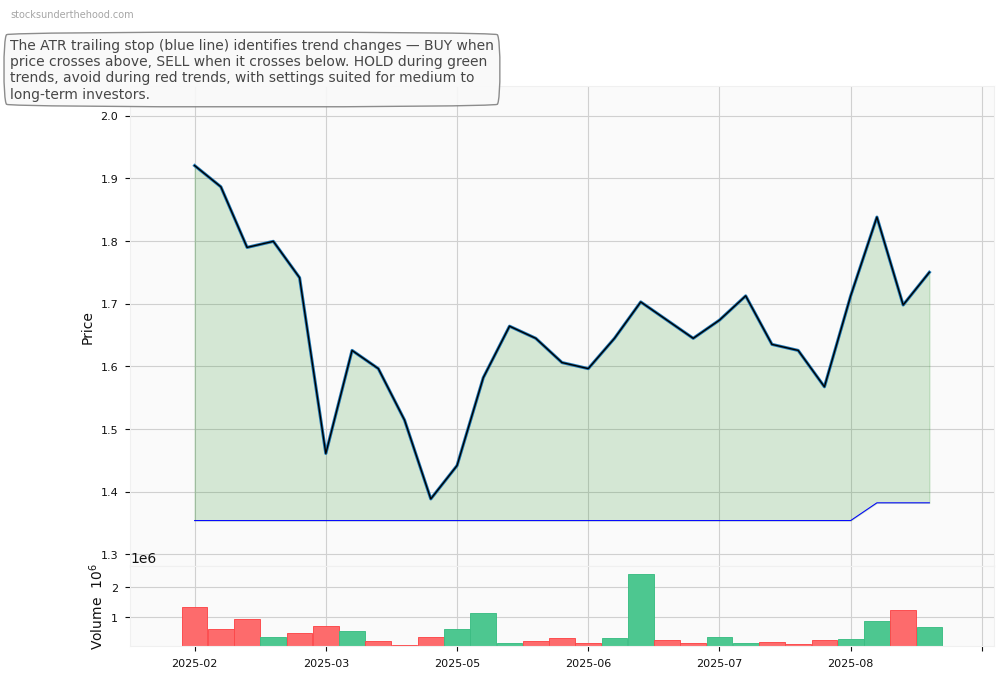
SYL Weekly Price Chart with Average True Range (ATR) Trailing Stop (10-Year View)
This content is restricted to supporters of stocksunderthehood.com
Become a supporter or take a free 14 day trial here:
Join
This content is restricted to supporters of stocksunderthehood.com
Become a supporter or take a free 14 day trial here:
Join
This content is restricted to supporters of stocksunderthehood.com
Become a supporter or take a free 14 day trial here:
Join
This content is restricted to supporters of stocksunderthehood.com
Become a supporter or take a free 14 day trial here:
Join
This content is restricted to supporters of stocksunderthehood.com
Become a supporter or take a free 14 day trial here:
Join