This content is restricted to supporters of stocksunderthehood.com
Become a supporter or take a free 14 day trial here:
This content is restricted to supporters of stocksunderthehood.com
Become a supporter or take a free 14 day trial here:
This content is restricted to supporters of stocksunderthehood.com
Become a supporter or take a free 14 day trial here:
This content is restricted to supporters of stocksunderthehood.com
Become a supporter or take a free 14 day trial here:
No red flags detected.
| Revenue 2024 Per Share | Revenue 2025e Per Share | Revenue 2026e Per Share | Revenue 24 to 25e [%] | Revenue 25e to 26e [%] | EBITDA 2024 Per Share | EBITDA 2025e Per Share | EBITDA 2026e Per Share | EBITDA 24 to 25e [%] | EBITDA 25e to 26e [%] |
|---|---|---|---|---|---|---|---|---|---|
| None | None | None | None | None | None | None | None | None | None |

| Price To Sales | Price To Book | PER 2023 | PER 2024 | 13Y Median PER Low | PER 2025e | 13Y Median PER High | PER 2026e | Last Updated |
|---|---|---|---|---|---|---|---|---|
| None | None | None | None | None | None | None | None | None |

This content is restricted to supporters of stocksunderthehood.com
Become a supporter or take a free 14 day trial here:
This content is restricted to supporters of stocksunderthehood.com
Become a supporter or take a free 14 day trial here:
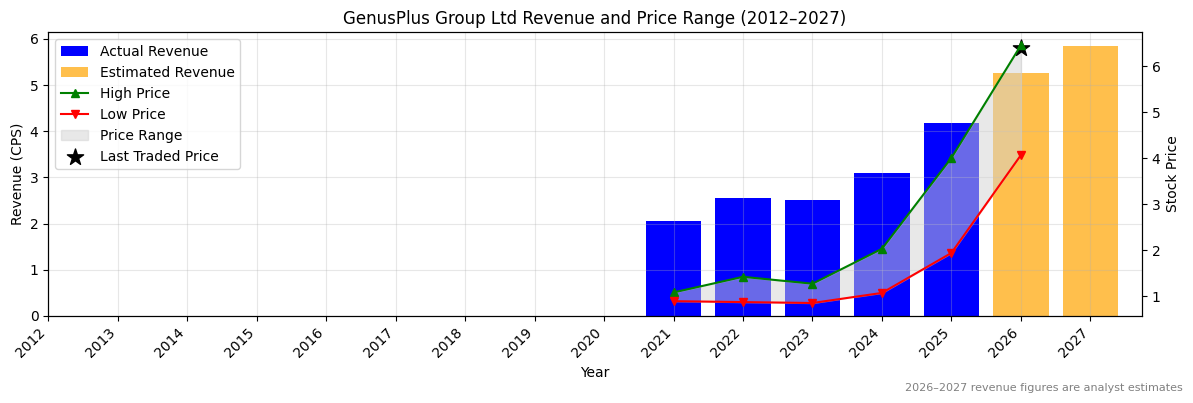
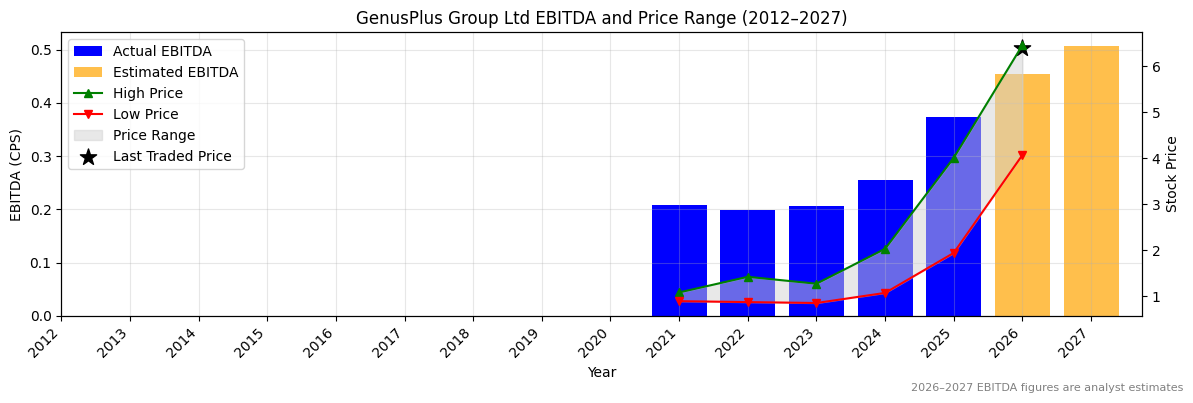
| Revenue 2024 Per Share | Revenue 2025e Per Share | Revenue 2026e Per Share | Revenue 24 to 25e [%] | Revenue 25e to 26e [%] | EBITDA 2024 Per Share | EBITDA 2025e Per Share | EBITDA 2026e Per Share | EBITDA 24 to 25e [%] | EBITDA 25e to 26e [%] |
|---|---|---|---|---|---|---|---|---|---|
| 3.1018 | 4.16942 | 5.251 | 34.4 | 25.9 | 0.25515 | 0.37389 | 0.45448 | 46.5 | 21.6 |
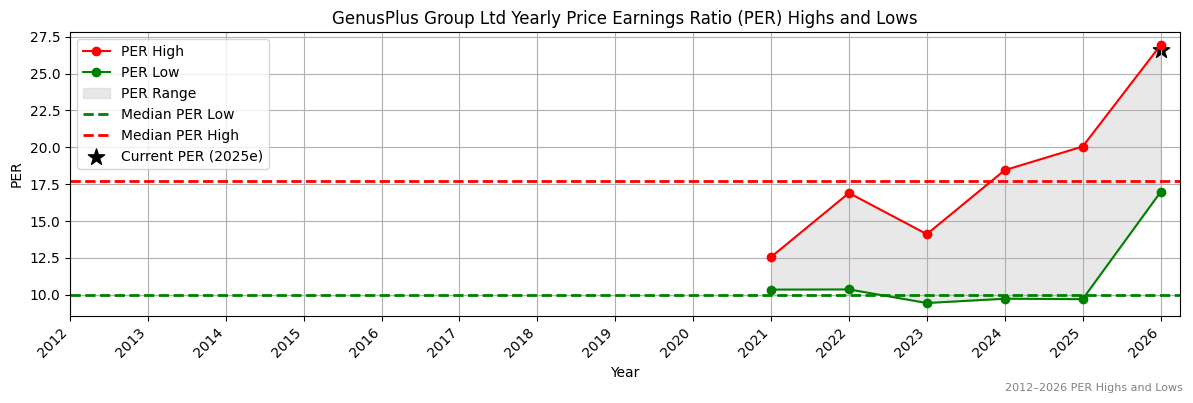
| Price To Sales | Price To Book | PER 2023 | PER 2024 | 13Y Median PER Low | PER 2025e | 13Y Median PER High | PER 2026e | Last Updated |
|---|---|---|---|---|---|---|---|---|
| 1.7 | 7.8 | 77.2 | 63.2 | 10.0 | 34.7 | 17.7 | 29.0 | 4/10/25 |
This content is restricted to supporters of stocksunderthehood.com
Become a supporter or take a free 14 day trial here:
This content is restricted to supporters of stocksunderthehood.com
Become a supporter or take a free 14 day trial here:
This content is restricted to supporters of stocksunderthehood.com
Become a supporter or take a free 14 day trial here:
This content is restricted to supporters of stocksunderthehood.com
Become a supporter or take a free 14 day trial here:
This content is restricted to supporters of stocksunderthehood.com
Become a supporter or take a free 14 day trial here:
No red flags detected.
| Revenue 2024 Per Share | Revenue 2025e Per Share | Revenue 2026e Per Share | Revenue 24 to 25e [%] | Revenue 25e to 26e [%] | EBITDA 2024 Per Share | EBITDA 2025e Per Share | EBITDA 2026e Per Share | EBITDA 24 to 25e [%] | EBITDA 25e to 26e [%] |
|---|---|---|---|---|---|---|---|---|---|
| None | None | None | None | None | None | None | None | None | None |
| Price To Sales | Price To Book | PER 2023 | PER 2024 | 13Y Median PER Low | PER 2025e | 13Y Median PER High | PER 2026e | Last Updated |
|---|---|---|---|---|---|---|---|---|
| None | None | None | None | None | None | None | None | None |
No red flags detected.
| Revenue 2024 Per Share | Revenue 2025e Per Share | Revenue 2026e Per Share | Revenue 24 to 25e [%] | Revenue 25e to 26e [%] | EBITDA 2024 Per Share | EBITDA 2025e Per Share | EBITDA 2026e Per Share | EBITDA 24 to 25e [%] | EBITDA 25e to 26e [%] |
|---|---|---|---|---|---|---|---|---|---|
| None | None | None | None | None | None | None | None | None | None |


| Price To Sales | Price To Book | PER 2023 | PER 2024 | 13Y Median PER Low | PER 2025e | 13Y Median PER High | PER 2026e | Last Updated |
|---|---|---|---|---|---|---|---|---|
| None | None | None | None | None | None | None | None | None |
| Revenue 2024 Per Share | Revenue 2025e Per Share | Revenue 2026e Per Share | Revenue 24 to 25e [%] | Revenue 25e to 26e [%] | EBITDA 2024 Per Share | EBITDA 2025e Per Share | EBITDA 2026e Per Share | EBITDA 24 to 25e [%] | EBITDA 25e to 26e [%] |
|---|---|---|---|---|---|---|---|---|---|
| 0.09864 | 0.19395 | 0.4544 | 96.6 | 134.3 | 0.06453 | 0.09753 | 0.22664 | 51.1 | 132.4 |
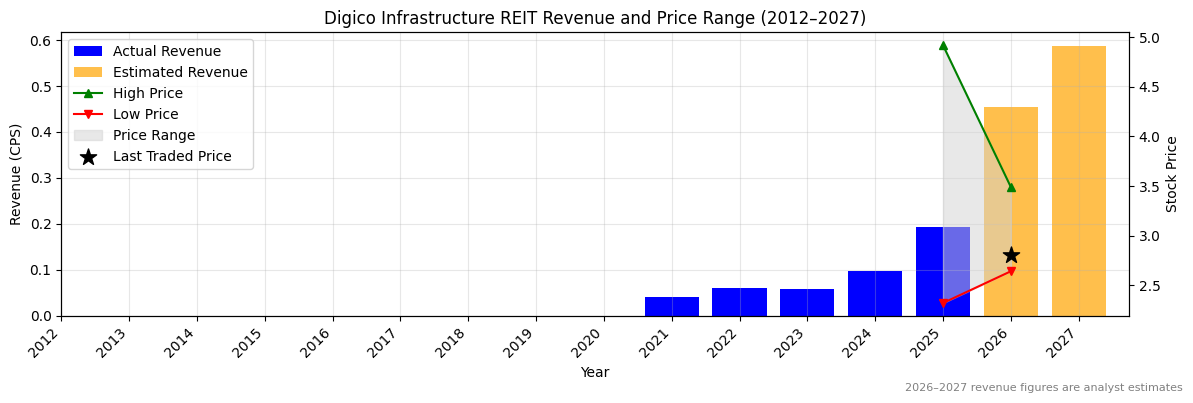
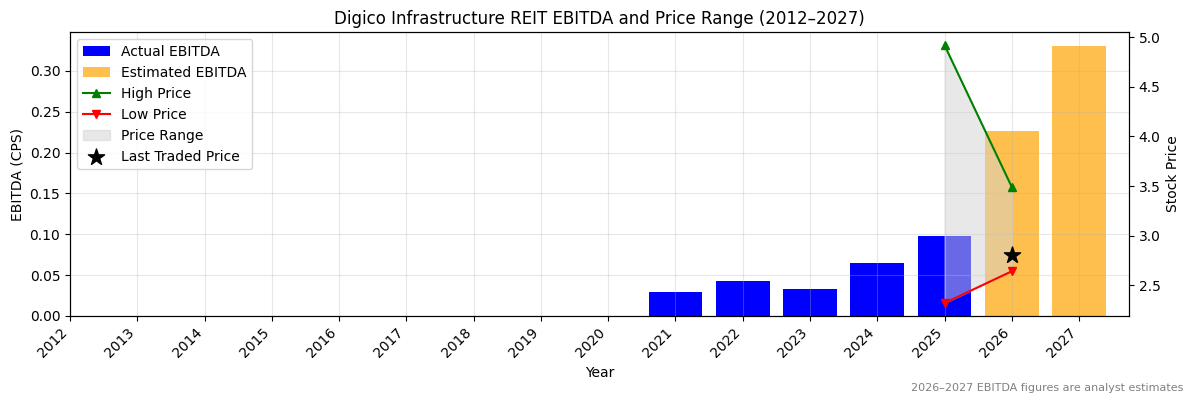
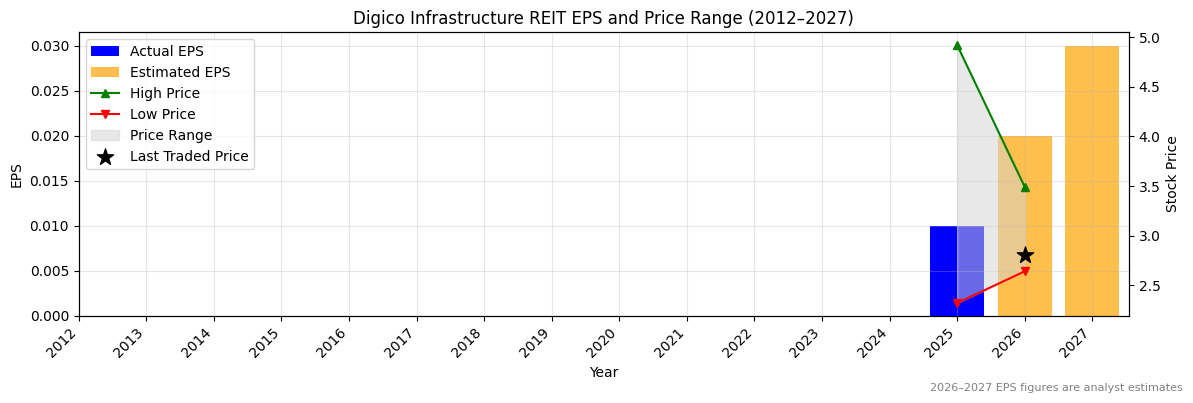
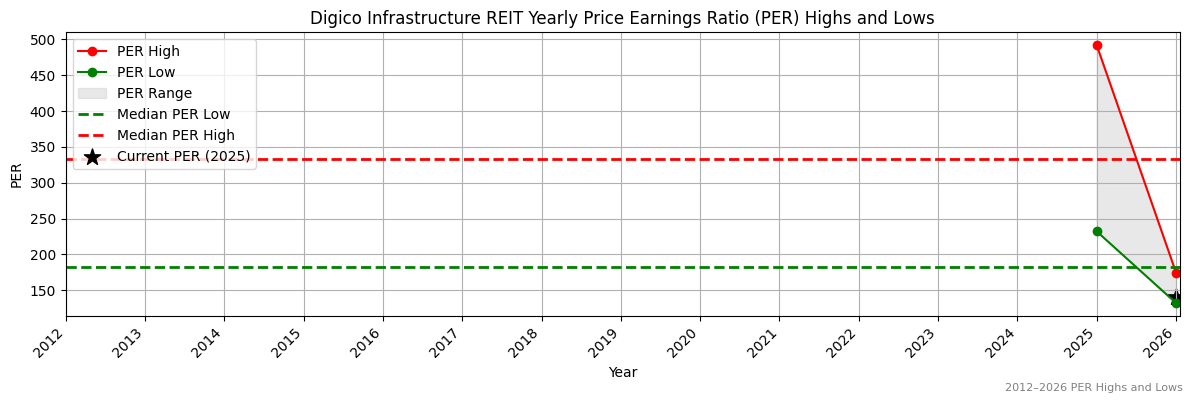
| Price To Sales | Price To Book | PER 2023 | PER 2024 | 13Y Median PER Low | PER 2025e | 13Y Median PER High | PER 2026e | Last Updated |
|---|---|---|---|---|---|---|---|---|
| None | 0.6 | None | None | 182.0 | 261.0 | 333.3 | 130.5 | 4/10/25 |

No red flags detected.
| Revenue 2024 Per Share | Revenue 2025e Per Share | Revenue 2026e Per Share | Revenue 24 to 25e [%] | Revenue 25e to 26e [%] | EBITDA 2024 Per Share | EBITDA 2025e Per Share | EBITDA 2026e Per Share | EBITDA 24 to 25e [%] | EBITDA 25e to 26e [%] |
|---|---|---|---|---|---|---|---|---|---|
| None | None | None | None | None | None | None | None | None | None |


| Price To Sales | Price To Book | PER 2023 | PER 2024 | 13Y Median PER Low | PER 2025e | 13Y Median PER High | PER 2026e | Last Updated |
|---|---|---|---|---|---|---|---|---|
| 26704.9 | 0.7 | None | None | None | None | None | None | None |
No red flags detected.
| Revenue 2024 Per Share | Revenue 2025e Per Share | Revenue 2026e Per Share | Revenue 24 to 25e [%] | Revenue 25e to 26e [%] | EBITDA 2024 Per Share | EBITDA 2025e Per Share | EBITDA 2026e Per Share | EBITDA 24 to 25e [%] | EBITDA 25e to 26e [%] |
|---|---|---|---|---|---|---|---|---|---|
| None | None | None | None | None | None | None | None | None | None |


| Price To Sales | Price To Book | PER 2023 | PER 2024 | 13Y Median PER Low | PER 2025e | 13Y Median PER High | PER 2026e | Last Updated |
|---|---|---|---|---|---|---|---|---|
| 0.8 | 1.4 | None | None | None | None | None | None | None |


No red flags detected.
| Revenue 2024 Per Share | Revenue 2025e Per Share | Revenue 2026e Per Share | Revenue 24 to 25e [%] | Revenue 25e to 26e [%] | EBITDA 2024 Per Share | EBITDA 2025e Per Share | EBITDA 2026e Per Share | EBITDA 24 to 25e [%] | EBITDA 25e to 26e [%] |
|---|---|---|---|---|---|---|---|---|---|
| None | None | None | None | None | None | None | None | None | None |


| Price To Sales | Price To Book | PER 2023 | PER 2024 | 13Y Median PER Low | PER 2025e | 13Y Median PER High | PER 2026e | Last Updated |
|---|---|---|---|---|---|---|---|---|
| 3.0 | 3.1 | None | None | None | None | None | None | None |

No red flags detected.
| Revenue 2024 Per Share | Revenue 2025e Per Share | Revenue 2026e Per Share | Revenue 24 to 25e [%] | Revenue 25e to 26e [%] | EBITDA 2024 Per Share | EBITDA 2025e Per Share | EBITDA 2026e Per Share | EBITDA 24 to 25e [%] | EBITDA 25e to 26e [%] |
|---|---|---|---|---|---|---|---|---|---|
| None | None | None | None | None | None | None | None | None | None |


| Price To Sales | Price To Book | PER 2023 | PER 2024 | 13Y Median PER Low | PER 2025e | 13Y Median PER High | PER 2026e | Last Updated |
|---|---|---|---|---|---|---|---|---|
| 9.4 | 2.8 | None | None | None | None | None | None | None |
| Revenue 2024 Per Share | Revenue 2025e Per Share | Revenue 2026e Per Share | Revenue 24 to 25e [%] | Revenue 25e to 26e [%] | EBITDA 2024 Per Share | EBITDA 2025e Per Share | EBITDA 2026e Per Share | EBITDA 24 to 25e [%] | EBITDA 25e to 26e [%] |
|---|---|---|---|---|---|---|---|---|---|
| 0.08371 | 0.09378 | 0.10653 | 12.0 | 13.6 | -0.00089 | 0.01172 | 0.02175 | 1413.9 | 85.5 |
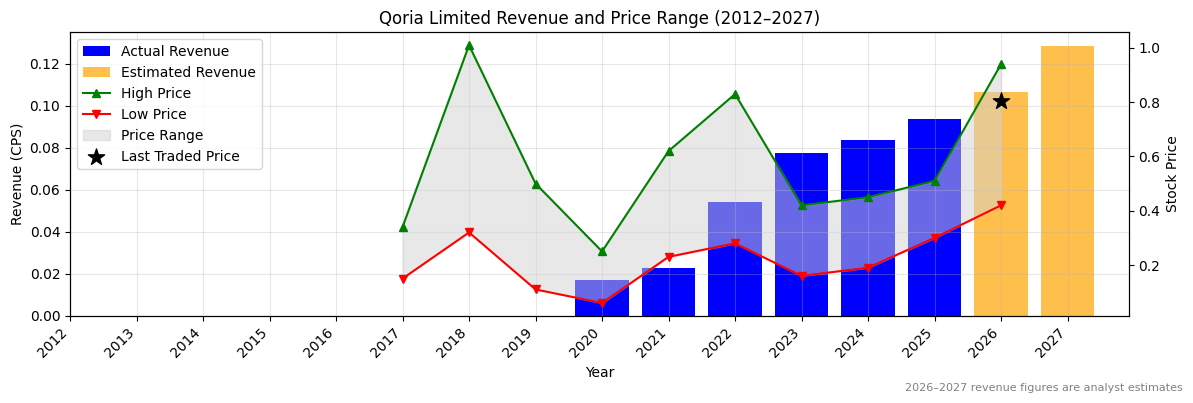


| Price To Sales | Price To Book | PER 2023 | PER 2024 | 13Y Median PER Low | PER 2025e | 13Y Median PER High | PER 2026e | Last Updated |
|---|---|---|---|---|---|---|---|---|
| 9.0 | 6.6 | -13.3 | -26.5 | None | -39.8 | None | None | 4/10/25 |