Palantir develops advanced data analytics software for government agencies, defense, and commercial enterprises, helping organizations make sense of large-scale, complex data. Its platforms, such as Gotham and Foundry, are widely used in cybersecurity, intelligence, and finance.
Ticker code: PLTR
Sector: Technology | Industry: Software – Infrastructure | Website: https://www.palantir.com
Market Information
| Market Capitalisation | Enterprise Value | Shares Outstanding | Free Float [%] | Free Float Value |
|---|---|---|---|---|
| $414,583,792,386 | $408,381,411,554 | 2284334012 | 96.15 | $398,617,464,691 |
Balance Sheet & Quality
| Equity | Cash | Debt | Return On Equity (ROE) | EBITDA 25 Margin [%] | Net Debt / Equity [%] | Rule of 40 |
|---|---|---|---|---|---|---|
| $6,316,183,768 | $6,437,816,832 | $235,436,000 | 17.0 | 39.4 | -98.2 | 63.3 |
Technicals & Short Data
| 3EMA Status | Volatility [%] | Value Traded Today | Average Daily Liquidity | Short [%] | Days To Cover |
|---|---|---|---|---|---|
| Positive | 10.1 | $5,494,812,278 | $9,598,442,501 | 0.0 | 0.0 |
Dividends
| Previous Dividend | Last Dividend | Franking [%] | Ex-Div Date | Gross Yield [%] |
|---|---|---|---|---|
| None | None | None | None | 0.0 |
Price Performance Snapshot
| Last Traded Price | Change [%] | 1 Week [%] | 1 Month [%] | 3 Months [%] | 6 Months [%] | 12 Months [%] |
|---|---|---|---|---|---|---|
| $181.490 | -0.1 | 6.3 | -6.3 | 30.5 | 145.2 | 150.3 |
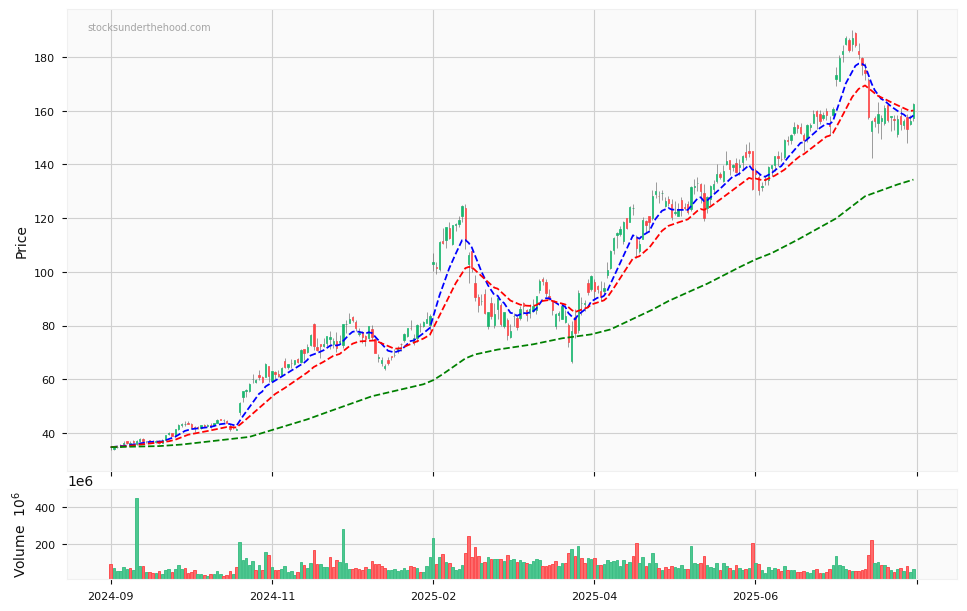
PLTR Price Chart with Volume and 3EMA
PLTR Short Positions
No chart available for this company.
Click HERE to understand why the above moving averages have been chosen.