Ticker code: PNR
PNR Red Flags & Risk Indicators
❌
❌
⚠️ RED FLAGS: 3 identified
- Large Share Issuance
- High Price to Book vs ROE
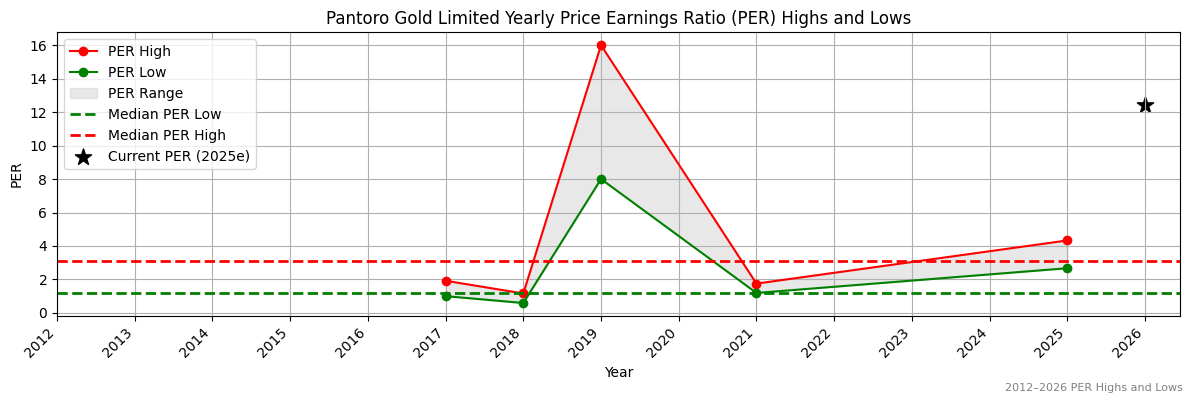
- High Relative Valuation
Income Statement
| Revenue 2024 Per Share | Revenue 2025e Per Share | Revenue 2026e Per Share | Revenue 24 to 25e [%] | Revenue 25e to 26e [%] | EBITDA 2024 Per Share | EBITDA 2025e Per Share | EBITDA 2026e Per Share | EBITDA 24 to 25e [%] | EBITDA 25e to 26e [%] |
|---|---|---|---|---|---|---|---|---|---|
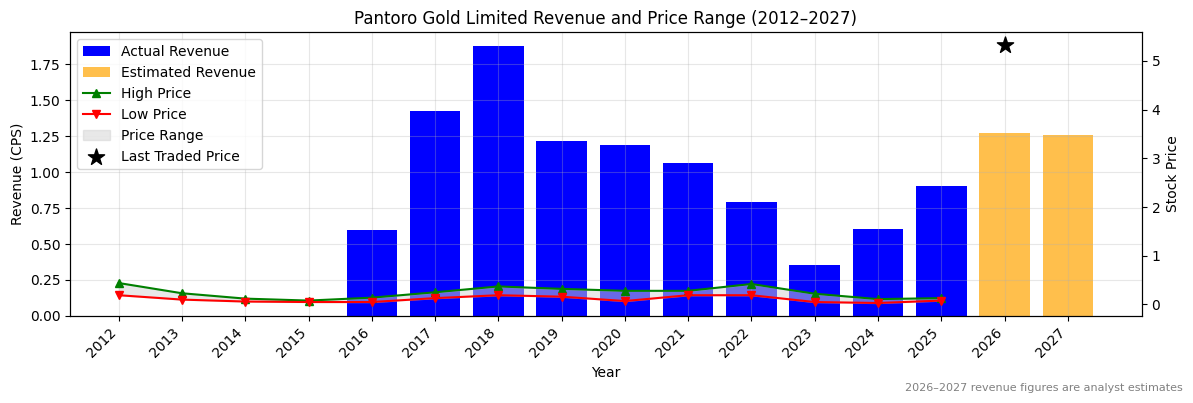
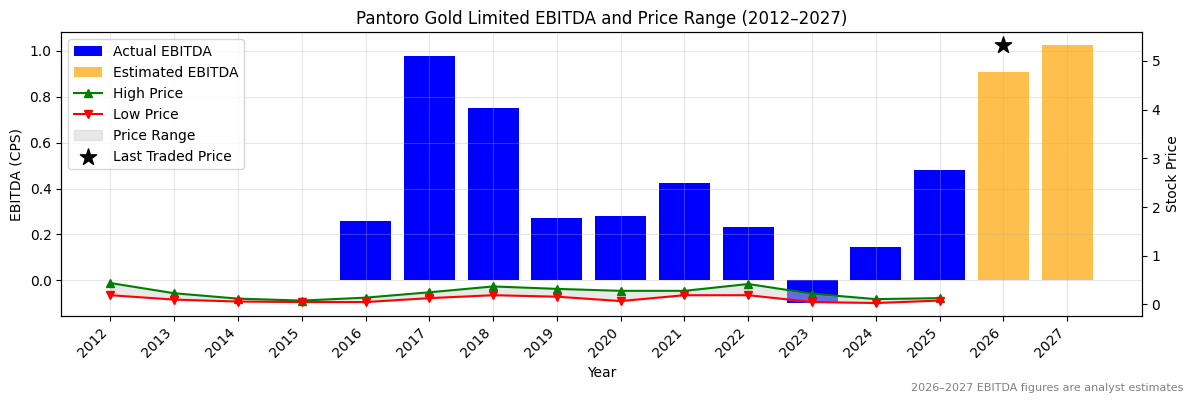
| 0.6044 | 0.90686 | 1.27061 | 50.0 | 40.1 | 0.14613 | 0.48215 | 0.90991 | 230.0 | 88.7 |
PNR Revenue Per Share (2012–2027)
✅✅
✅✅
PNR Earnings before Interest, Tax, Depreciation and Amortisation (EBITDA) Per Share (2012–2027)
✅✅
✅✅
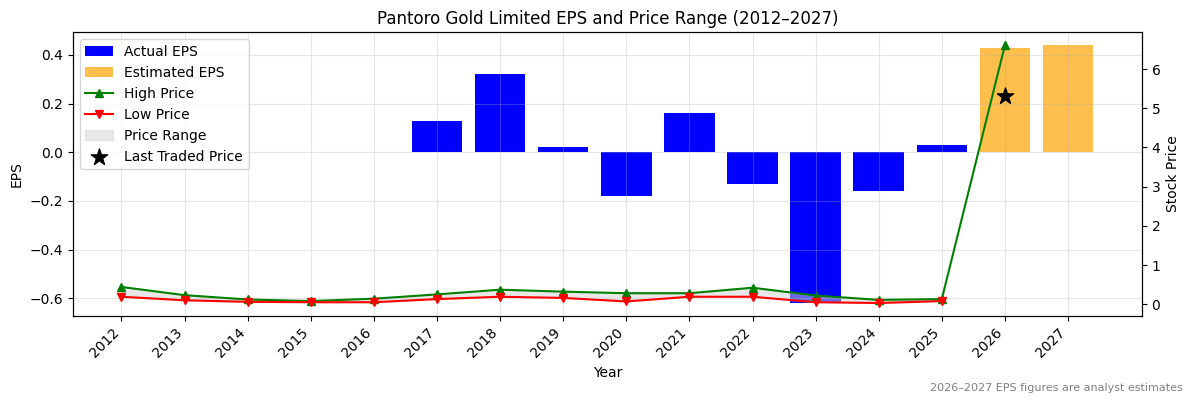
PNR Normalised Earnings Per Share (EPS) (2012–2027)
✅✅
✅✅
Valuation
| Price To Sales | Price To Book | PER 2023 | PER 2024 | 13Y Median PER Low | PER 2025e | 13Y Median PER High | PER 2026e | Last Updated |
|---|---|---|---|---|---|---|---|---|
| 5.9 | 4.1 | -8.6 | -33.3 | 1.2 | 177.3 | 3.1 | 12.4 | 4/10/25 |
PNR Yearly Price Earnings Ratio (PER) Highs and Lows
❌
❌
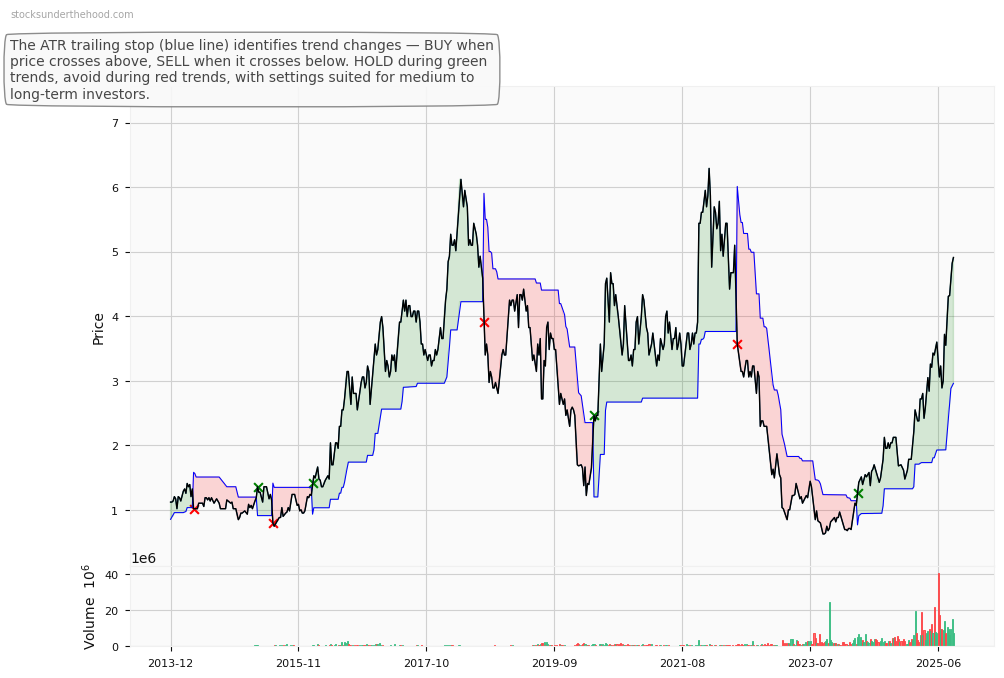
PNR Weekly Price Chart with Average True Range (ATR) Trailing Stop (10-Year View)