PEXA Group Limited operates a digital property exchange platform in Australia, facilitating electronic lodgment and settlement of property transactions, streamlining the conveyancing process for practitioners and financial institutions.
Ticker code: PXA
Sector: Technology | Industry: Software – Application | Website: https://www.pexa.com.au
Market Information
| Market Capitalisation | Enterprise Value | Shares Outstanding | Free Float [%] | Free Float Value |
|---|---|---|---|---|
| $2,589,435,136 | $2,796,317,696 | 177601862 | 68.06 | $1,762,450,993 |
Balance Sheet & Quality
| Equity | Cash | Debt | Return On Equity (ROE) | EBITDA 25 Margin [%] | Net Debt / Equity [%] | Rule of 40 |
|---|---|---|---|---|---|---|
| $1,154,234,529 | $70,674,000 | $324,156,000 | None | None | 22.0 | None |
Technicals & Short Data
| 3EMA Status | Volatility [%] | Value Traded Today | Average Daily Liquidity | Short [%] | Days To Cover |
|---|---|---|---|---|---|
| Negative | 3.1 | $4,722,797 | $5,204,069 | None | 0.0 |
Dividends
| Previous Dividend | Last Dividend | Franking [%] | Ex-Div Date | Gross Yield [%] |
|---|---|---|---|---|
| None | None | None | None | None |
Price Performance Snapshot
| Last Traded Price | Change [%] | 1 Week [%] | 1 Month [%] | 3 Months [%] | 6 Months [%] | 12 Months [%] |
|---|---|---|---|---|---|---|
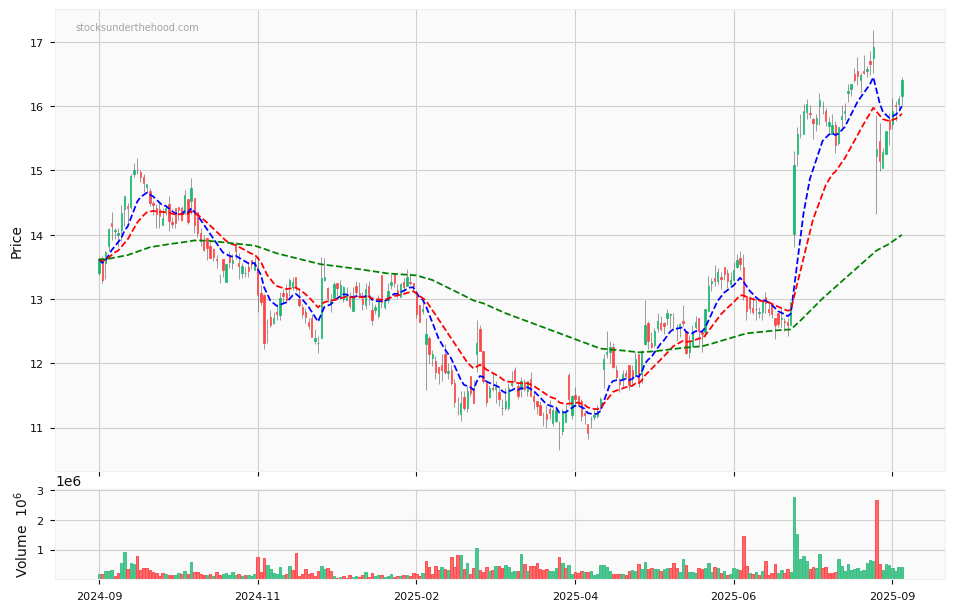
| $14.580 | -0.7 | 1.0 | None | -8.4 | 18.2 | 14.6 |
PXA Price Chart with Volume and 3EMA
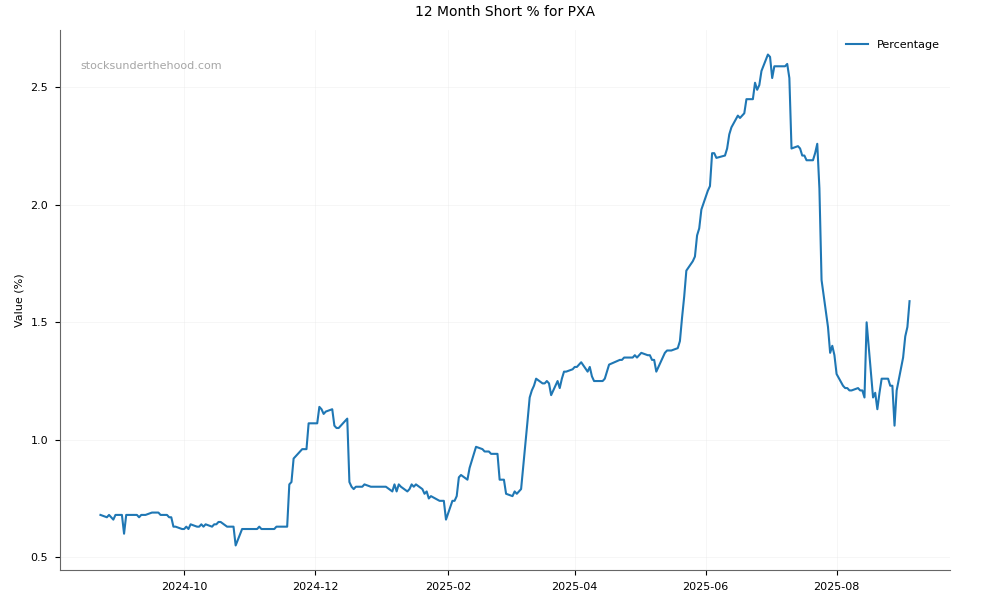
PXA Short Positions
Click HERE to understand why the above moving averages have been chosen.