Prophecy International Holdings Ltd develops and markets software solutions, including eMite, a real-time analytics and dashboard platform, and Snare, a suite of centralized log management and security analytics tools.
Ticker code: PRO
Sector: Technology | Industry: Software – Application | Website: https://www.prophecyinternational.com
Market Information
| Market Capitalisation | Enterprise Value | Shares Outstanding | Free Float [%] | Free Float Value |
|---|---|---|---|---|
| $11,062,941 | $6,626,363 | 73752934 | 70.01 | $7,745,630 |
Balance Sheet & Quality
| Equity | Cash | Debt | Return On Equity (ROE) | EBITDA 25 Margin [%] | Net Debt / Equity [%] | Rule of 40 |
|---|---|---|---|---|---|---|
| $1,475,059 | $4,930,602 | $494,024 | 0.0 | None | -300.8 | None |
Technicals & Short Data
| 3EMA Status | Volatility [%] | Value Traded Today | Average Daily Liquidity | Short [%] | Days To Cover |
|---|---|---|---|---|---|
| Negative | 10.7 | $1,757 | $8,084 | 0.0 | 0.0 |
Dividends
| Previous Dividend | Last Dividend | Franking [%] | Ex-Div Date | Gross Yield [%] |
|---|---|---|---|---|
| None | None | None | 2020-03-04 | 0.0 |
Price Performance Snapshot
| Last Traded Price | Change [%] | 1 Week [%] | 1 Month [%] | 3 Months [%] | 6 Months [%] | 12 Months [%] |
|---|---|---|---|---|---|---|
| $0.150 | None | -6.2 | -16.7 | -56.5 | -65.5 | -72.5 |
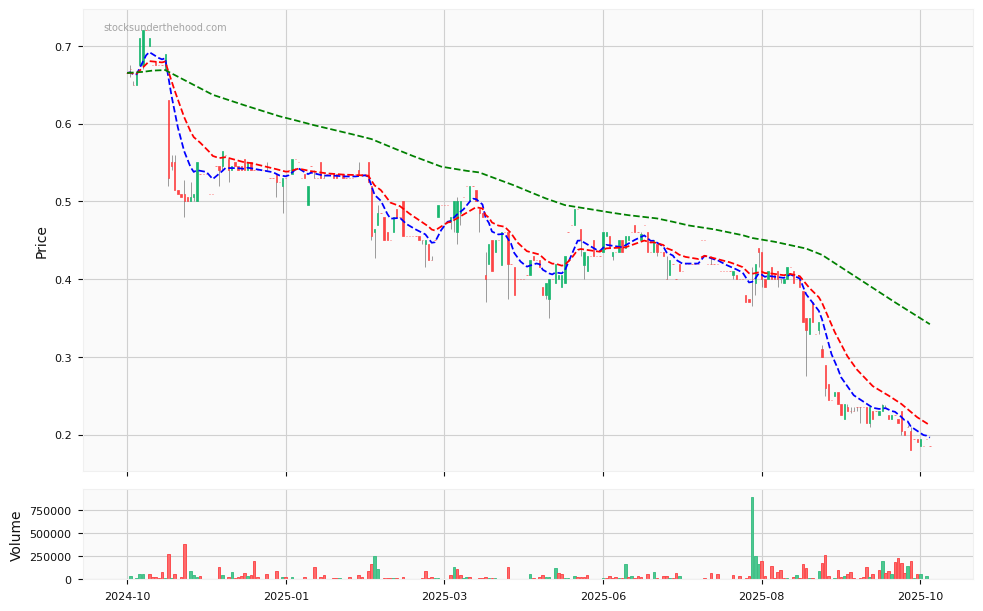
PRO Price Chart with Volume and 3EMA
PRO Short Positions

Click HERE to understand why the above moving averages have been chosen.