Ticker code: QAN
QAN Red Flags & Risk Indicators
⚠️
⚠️
⚠️ RED FLAGS: 1 identified
- More Net Debt Than Equity
Income Statement
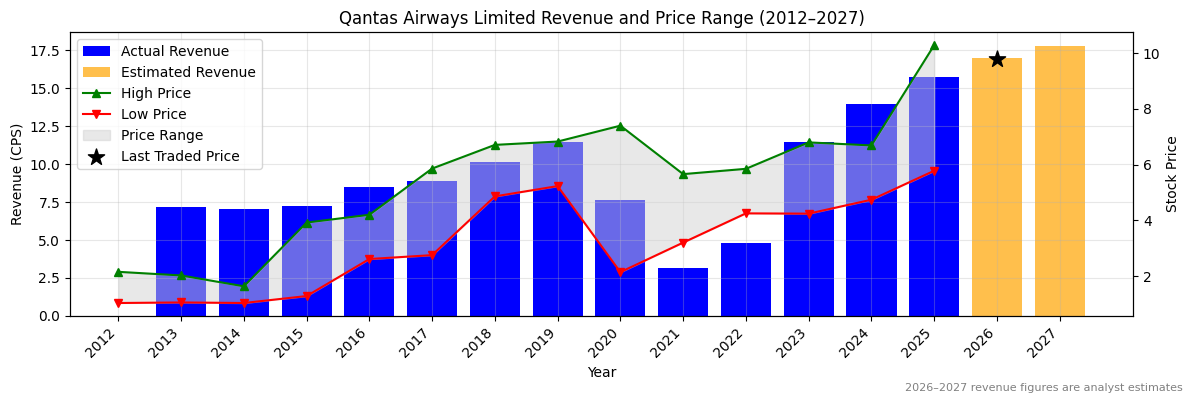
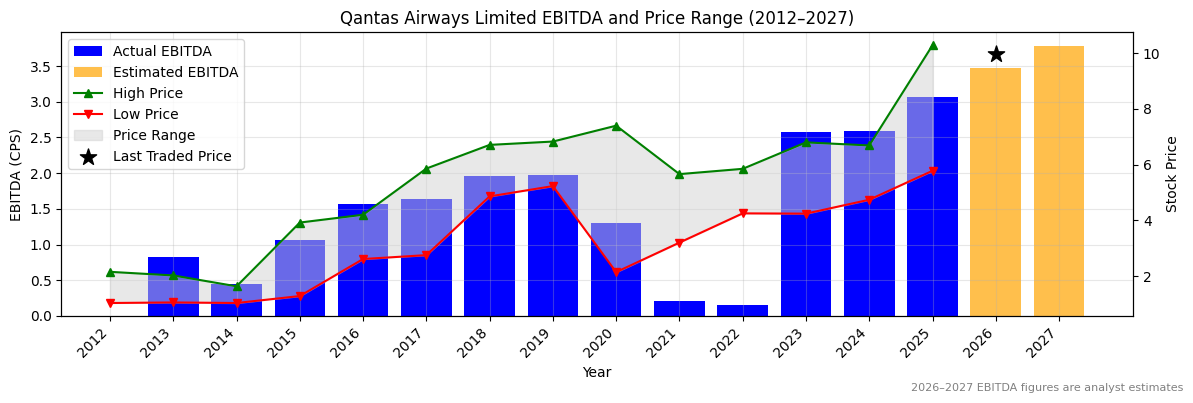
| Revenue 2024 Per Share | Revenue 2025e Per Share | Revenue 2026e Per Share | Revenue 24 to 25e [%] | Revenue 25e to 26e [%] | EBITDA 2024 Per Share | EBITDA 2025e Per Share | EBITDA 2026e Per Share | EBITDA 24 to 25e [%] | EBITDA 25e to 26e [%] |
|---|---|---|---|---|---|---|---|---|---|
| 13.98903 | 15.74346 | 16.9774 | 12.5 | 7.8 | 2.58369 | 3.06503 | 3.47137 | 18.6 | 13.3 |
QAN Revenue Per Share (2012–2027)
✅
✅
QAN Earnings before Interest, Tax, Depreciation and Amortisation (EBITDA) Per Share (2012–2027)
✅
✅
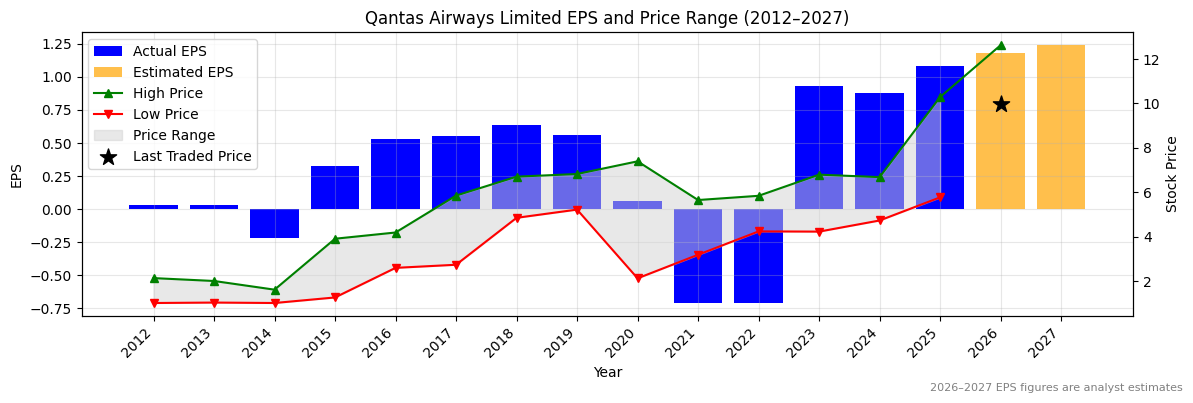
QAN Normalised Earnings Per Share (EPS) (2012–2027)
✅✅
✅✅
Valuation
| Price To Sales | Price To Book | PER 2023 | PER 2024 | 13Y Median PER Low | PER 2025e | 13Y Median PER High | PER 2026e | Last Updated |
|---|---|---|---|---|---|---|---|---|
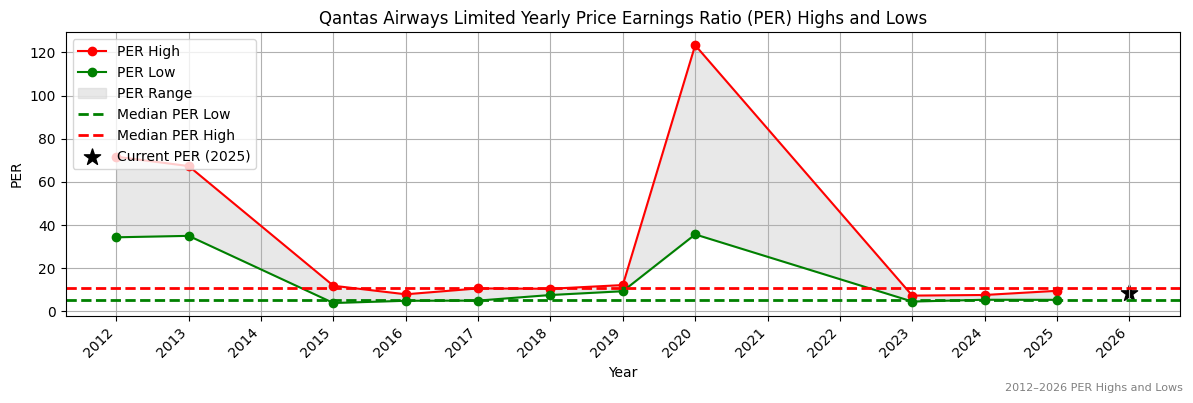
| 0.6 | 19.8 | 11.0 | 11.6 | 5.4 | 9.4 | 10.7 | 8.6 | 26/10/25 |
QAN Yearly Price Earnings Ratio (PER) Highs and Lows
✅
✅
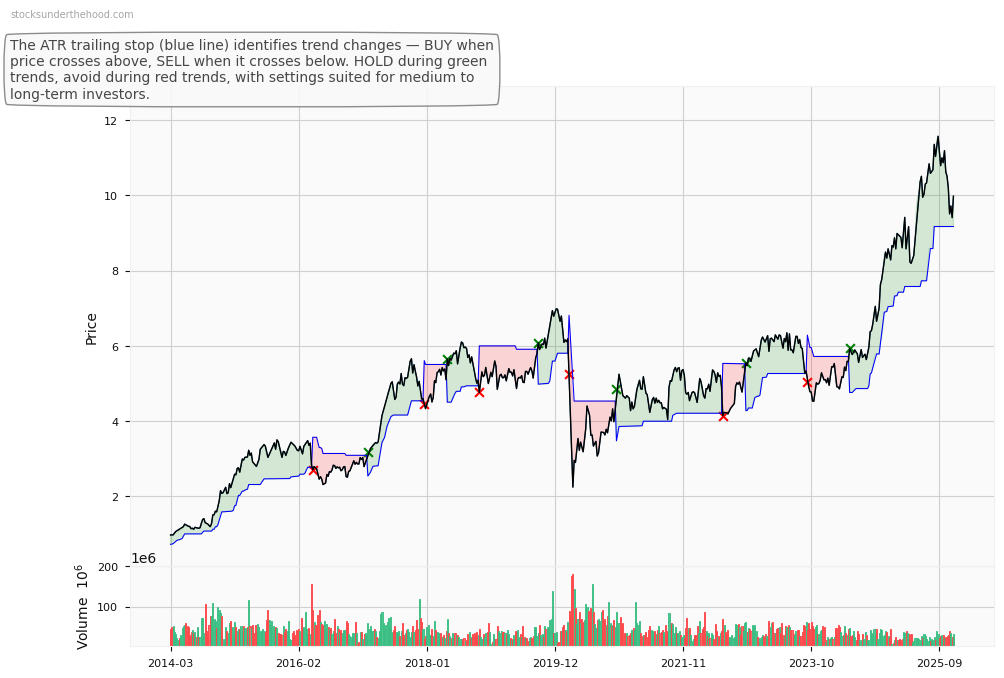
QAN Weekly Price Chart with Average True Range (ATR) Trailing Stop (10-Year View)