QBE Insurance Group Limited is a global insurance and reinsurance company, offering a diverse portfolio of commercial, personal, and specialty products and risk management solutions across multiple regions.
Ticker code: QBE
Sector: Financial Services | Industry: Insurance – Property & Casualty | Website: https://www.qbe.com
Market Information
| Market Capitalisation | Enterprise Value | Shares Outstanding | Free Float [%] | Free Float Value |
|---|---|---|---|---|
| $29,071,290,729 | $26,682,291,049 | 1510196921 | 99.9 | $29,041,629,925 |
Balance Sheet & Quality
| Equity | Cash | Debt | Return On Equity (ROE) | EBITDA 25 Margin [%] | Net Debt / Equity [%] | Rule of 40 |
|---|---|---|---|---|---|---|
| $10,897,580,683 | $6,314,999,808 | $3,926,000,128 | 26.9 | 15.6 | -21.9 | 14.8 |
Technicals & Short Data
| 3EMA Status | Volatility [%] | Value Traded Today | Average Daily Liquidity | Short [%] | Days To Cover |
|---|---|---|---|---|---|
| Negative | 5.2 | $55,875,820 | $69,745,022 | 0.17 | 0.7 |
Dividends
| Previous Dividend | Last Dividend | Franking [%] | Ex-Div Date | Gross Yield [%] |
|---|---|---|---|---|
| $0.630 | $0.310 | 10.0 | 2025-08-19 | 1.7 |
Price Performance Snapshot
| Last Traded Price | Change [%] | 1 Week [%] | 1 Month [%] | 3 Months [%] | 6 Months [%] | 12 Months [%] |
|---|---|---|---|---|---|---|
| $19.250 | 1.2 | -1.0 | -4.5 | -11.0 | -17.6 | 2.8 |
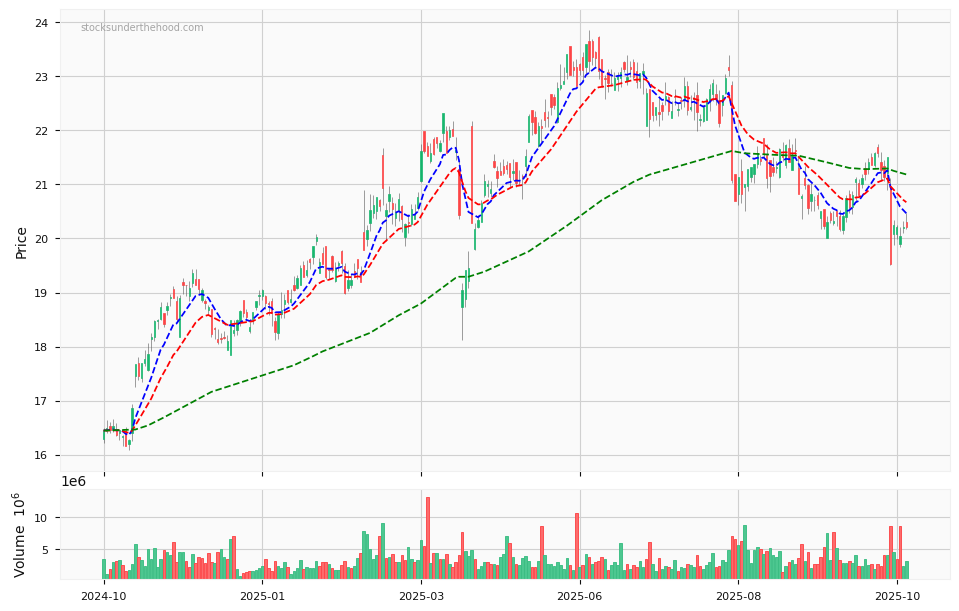
QBE Price Chart with Volume and 3EMA
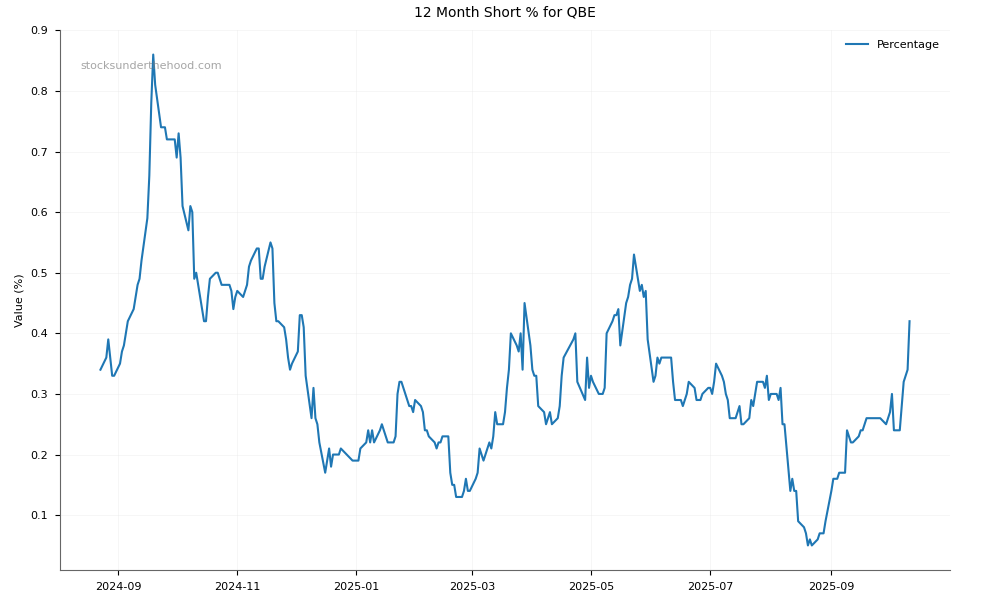
QBE Short Positions
Click HERE to understand why the above moving averages have been chosen.