Ramelius Resources Limited is an Australian gold producer, engaged in the exploration, development, and mining of gold properties, with operations primarily in Western Australia.
Ticker code: RMS
Sector: Basic Materials | Industry: Gold | Website: https://www.rameliusresources.com.au
Market Information
| Market Capitalisation | Enterprise Value | Shares Outstanding | Free Float [%] | Free Float Value |
|---|---|---|---|---|
| $6,506,043,139 | $5,786,781,163 | 1924864769 | 59.02 | $3,839,945,281 |
Balance Sheet & Quality
| Equity | Cash | Debt | Return On Equity (ROE) | EBITDA 25 Margin [%] | Net Debt / Equity [%] | Rule of 40 |
|---|---|---|---|---|---|---|
| $3,164,477,742 | $783,678,976 | $64,417,000 | 11.3 | 68.8 | -22.7 | 85.9 |
Technicals & Short Data
| 3EMA Status | Volatility [%] | Value Traded Today | Average Daily Liquidity | Short [%] | Days To Cover |
|---|---|---|---|---|---|
| Partial | 8.1 | $20,522,823 | $51,448,854 | 2.7 | 3.4 |
Dividends
| Previous Dividend | Last Dividend | Franking [%] | Ex-Div Date | Gross Yield [%] |
|---|---|---|---|---|
| $0.030 | $0.050 | 100.0 | 2025-09-15 | 2.1 |
Price Performance Snapshot
| Last Traded Price | Change [%] | 1 Week [%] | 1 Month [%] | 3 Months [%] | 6 Months [%] | 12 Months [%] |
|---|---|---|---|---|---|---|
| $3.380 | -3.4 | -6.4 | -3.7 | -0.1 | 21.1 | 46.6 |
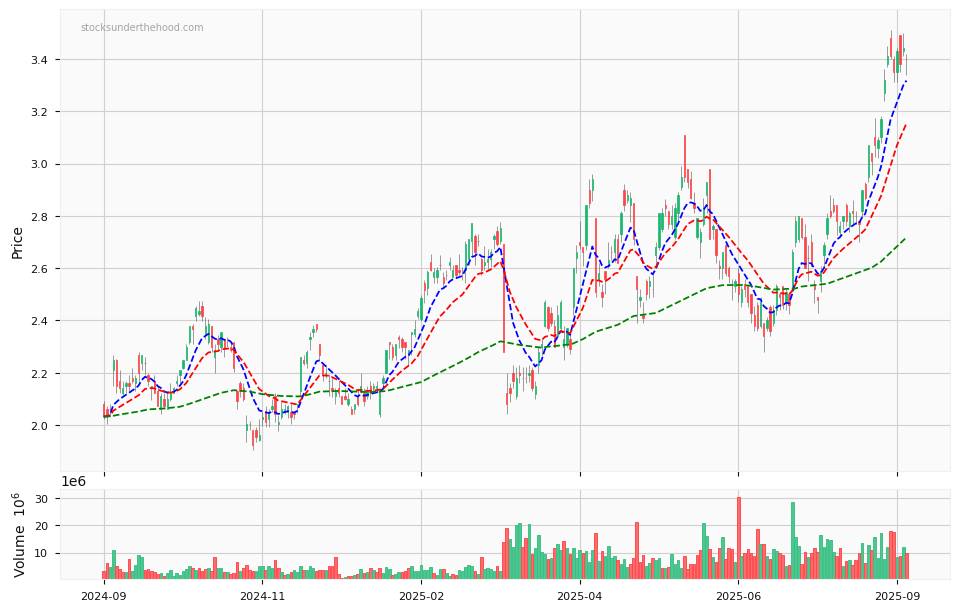
RMS Price Chart with Volume and 3EMA
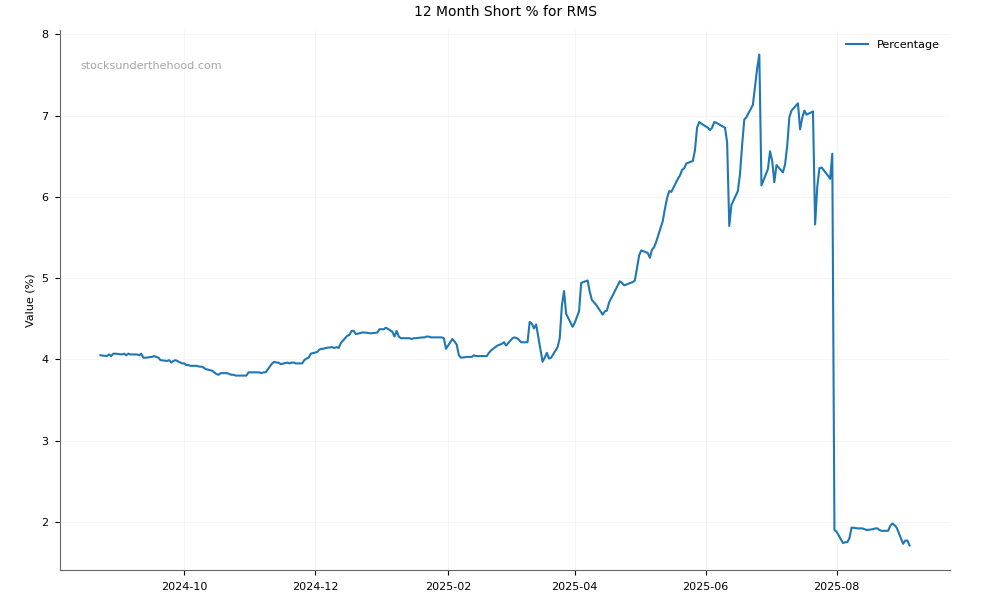
RMS Short Positions
Click HERE to understand why the above moving averages have been chosen.