Ridley Corporation Limited is an Australian company specializing in the production of high-quality animal nutrition solutions, supplying feed and ingredients to the agriculture sector.
Ticker code: RIC
Sector: Consumer Defensive | Industry: Packaged Foods | Website: https://www.ridley.com.au
Market Information
| Market Capitalisation | Enterprise Value | Shares Outstanding | Free Float [%] | Free Float Value |
|---|---|---|---|---|
| $982,115,011 | $991,610,011 | 374853074 | 81.07 | $796,239,923 |
Balance Sheet & Quality
| Equity | Cash | Debt | Return On Equity (ROE) | EBITDA 25 Margin [%] | Net Debt / Equity [%] | Rule of 40 |
|---|---|---|---|---|---|---|
| $458,070,476 | $84,671,000 | $94,166,000 | 12.3 | 8.0 | 2.1 | -2.9 |
Technicals & Short Data
| 3EMA Status | Volatility [%] | Value Traded Today | Average Daily Liquidity | Short [%] | Days To Cover |
|---|---|---|---|---|---|
| Negative | 7.9 | $1,370,792 | $2,532,874 | 0.62 | 2.4 |
Dividends
| Previous Dividend | Last Dividend | Franking [%] | Ex-Div Date | Gross Yield [%] |
|---|---|---|---|---|
| $0.047 | $0.050 | 100.0 | 2025-10-06 | 2.7 |
Price Performance Snapshot
| Last Traded Price | Change [%] | 1 Week [%] | 1 Month [%] | 3 Months [%] | 6 Months [%] | 12 Months [%] |
|---|---|---|---|---|---|---|
| $2.620 | -1.1 | -0.4 | -9.3 | -15.7 | -0.6 | 0.1 |
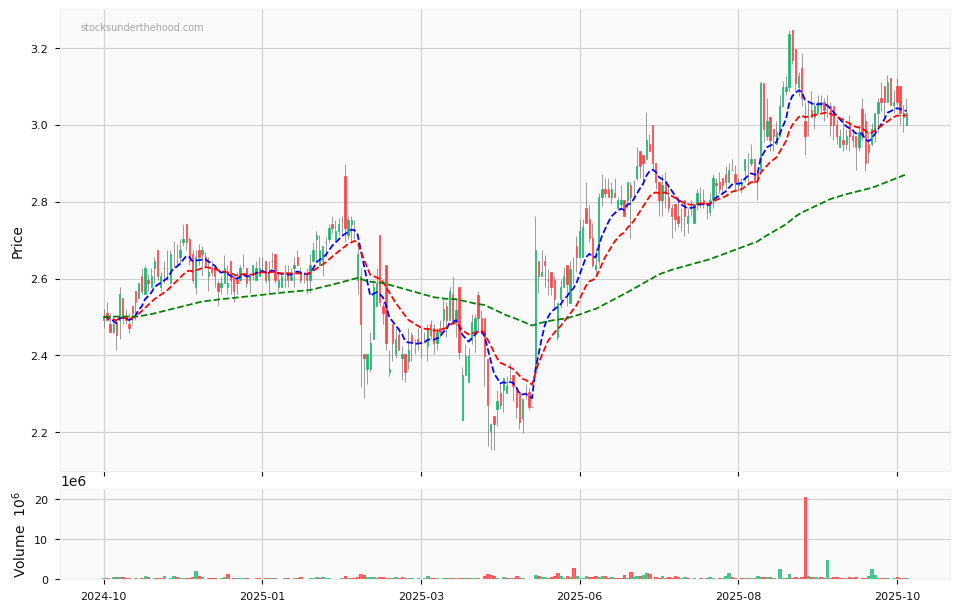
RIC Price Chart with Volume and 3EMA
RIC Short Positions

Click HERE to understand why the above moving averages have been chosen.