Russell 2000 Index measures the performance of approximately 2,000 smallest-cap American companies in the Russell 3000 Index.
Ticker code: ^RUT
Sector: Index | Industry: Index | Website: N/A
Market Information
| Market Capitalisation | Enterprise Value | Shares Outstanding | Free Float [%] | Free Float Value |
|---|---|---|---|---|
| None | None | None | 0.0 | #VALUE! |
Balance Sheet & Quality
| Equity | Cash | Debt | Return On Equity (ROE) | EBITDA 24 Margin [%] | Net Debt / Equity [%] | Rule of 40 |
|---|---|---|---|---|---|---|
| None | None | None | None | None | 0.0 | None |
Technicals & Short Data
| 3EMA Status | Volatility [%] | Value Traded Today | Average Daily Liquidity | Short [%] | Days To Cover |
|---|---|---|---|---|---|
| None | None | $4,806,394,681,422 | $31,480,961,821,453 | None | 0.0 |
Dividends
| Previous Dividend | Last Dividend | Franking [%] | Ex-Div Date | Gross Yield [%] |
|---|---|---|---|---|
| None | None | None | None | None |
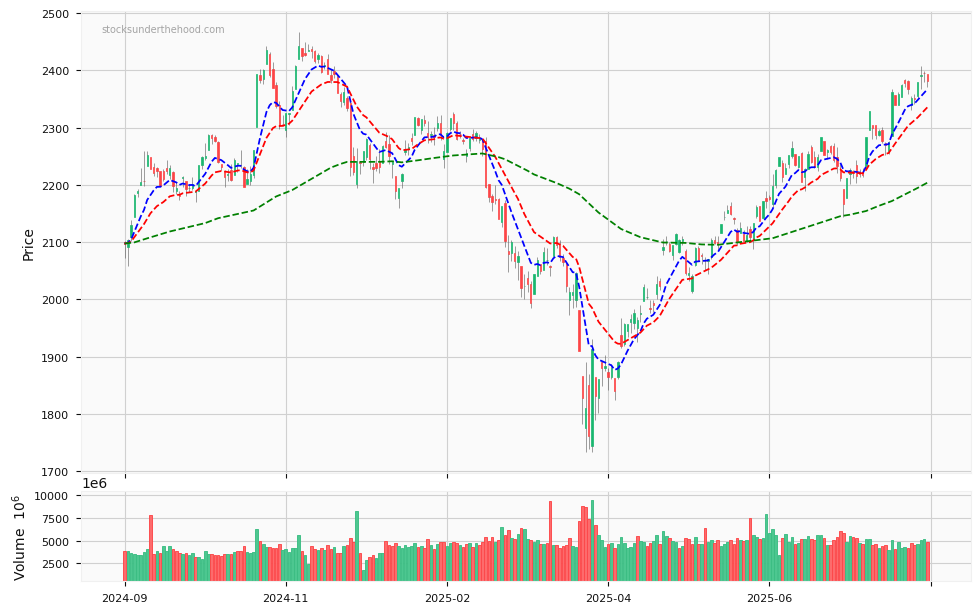
^RUT Price Chart with Volume and 3EMA
^RUT Short Positions
No chart available for this company.
Click HERE to understand why the above moving averages have been chosen.